Quantcast
Channel: EHSQL(Environment-Energy ,Health,Safety, Security and Social Ac. ,Quality-Lab) Technical services
Viewing all 8077 articles
Browse latest View live

Oxidative Stress and Air Pollution Exposure

$
0
0

Journal of Toxicology
Volume 2011 (2011), Article ID 487074, 9 pages
doi:10.1155/2011/487074Review ArticleOxidative Stress and Air Pollution ExposureMaura Lodovici and Elisabetta BigagliDepartment of Pharmacology and Toxicology, University of Florence, Viale Pieraccini 6, 50139 Florence,  ItalyReceived 15 December 2010; Revised 10 May 2011; Accepted 30 June 2011Academic Editor: Susan Sumner Copyright © 2011 Maura Lodovici and Elisabetta Bigagli. .AbstractAir pollution is associated with increased cardiovascular and pulmonary morbidity and mortality.
The mechanisms of air pollution-induced health effects involve oxidative stress and inflammation. As a matter of fact, particulate matter (PM), especially fine (PM2.5, PM<2.5μm) and ultrafine (PM0.1, PM<0.1μm) particles, ozone, nitrogen oxides, and transition metals, are potent oxidants or able to generate reactive oxygen species (ROS). Oxidative stress can trigger redox-sensitive pathways that lead to different biological processes such as inflammation and cell death. However, it does appear that the susceptibility of target organ to oxidative injury also depends upon its ability to upregulate protective scavenging systems. As vehicular traffic is known to importantly contribute to PM exposure, its intensity and quality must be strongly relevant determinants of the qualitative characteristics of PM spread in the atmosphere. Change in the composition of this PM is likely to modify its health impact.1. IntroductionNumerous epidemiological studies have shown an increased morbidity and mortality due to environmental air pollution [1, 2]. Environmental air does contain a complex mixture of toxics, including particulate matter (PM), irritant gases, and benzene. The chemical composition of particles does vary greatly and depends on numerous geographical, meteorological, and source-specific variables. Generally, environmental particles include inorganic components (sulfates, nitrates, ammonium, chloride, and trace metals), elemental and organic carbon,  biological components (bacteria, spores, and pollens), and adsorbed volatile and semivolatile organic compounds [3]. In addition, environmental particles, when mixed with atmospheric gases (ozone, sulfur nitric oxides, and carbon monoxide) can generate environmental aerosols. Particles are usually defined as PM10 and PM2.5 with diameter less than 10 and 2.5μm, respectively. Any  fraction may have different effects; that is, PM with aerodynamic diameter less than 10 to 2.5μm   does generate a bigger amount of  hydroxyl radical due to the heavy metals adsorbed on the pores and surfaces of the particles, whereas particles of larger size (PM10) deposit mainly in the upper airways and can be cleared by the mucociliary system [4, 5]. Recently, however, interest has also focused on the ultrafine particles (UFPs) with a diameter less than 100nm; UFPs are considered important with respect to health effects because of their very high alveolar deposition fraction, large surface area, chemical composition, and ability to enter into the circulation and induce inflammation. Vehicle emissions, in particular related to diesel engines, diesel exhaust particles (DEPs), are a major source of environmental UFPs, which in the presence of poor ventilation may penetrate indoor, where additional sources including environmental tobacco smoke, cooking, burning of candles, and chemical reactions are present [6–10]. Long-term exposure to high levels of such particles can increase risk of cancer, respiratory diseases, and arteriosclerosis, whereas short-term exposure peaks  can cause exacerbation of bronchitis, asthma, and other respiratory diseases as well as changes in heart-rate variability [2, 11–13]. The general consensus does indicate that the mechanism of air pollution-induced health effects involves an inflammation-related cascade and oxidation stress both in lung, vascular, and heart tissue [14–19]. Inflammation is initially  a protective mechanism which removes  the injurious stimuli and produces reactive oxygen species (ROS) able to induce cell killing. In the early phase of inflammation, oxidant stress does not  directly cause cell damage and  can induce the transcription of stress defense genes including antioxidant genes. This preconditioning effect of ROS enhances the resistance against future inflammatory oxidant stress and promotes the initiation of tissue repair processes. The additional release of cell contents amplifies the inflammatory process and consequently can induce tissue injury [20]. Oxidation damage has been implicated in many degenerative and nondegenerative diseases, including cardiovascular and pulmonary diseases, diabetes, and Alzheimer disease. Oxidation stress derived from an unbalance between ROS formation and individual antioxidant activity potentially does lead to damage of lipids, proteins, and macromolecules such as DNA and RNA [21]. This paper will focus on the mechanisms of oxidative stress induction and cellular damage by air pollution exposure on pulmonary and cardiovascular systems.2. Possible Mechanisms of Oxidative Stress Induced by Air Pollution ExposureIn the last decades, great attention has been paid  to air pollution exposure due to vehicular traffic and other combustion processes. PM and gas pollutants are considered to be the most important factors in urban areas, and several mechanisms have been hypothesized to explain the adverse health effects in humans, especially in the cardiopulmonary system [22]. Although each air pollutant can exert its own specific toxicity in the respiratory and cardiovascular systems, ozone, oxides of nitrogen, and suspended particulates all share a common property of being potent oxidants, either through direct effects on lipids and proteins or indirectly through the activation of intracellular oxidant pathways [23–25].ROS can be generated from the surface of particles where polycyclic aromatic hydrocarbons  (PAH) and nitro-PAH are adsorbed, other than transition metals (iron, copper, chromium, and vanadium) that catalyzing Fenton’s reaction (Fe2+ + H2O2 + H+ →  Fe3+ + OH• + H2O) generate the highly reactive hydroxyl radical able to induce oxidative DNA damage [26, 27]. Several studies have shown that iron and other transition metals leaching from particles or by their presence on particle surfaces play a role in the generation of ROS in biological systems [28]. Particles bound benzo(a)pyrene has been shown to be bioavailable and can induce oxidative DNA damage in systemic target organs, including lung and kidney [29, 30]. Moreover, it should be noted that ozone and nitrogen dioxide are usually present together with particles in environmental air. They are also oxidants with potential effects in terms of oxidative DNA damage. Similarly, volatile compounds, such as benzene, in urban air pollution can induce DNA oxidation [31, 32]. In addition, photochemical oxidants (ozone and peroxyacetyl nitrate), secondary pollutants formed by the action of sunlight on an atmosphere that does contain reactive hydrocarbons and NOx, contribute to increase oxidation stress [33]. Then, in the presence of high ROS formation,  mitochondrial damage with induction of  NADPH- oxidase isoform 4 (NOX4) does occur,   together with an  activation of inflammatory cells (neutrophils,  eosinophils, and monocytes) and increased numbers of macrophages capable of ROS and reactive nitrogen species generation [34–36]. Initially, when oxidative stress is relatively low, various transcription factors, such as the nuclear factor erythroid-2 (Nrf2), induce a series of antioxidant and detoxification enzymes (e.g., catalase, superoxide dismutase, and glutathione S-transferase) that counteract ROS formation protecting from adverse biological outcomes [37, 38]. In the second phase, if the protective antioxidant response fails or is inadequate to deal with increasing ROS production, the result is a proinflammatory situation with various cytotoxic effects [39]. These effects are mediated by the redox-sensitive mitogen-activated protein kinase (MAPK) and NF-κB cascades that are responsible for the expression of cytokines, chemokines, and adhesion molecules, which are involved in inflammatory processes [39].3. Atmospheric GasesGaseous pollutants contribute to a great extent in composition variations of the atmosphere and are mainly due to combustion of fossil fuels and to emission of motor vehicles [40].Ozone is a strong oxidizing agent formed in the troposphere through a complex series of reactions involving the action of sunlight in nitrogen dioxide and hydrocarbons. Ozone initiate intracellular oxidative stress through ozonide and hydroperoxide formation. This mechanism of oxidative damage involves the activation of Nrf2, heat shock protein 70, NF-κB, increased expression of a range of proinflammatory cytokines (TNFα and interleukin 1β), chemokines (e.g., interleukin 8), and adhesion genes; ozone is also an activator of protein-1 fos and c-jun  onco genes [41, 42]. The major source of anthropogenic emissions of nitrogen oxides into the atmosphere is the combustion of fossil fuels deriving from stationary sources (heating, power generation) and motor vehicles. In environmental conditions, nitric oxide is rapidly transformed into nitrogen dioxide by atmospheric oxidants such as ozone [43].Various antioxidants, like ascorbic acid, uric acid, and thiols, act as powerful scavengers of O3 and NO2• radical in body fluids, likely protecting lung lining fluids against inhaled oxidizing air pollutants [44]. When such defense mechanisms are overwhelmed, O3 may injure the underlying cells by inducing lipid peroxidation and activating inflammatory gene expression [45].  In vitro and in vivo studies, both in animals and human beings, confirm the capacity of nitrogen dioxide to activate oxidant pathways although less potently than ozone [46]. Volatile organic compounds are a class of compounds which includes chemical species of organic nature such as benzene, but the majority of gaseous pollutants are inhaled and, therefore. mainly affect the respiratory and cardiovascular systems. Among gaseous pollutants, carbon monoxide (CO) has been described as one of the main pollutants responsible for the development of cardiovascular diseases [47], while benzene  can also induce haematological problems and cancer [48].  Benzene is a commonly used industrial chemical and a constituent of gasoline [31]. Inhalation is the most important route of absorption during occupation-related exposure. Benzene toxicity is attributed to its metabolism, which does lead to the formation of reactive metabolites such as hydroquinone and its oxidized form benzoquinone which  are highly reactive molecules and, by means of redox cycling, produce ROS [49].  Furthermore, the addition of antioxidant enzymes has been shown to block oxidative damage induced by the above-mentioned metabolites confirming the role of ROS production and oxidative stress in hydroquinone and benzoquinone cytotoxicity [50]. Uzma et al. [31] demonstrated that  occupation-related exposure to benzene causes oxidative stress, immune suppression, and inducing the expression of tumour-suppressing gene p53 in gasoline filling workers. These authors hypothesized that the increase in the p53 expression may block the cell cycle at G1 phase and go on to repair DNA damage, which is the initial step in tumour suppression.4. Oxidative Stress from Organic FractionAmbient PM, does consist of complex and various mixtures of particles suspended in the breathing air [50]. Major sources of PM are factories, power plants, refuse incinerators, motor vehicles, building activity, fires, and natural windblown dust. The size of the particles vary, and there is strong evidence supporting that ultrafine and fine particles are more hazardous than larger ones in terms of mortality and cardiovascular and respiratory effects [51].Results from various surveys have demonstrated that oxidative potential of fine and ultrafine particles is the result of significant amounts of organic carbon compounds, such as quinones and PAHs. In the organic fraction originating in the air from incomplete combustion processes, the major reactive and toxic compounds are substituted (e.g., methyl naphthalene)  and unsubstituted  PAH, nitro-PAH (1-nitropyrene and 3-nitro-fluoranthene),  dinitro-PAH (dinitro pyrene) and  peroxyacetyl nitrate [52, 53]. Moreover, reactive intermediates in the oxidation of mixtures of volatile organic compounds (VOCs), oxides of nitrogen (NOx), hydroxy radical, and ozone are shown to play a central role in the formation and fate of airborne toxic chemicals, PAH, and fine particles [52]. The main pathways of metabolic activation of PAHs are generation of diol epoxides catalyzed by cytochrome P450 (CYP450), leading to DNA adduct formation, formation of radical cations catalyzed by CYP450 peroxidases, and formation of redox-active quinones [54]. Valavanidis et al. [55] demonstrated that redox-active transition metals, redox cycling quinoids and PAH act synergically to produce ROS. J. Y. C. Ma and J. K. H. Ma [56] reported that organic fraction of DEP, mainly constituent of PAH and quinones, does undergo to metabolic activation in  the lung and liver of exposed  animals, is able to induce CYP4501A1 isoform expression that generates ROS and reactive PAH-quinones. In addition, PM initiates inflammatory damage upregulating proinflammatory cytokines and chemokines; in vitro observations have shown that PM exposure may cause expression of nuclear factor NF-κB-related genes and oxidant-dependent NF-κB activation [57, 58]. To defend against oxidative damage, cells increase the production of antioxidant enzymes through the activation of the Nrf2, [37] and  PM appears to inhibit protective enzymes  involved in oxidative stress responses leading to the activation of additional intracellular signaling cascades that regulate the expression of cytokine and chemokine genes [59]. Many recent observations have shown that DEPs, because of their fine and ultrafine composition, play an important role on oxidative cellular damage through ROS generation  causing lipid peroxidation and oxidative DNA damage. Some DEPs consist of a carbon core or organic droplets  with adsorbed organic compounds, such as PAH, quinines, and redox-active metals. The capacity of DEPs to induce oxidative stress is largely related to these adsorbed components [60, 61].5. Oxidative Stress Induced by Transition MetalsTransition metals such as iron, lead, mercury, cadmium, silver, nickel, vanadium, chromium, manganese, and copper are detectable in PM2.5 and UFPs adsorbed on their surface and are capable of ROS formation by Fenton’s reaction [35]. As critical constituents of PM, transition metals were postulated to be involved in a number of pathological processes of the respiratory system through free radical-mediated damage [62]. They are natural components of the earth's crust and enter into the environment through a wide variety of sources, including combustion, waste water discharges, and manufacturing facilities. Iron is a well-known soot suppressant that might be emitted into the atmosphere in the form of ultrafine particles [63]. Zinc is a major metal element detected in traffic derived PM2.5, deriving  from waste oil samples [64]. Copper is a component of car brake pads, however, ceramic brake pads contain 10%–20% copper by mass, while the metallic brake pads contained about 70% iron with very little copper. This metal in PM has also been linked to road traffic sources associated to PM2.5 [64]. Soluble metals in inhaled particles, such as Fe, Ni, V, Co, Cu, and Cr, were associated with increased ROS production, followed by cellular oxidative stress in airway epithelial cells [65].6. Air Pollution Induced-Oxidative Damage in Target Organs: Cardiovascular and Pulmonary Systems6.1. Cardiovascular SystemDiesel and gasoline vehicle emissions in the urban areas have dominant contributions to environmental particles, especially those located in the ultrafine range. Because of their small size and large surface area, UFPs have demonstrated unique biochemical characteristics, such as enhanced ability to adsorb or absorb organic molecules and to penetrate into cellular targets in the human pulmonary and cardiovascular systems [66, 67]. UFPs may be directly transported to the cardiac vasculature, where they can induce arrhythmias, reduce myocyte contractility, and decrease coronary blood flow [10, 68]. Studies by Brook et al. [69] demonstrated that fine particulate air pollution and ozone cause acute arterial vasoconstriction in healthy humans, while Urch et al. [70] reported that fine particles exposure pollution raise blood pressure and impair vascular function. In addition, UFP exposure depresses myocardial contractile response and coronary flow in both spontaneously hypertensive and wild-type rats [71], the same observation was found by Simkhovich et al. [72] in young and old rat hearts.  Long-term exposure to low concentrations of PM2.5 has been shown to alter vasomotor tone, lead to vascular inflammation, and potentiate atherosclerosis induced by highly fat-containing chow in susceptible mice [73]. In addition, Suwa et al. [74] reported that exposure to PM10 cause progression of atherosclerotic lesions towards a more advanced phenotype hyperlipidemic rabbits. Moreover, atherosclerotic lesions of thoracic aorta were reported to be significantly increased with pronounced macrophage infiltration and lipid deposition in Apolipoprotein E (−/−) ApoE (−/−) mice exposed to PM2.5 through NADPH oxidase dependent pathways [75]. ApoE (−/−) mice exposed to ozone showed increased oxidative stress and mitochondrial DNA damage, decreased vascular endothelial nitric oxide synthase,  and significantly increased atherogenesis compared to filtered air exposed controls [76].  Recently, Cherng et al. [77] reported that DEP exposure enhances vasoconstriction and diminishes acetylcholine-induced dilatation in coronary arteries of animals in a nitric oxide synthase-dependent manner. Baccarelli et al. [78] showed that air pollution is associated with changes in the global coagulation function, after short-term exposure to air pollution in normal subjects resident in  Lombardia Region, Italy. Road traffic-related pollutants may increase a heart-rate-corrected QT interval among people with diabetes, obesity and nonsmoking elderly individuals and the number of genetic variants related to oxidative stress does increase this effect [79]. On the contrary, Mordukhovich et al. [80], despite the positive associations between blood pressure and black carbon, found no effects on gene variants related to antioxidative defense. Increases in black carbon and PM2.5 were associated with increases in blood pressure, heart-rate, endothelin-1, vascular endothelial growth factor, and oxidative stress markers and with a decrease in brachial artery diameter  in  nonsmoking seniors [81]. More recently, Kooter et al. [82] showed that diesel engine exhaust exposure induces a pulmonary antioxidant response, with an increased activity of the anti-oxidant enzymes glutathione peroxidase, superoxide dismutase, heme oxygenase-1 protein, heme oxygenase activity, and uric acid which  precedes the inflammatory response (an increase in IL-6 and TNF-α) in rats. In addition, since the authors found that increased plasma thrombogenicity and antioxidant defense gene expression in aorta tissue shortly after the exposure does occur, they hypothesized a direct translocation of diesel engine exhaust components to the vasculature even if the mediation by other pathways cannot be excluded [82].  6.2. PulmonaryA strong correlation has been found between PM concentration of redox-active compounds and damage in macrophages and bronchial epithelial cells [83–85]. Moreover, in human airway epithelial cells, organic compounds adsorbed on particle surfaces does promote inflammation through CYP1A1-mediated ROS generation and release of cytokines after activation of transduction pathways involving MAPK and the transcription factor NF-kappaB [86]. Recently, Andersson et al. [26] reported that 1-nitropyrene, one of the most abundant nitro-PAHs in diesel exhausts, induces DNA damage by ROS formation  in human endothelial cells, and this effect was mainly mediated by metabolites mainly generating by reduction of nitro group, as it has been previously reported by Topinka et al. [87] in rat hepatocytes. Increased production of ROS after PM exposure is suggested by the finding that many of the proinflammatory genes (TNF-α and IL-8, among others) induced upon exposure to PM are regulated by redox sensitive transcription factors such as NF-κB, activator protein 1 (AP-1) and CAATT/enhancer binding protein (C/EBP). Activation of these transcription factors and increased transcription of downstream genes has been reported in human alveolar and bronchial epithelial cells in response to PM exposure [88–92]. Several studies have demonstrated that air pollution particles induce inflammatory mediator release and oxidative stress in lung epithelial cells and alveolar macrophages. When reaching the bone marrow [93], cytokines and chemokines released from the lung stimulate migration of neutrophils and their precursors into the circulation. In the short-term, there is acute tissue damage with activation of the epidermal-growth-factor receptor pathway, and evidence for organ-repair responses [94]. Vanadium pentoxide (V2O5) is a component of PM derived from fuel combustion as well as a source of occupation-related exposure in humans [95]. Sørensen et al. [95] indicate that vanadium and chromium (VI) detectable in PM(2.5) have an effect on oxidative DNA damage in human  lymphocytes, after reduction to chromium (III)  in the cells. Since, outdoor PM and urinary 1-hydroxypyrene (PAH exposure marker) were synergistically associated with urinary MDA levels of schoolchildren, Bae et al. [96] concluded that exposure to PM air pollution and PAH can induce oxidative stress in schoolchildren. In addition, these authors found that urinary MDA levels are also associated with some metals bound to PM10 and PM2.5 suggesting that  metals bound to PM are responsible, at least in part, for the oxidative stress [96]. The oxidized species arising from the reaction between ozone and lining fluid are involved in the signaling cascade of inflammatory cells into the lung and contribute to the acute bronchoconstrictor response and hyperresponsiveness observed in asthma on exposure to this pollutant [97, 98]. Furthermore, has been reported that ozone is able to induce apoptosis, DNA damage, and cytotoxicity on human alveolar epithelial type I-like cells and in mice exposed to ozone for 6 weeks [99, 100]. While, Ferecatu et al. [84] reported an antiapoptotic effect of PAH adsorbed on PM2.5 that in addition to the well-documented inflammatory response may explain the persistence of a prolonged inflammation state induced after pollution exposure and might delay repair processes of injured tissues in primary cultures of human bronchial epithelial cells. Chirino et al. [101] found ROS generation and decreased glutathione and the activity of the antioxidant enzymes,  such as superoxide dismutase and glutathione reductase, in a human lung epithelial cell line exposed to PM10. Recently, it has been found that bus drivers exposed to PAH and volatile compounds displayed  a higher level of DNA instability and oxidative damage than the controls and the incidence of oxidized lesions in lymphocyte DNA correlated with exposure to benzene. Moreover, those of the drivers with at least one variant of 8-oxoguanine glycosylate 1 (hOGG1) (Cys/Cys or Ser/Cys) allele tended to have higher oxidative DNA damage in lymphocyte than those with the wild genotype [102]. In addition, in the same year Delfino et al. [103] reported that PM (ranged from 0.25 to 2.5μm) and O3 were positively associated with exhaled  nitrogen monoxide and that PM0.25, CO, and NO were positively associated with IL-6, while  ROS were associated with both outcomes  in elderly subjects enrolled.7. Defense Mechanisms against ROS FormationAntioxidants in the lung are the first line of defense against ROS [104]. The composition and quantity of antioxidants in respiratory tract lining fluids may represent an important determinant of individual responsiveness to air pollutants, but it should be thought of as a dynamic equilibrium with the antioxidant defenses within the epithelium and a more remote plasma pool [105].  Interestingly, the results obtained by Osburn and Kensler [106] demonstrated that the  activation of transcriptional factor Nrf2 determines an upregulation of antioxidant enzymes that represents an adaptive response to face the exposure to oxidant pollutants providing a pivotal defense mechanism against environmental hazards, including various air pollutants. Successively, Rubio et al. [107] observed that Nrf2 does protect against benzene metabolites in human lung cells, and knockdown of Nrf2 greatly does enhance cytotoxicity and cell death associated with reduced glutathione levels and loss of inducibility of antioxidant response elements (ARE-driven) genes.Although the interrelation among antioxidant levels in the respiratory tract, cellular and plasma levels are not well understood, it appears that the susceptibility of the lung to oxidative injury depends largely on its ability to upregulate protective scavenging systems. A recent review by Rubio et al. [108] indicates that air pollutants are Nrf2 pathway inductors which regulate the expression of cytoprotective and detoxifying enzymes as well as antioxidants having an important role in the defense against atmospheric pollutant-induced toxicity.8. ConclusionsIn conclusion, several experimental and epidemiological studies have proved  exposure to air pollution to be an important determinant of overall pulmonary and cardiovascular risk damage and  possibly have an influence on traditional risk factors. Although each environmental pollutant has its own mechanism of toxicity, most pollutants, like UFP, PM2.5, ozone, nitrogen oxides, and transition metals,  are potent oxidants or capable of ROS production. Consequently, the promotion of oxidative stress has been identified as one of the most important mechanisms responsible for toxic air pollutant effects. Oxidative stress can trigger redox-sensitive pathways that lead to different biological processes like inflammation and cell death. Recently, Environmental Pollution Agency (EPA) revised the level of the 24-h  PM2.5  standard to 35μg/m3, moved the 24-h PM10  standard from 75 at 150 μg/m3, and revoked the annual standard, because available evidence generally did not  suggest a link between long-term exposure to current ambient levels of coarse particles and health or  welfare effects [109].  However, a vast number of data indicate that in general, smaller size fraction, containing higher concentration of PAH, transition metal, and semiquinones, has a higher ROS capacity and consequently should be capable to induce severe toxicological effects. Thus, change in the composition of this PM are likely to modify its health impact. Road traffic is known to vastly contribute to PM exposure. Traffic intensity and quality should then be important determinants of the qualitative characteristics of PM spread in the atmosphere. In addition, although the interrelation between antioxidant levels in respiratory and cardiovascular systems, cellular and plasma levels is not yet well understood; it appears that the susceptibility of target organs to oxidative injury largely depends on cell ability to upregulate protective scavenging systems such as Nrf2. This transcription factor does regulate the expression of numerous cytoprotective genes that detoxify reactive species playing  an important role in the defense against atmospheric pollutant-induced toxicity.However, many questions remain unanswered, but in the future, rapid developments in molecular biology, proteomics, and genomics will help to completely clarify the biological  mechanisms involved in pulmonary and  cardiovascular injuries caused by air pollution.AcknowledgmentThis work is supported by a fund of University of Florence.References
   

J. Schwartz, “Air pollution and daily mortality: a review and meta analysis,” Environmental Research, vol. 64, no. 1, pp. 36–52, 1994. View at Publisher · View at Google Scholar · View at PubMed · View at ScopusD. W. Dockery, A. C. Pope III, X. Xu et al., “An association between air pollution and mortality in six U.S. cities,” New England Journal of Medicine, vol. 329, no. 94, pp. 1753–1759, 1993. View at Publisher · View at Google Scholar · View at PubMed · View at ScopusR. M. Harrison and J. Yin, “Particulate matter in the atmosphere: which particle properties are important for its effects on health?” Science of the Total Environment, vol. 249, no. 1–3, pp. 85–101, 2000. View at Publisher · View at Google Scholar · View at Scopus Environmental Protection Agency, Air Quality Criteria for Particulate Matter, vol. III of EPA/600/P-95/001CF, National Center for Environmental Assessment, Research Triangle Park, NC, USA, 1996. J. Ferin, G. Oberdörster, and D. P. Penney, “Pulmonary retention of ultrafine and fine particles in rats,” American Journal of Respiratory Cell and Molecular Biology, vol. 6, no. 5, pp. 535–542, 1992. View at ScopusJ. Ferin, “Pulmonary retention and clearance of particles,” Toxicology Letters, vol. 72, no. 1–3, pp. 121–125, 1994. View at Publisher · View at Google Scholar · View at ScopusL. Kliucininkas, D. Martuzevicius, E. Krugly et al., “Indoor and outdoor concentrations of fine particles, particle-bound PAHs and volatile organic compounds in Kaunas, Lithuania,” Journal of Environmental Monitoring, vol. 13, no. 1, pp. 182–191, 2011. View at Publisher · View at Google Scholar · View at PubMedM. Dennekamp, S. Howarth, C. A. J. Dick, J. W. Cherrie, K. Donaldson, and A. Seaton, “Ultrafine particles and nitrogen oxides generated by gas and electric cooking,” Occupational and Environmental Medicine, vol. 58, no. 8, pp. 511–516, 2001. View at Publisher · View at Google Scholar · View at ScopusJ. I. Levy, T. Dumyahn, and J. D. Spengler, “Particulate matter and polycyclic aromatic hydrocarbon concentrations in indoor and outdoor microenvironments in Boston, Massachusetts,” Journal of Exposure Analysis and Environmental Epidemiology, vol. 12, no. 2, pp. 104–114, 2002. View at Publisher · View at Google Scholar · View at ScopusU. Franck, O. Herbarth, B. Wehner, A. Wiedensohler, and M. Manjarrez, “How do the indoor size distributions of airborne submicron and ultrafine particles in the absence of significant indoor sources depend on outdoor distributions?” Indoor Air, vol. 13, no. 2, pp. 174–181, 2003. View at Publisher · View at Google Scholar · View at ScopusB. Brunekreef and S. T. Holgate, “Air pollution and health,” The Lancet, vol. 360, no. 9341, pp. 1233–1242, 2002. View at Publisher · View at Google Scholar · View at PubMed · View at ScopusA. Peters, D. W. Dockery, J. E. Muller, and M. A. Mittleman, “Increased particulate air pollution and the triggering of myocardial infarction,” Circulation, vol. 103, no. 23, pp. 2810–2815, 2001. View at ScopusY. J. Li, H. Takizawa, and T. Kawada, “Role of oxidative stresses induced by diesel exhaust particles in airway inflammation, allergy and asthma: their potential as a target of chemoprevention,” Inflammation and Allergy, vol. 9, no. 4, pp. 300–305, 2010. A. J. Ghio, C. Kim, and R. B. Devlin, “Concentrated ambient air particles induce mild pulmonary inflammation in healthy human volunteers,” American Journal of Respiratory and Critical Care Medicine, vol. 162, no. 3 I, pp. 981–988, 2001. View at ScopusK. Donaldson and V. Stone, “Current hypotheses on the mechanisms of toxicity of ultrafine particles,” Annali dell'Istituto Superiore di Sanita, vol. 39, no. 3, pp. 405–410, 2003. View at ScopusX. Y. Li, D. Brown, S. Smith, W. MacNee, and K. Donaldson, “Short-term inflammatory responses following intratracheal instillation of fine and ultrafine carbon black in rats,” Inhalation Toxicology, vol. 11, no. 8, pp. 709–731, 1999. View at ScopusY. Bai, A. K. Suzuki, and M. Sagai, “The cytotoxic effects of diesel exhaust particles on human pulmonary artery endothelial cells in vitro: role of active oxygen species,” Free Radical Biology and Medicine, vol. 30, no. 5, pp. 555–562, 2001. View at Publisher · View at Google Scholar · View at ScopusS. Hirano, A. Furuyama, E. Koike, and T. Kobayashi, “Oxidative-stress potency of organic extracts of diesel exhaust and urban fine particles in rat heart microvessel endothelial cells,” Toxicology, vol. 187, no. 2-3, pp. 161–170, 2003. View at Publisher · View at Google Scholar · View at ScopusL. E. Wold, B. Z. Simkhovich, M. T. Kleinman et al., “In vivo and in vitro models to test the hypothesis of particle-induced effects on cardiac function and arrhythmias,” Cardiovascular Toxicology, vol. 6, no. 1, pp. 69–78, 2006. View at Publisher · View at Google Scholar · View at ScopusH. Jaeschke, “Reactive oxygen and mechanisms of inflammatory liver injury: present concepts,” Journal of Gastroenterology and Hepatology, vol. 26, no. 1, pp. 173–179, 2011. View at Publisher · View at Google Scholar · View at PubMed · View at ScopusL. Risom, P. Møller, and S. Loft, “Oxidative stress-induced DNA damage by particulate air pollution,” Mutation Research, vol. 592, no. 1-2, pp. 119–137, 2005. View at Publisher · View at Google Scholar · View at PubMed · View at ScopusJ. Schnelle-Kreis, U. Küpper, M. Sklorz et al., “Daily measurement of organic compounds in ambient particulate matter in Augsburg, Germany: new aspects on aerosol sources and aerosol related health effects,” Biomarkers, vol. 14, no. 1, pp. 39–44, 2009. View at Publisher · View at Google Scholar · View at PubMed · View at ScopusP. MØller and S. Loft, “Oxidative damage to DNA and lipids as biomarkers of exposure to air pollution,” Environmental Health Perspectives, vol. 118, no. 8, pp. 1126–1136, 2010. View at Publisher · View at Google Scholar · View at PubMed · View at ScopusA. Valavanidis, K. Fiotakis, and T. Vlachogianni, “Airborne particulate matter and human health: toxicological assessment and importance of size and composition of particles for oxidative damage and carcinogenic mechanisms,” Journal of Environmental Science and Health C, vol. 26, no. 4, pp. 339–362, 2008. View at Publisher · View at Google Scholar · View at PubMed · View at ScopusH. A. Jeng, “Chemical composition of ambient particulate matter and redox activity,” American  Journal of  Physiology Lung Cell Molecular Physiology, vol. 293, pp. 170–181, 2007. H. Andersson, E. Piras, J. Demma, and B. Hellman, “Low levels of the air pollutant 1-nitropyrene induce DNA damage, increased levels of reactive oxygen species and endoplasmic reticulum stress in human endothelial cells,” Toxicology, vol. 262, no. 1, pp. 57–64, 2009. View at Publisher · View at Google Scholar · View at PubMed · View at ScopusJ. H. Park, A. B. Troxel, R. G. Harvey, and T. M. Penning, “Polycyclic aromatic hydrocarbon (PAH) o-quinones produced by the Aldo-Keto-Reductases (AKRs) generate abasic sites, oxidized pyrimidines, and 8-Oxo-dGuo via reactive oxygen species,” Chemical Research in Toxicology, vol. 19, no. 5, pp. 719–728, 2006. View at Publisher · View at Google Scholar · View at PubMed · View at ScopusA. J. Ghio, J. H. Richards, J. D. Carter, and M. C. Madden, “Accumulation of iron in the rat lung after tracheal instillation of diesel particles,” Toxicologic Pathology, vol. 28, no. 4, pp. 619–627, 2000. View at ScopusP. Gerde, B. A. Muggenburg, M. Lundborg, Y. Tesfaigzi, and A. R. Dahl, “Respiratory epithelial penetration and clearance of particle-borne benzo[a]pyrene,” Research Report, vol. 101, pp. 5–27, 2001. View at ScopusK. B. Kim and B. M. Lee, “Oxidative stress to DNA, protein, and antioxidant enzymes (superoxide dismutase and catalase) in rats treated with benzo(a)pyrene,” Cancer Letters, vol. 113, no. 1-2, pp. 205–212, 1997. View at Publisher · View at Google Scholar · View at ScopusN. Uzma, S. S. Kumar, and M. A. H. Hazari, “Exposure to benzene induces oxidative stress, alters the immune response and expression of p53 in gasoline filling workers,” American Journal of Industrial Medicine, vol. 53, no. 12, pp. 1264–1270, 2010. View at Publisher · View at Google Scholar · View at PubMed · View at ScopusM. Sørensen, H. Skov, H. Autrup, O. Hertel, and S. Loft, “Urban benzene exposure and oxidative DNA damage,” Science of the Total Environment, vol. 309, no. 1–3, pp. 69–80, 2003. View at Publisher · View at Google Scholar · View at PubMed · View at ScopusH. H. Liu, Y. C. Wu, and H. L. Chen, “Production of ozone and reactive oxygen species after welding,” Archives of Environmental Contamination and Toxicology, vol. 53, no. 4, pp. 513–518, 2007. View at Publisher · View at Google Scholar · View at PubMed · View at ScopusA. Baulig, M. Garlatti, V. Bonvallot et al., “Involvement of reactive oxygen species in the metabolic pathways triggered by diesel exhaust particles in human airway epithelial cells,” American Journal of Physiology, vol. 285, no. 3, pp. L671–L679, 2003. View at ScopusN. Li, C. Sioutas, A. Cho et al., “Ultrafine particulate pollutants induce oxidative stress and mitochondrial damage,” Environmental Health Perspectives, vol. 111, no. 4, pp. 455–460, 2003. View at ScopusN. Amara, R. Bachoual, M. Desmard et al., “Diesel exhaust particles induce matrix metalloprotease-1 in human lung epithelial cells via a NADP(H) oxidase/NOX4 redox-dependent mechanism,” American Journal of Physiology, vol. 293, no. 1, pp. L170–L181, 2007. View at Publisher · View at Google Scholar · View at PubMed · View at ScopusK. W. Kang, S. J. Lee, and S. G. Kim, “Molecular mechanism of Nrf2 activation by oxidative stress,” Antioxidants and Redox Signaling, vol. 7, no. 11-12, pp. 1664–1673, 2005. View at Publisher · View at Google Scholar · View at PubMed · View at ScopusJ. D. Hayes and M. McMahon, “NRF2 and KEAP1 mutations: permanent activation of an adaptive response in cancer,” Trends in Biochemical Sciences, vol. 34, no. 4, pp. 176–188, 2009. View at Publisher · View at Google Scholar · View at PubMed · View at ScopusA. H. Sprague and R. A. Khalil, “Inflammatory cytokines in vascular dysfunction and vascular disease,” Biochemical Pharmacology, vol. 78, no. 6, pp. 539–552, 2009. View at Publisher · View at Google Scholar · View at PubMed · View at ScopusK. Katsouyanni, “Ambient air pollution and health,” British Medical Bulletin, vol. 68, pp. 143–156, 2003. View at Publisher · View at Google Scholar · View at ScopusB. G. Nichols, J. S. Woods, D. L. Luchtel, J. Corral, and J. Q. Koenig, “Effects of ozone exposure on nuclear factor-κB activation and tumor necrosis factro-α expression in human nasal epithelial cells,” Toxicological Sciences, vol. 60, no. 2, pp. 356–362, 2001. View at Publisher · View at Google Scholar · View at ScopusD. Bassett, C. Elbon-Copp, S. Otterbein, H. Barraclough-Mitchell, M. DeLorme, and H. Yang, “Inflammatory cell availability affects ozone-induced lung damage,” Journal of Toxicology and Environmental Health A, vol. 64, no. 7, pp. 547–565, 2001. View at Publisher · View at Google Scholar · View at PubMed · View at Scopus WHO, “Air quality guidelines: for Europe,” World Health Organization Regional Publications, no. 91, pp. 1–287, 2001. View at ScopusW. Yang and S. T. Omaye, “Air pollutants, oxidative stress and human health,” Mutation Research, vol. 674, no. 1-2, pp. 45–54, 2009. View at Publisher · View at Google Scholar · View at PubMed · View at ScopusB. Kosmider, J. E. Loader, R. C. Murphy, and R. J. Mason, “Apoptosis induced by ozone and oxysterols in human alveolar epithelial cells,” Free Radical Biology and Medicine, vol. 48, no. 11, pp. 1513–1524, 2010. View at Publisher · View at Google Scholar · View at PubMed · View at ScopusH. Bayram, R. J. Sapsford, M. M. Abdelaziz, and O. A. Khair, “Effect of ozone and nitrogen dioxide on the release of proinflammatory mediators from bronchial epithelial cells of nonatopic nonasthmatic subjects and atopic asthmatic patients in vitro,” Journal of Allergy and Clinical Immunology, vol. 107, no. 2, pp. 287–294, 2001. View at Publisher · View at Google Scholar · View at PubMed · View at ScopusM. L. Bell, R. D. Peng, F. Dominici, and J. M. Samet, “Emergency hospital admissions for cardiovascular diseases and ambient levels of carbon monoxide results for 126 united states urban counties,” Circulation, vol. 120, no. 11, pp. 949–955, 2009. View at Publisher · View at Google Scholar · View at PubMed · View at ScopusG. Barreto, D. Madureira, F. Capani, L. Aon-Bertolino, E. Saraceno, and L. D. Alvarez-Giraldez, “The role of catechols and free radicals in benzene toxicity: an oxidative DNA damage pathway,” Environmental and Molecular Mutagenesis, vol. 50, no. 9, pp. 771–780, 2009. View at Publisher · View at Google Scholar · View at PubMed · View at ScopusJ. L. Bolton, M. A. Trush, T. M. Penning, G. Dryhurst, and T. J. Monks, “Role of quinones in toxicology,” Chemical Research in Toxicology, vol. 13, no. 3, pp. 135–160, 2000. View at Publisher · View at Google Scholar · View at ScopusU. Pöschl, “Atmospheric aerosols: composition, transformation, climate and health effects,” Angewandte Chemie, vol. 44, no. 46, pp. 7520–7540, 2005. View at Publisher · View at Google Scholar · View at PubMed · View at ScopusE. Boldo, C. Linares, J. Lumbreras et al., “Health impact assessment of a reduction in ambient PM(2.5) levels in Spain,” Environment International, vol. 37, no. 2, pp. 342–348, 2011. View at Publisher · View at Google Scholar · View at PubMed · View at ScopusG. L. Squadrito, R. Cueto, B. Dellinger, and W. A. Pryor, “Quinoid redox cycling as a mechanism for sustained free radical generation by inhaled airborne particulate matter,” Free Radical Biology and Medicine, vol. 31, no. 9, pp. 1132–1138, 2001. View at Publisher · View at Google Scholar · View at ScopusB. J. Finlayson-Pitts Jr. and J. N. Pitts, “Tropospheric air pollution: ozone, airborne toxics, polycyclic aromatic hydrocarbons, and particles,” Science, vol. 276, no. 5315, pp. 1045–1052, 1997. View at Publisher · View at Google Scholar · View at ScopusV. Bonvallot, A. Baeza-Squiban, A. Baulig et al., “Organic compounds from diesel exhaust particles elicit a proinflammatory response in human airway epithelial cells and induce cytochrome p450 1A1 expression,” American Journal of Respiratory Cell and Molecular Biology, vol. 25, no. 4, pp. 515–521, 2001. View at ScopusA. Valavanidis, K. Fiotakis, E. Bakeas, and T. Vlahogianni, “Electron paramagnetic resonance study of the generation of reactive oxygen species catalysed by transition metals and quinoid redox cycling by inhalable ambient particulate matter,” Redox Report, vol. 10, no. 1, pp. 37–51, 2005. View at Publisher · View at Google Scholar · View at PubMed · View at ScopusJ. Y. C. Ma and J. K. H. Ma, “The dual effect of the particulate and organic components of diesel exhaust particles on the alteration of pulmonary immune/inflammatory responses and metabolic enzymes,” Journal of Environmental Science and Health C, vol. 20, no. 2, pp. 117–147, 2002. View at Publisher · View at Google Scholar · View at PubMed · View at ScopusA. Shukla, C. Timblin, K. BeruBe et al., “Inhaled particulate matter causes expression of nuclear factor (NF)-κB-related genes and oxidant-dependent NF-κB activation in vitro,” American Journal of Respiratory Cell and Molecular Biology, vol. 23, no. 2, pp. 182–187, 2000. View at ScopusR. Li, Z. Ning, R. Majumdar et al., “Ultrafine particles from diesel vehicle emissions at different driving cycles induce differential vascular pro-inflammatory responses: implication of chemical components and NF-κB signaling,” Particle and Fibre Toxicology, vol. 7, no. 1, pp. 6–18, 2010. View at Publisher · View at Google Scholar · View at PubMed · View at ScopusR. Li, Z. Ning, J. Cui et al., “Ultrafine particles from diesel engines induce vascular oxidative stress via JNK activation,” Free Radical Biology and Medicine, vol. 15, no. 46, pp. 775–782, 2009. View at Publisher · View at Google Scholar · View at PubMed · View at ScopusK. S. Kouassi, S. Billet, G. Garçon et al., “Oxidative damage induced in A549 cells by physically and chemically characterized air particulate matter (PM2.5) collected in Abidjan, Côte d'Ivoire,” Journal of Applied Toxicology, vol. 30, no. 4, pp. 310–320, 2010. View at Publisher · View at Google Scholar · View at PubMed · View at ScopusA. Saxon and D. Diaz-Sanchez, “Air pollution and allergy: you are what you breathe,” Nature Immunology, vol. 6, no. 3, pp. 223–226, 2005. View at Publisher · View at Google Scholar · View at PubMed · View at ScopusE. Vidrio, H. Jung, and C. Anastasio, “Generation of hydroxyl radicals from dissolved transition metals in surrogate lung fluid solutions,” Atmospheric Environment, vol. 42, no. 18, pp. 4369–4379, 2008. View at Publisher · View at Google Scholar · View at PubMed · View at ScopusP. J. Schaumann, J. Borm, A. Herbrich et al., “Metal-rich ambient particles (particulate matter2.5) cause airway inflammation in healthy subjects,” American Journal of Respiratory and Critical Care Medicine, vol. 170, no. 8, pp. 898–903, 2004. View at Publisher · View at Google Scholar · View at PubMed · View at ScopusM. E. Gerlofs-Nijland, J. A. M. A. Dormans, H. J. T. Bloemen et al., “Toxicity of coarse and fine particulate matter from sites with contrasting traffic profiles,” Inhalation Toxicology, vol. 19, no. 13, pp. 1055–1069, 2007. View at Publisher · View at Google Scholar · View at PubMed · View at ScopusA. M. Knaapen, T. Shi, P. J. A. Borm, and R. P. F. Schins, “Soluble metals as well as the insoluble particle fraction are involved in cellular DNA damage induced by particulate matter,” Molecular and Cellular Biochemistry, vol. 234-235, pp. 317–326, 2002. View at Publisher · View at Google Scholar · View at ScopusA. Peters, H. E. Wichmann, T. Tuch, J. Heinrich, and J. Heyder, “Respiratory effects are associated with the number of ultrafine particles,” American Journal of Respiratory and Critical Care Medicine, vol. 155, no. 4, pp. 1376–1383, 1997. View at ScopusC. A. Pope, J. B. Muhlestein, H. T. May, D. G. Renlund, J. L. Anderson, and B. D. Horne, “Ischemic heart disease events triggered by short-term exposure to fine particulate air pollution,” Circulation, vol. 114, no. 23, pp. 2443–2448, 2006. View at Publisher · View at Google Scholar · View at PubMed · View at ScopusR. J. Delfino, C. Sioutas, and S. Malik, “Potential role of ultrafine particles in associations between airborne particle mass and cardiovascular health,” Environmental Health Perspectives, vol. 113, no. 8, pp. 934–946, 2005. View at Publisher · View at Google Scholar · View at ScopusR. D. Brook, J. R. Brook, B. Urch, R. Vincent, S. Rajagopalan, and F. Silverman, “Inhalation of fine particulate air pollution and ozone causes acute arterial vasoconstriction in healthy adults,” Circulation, vol. 105, no. 13, pp. 1534–1536, 2002. View at Publisher · View at Google Scholar · View at ScopusB. Urch, F. Silverman, P. Corey et al., “Acute blood pressure responses in healthy adults during controlled air pollution exposures,” Environmental Health Perspectives, vol. 113, no. 8, pp. 1052–1055, 2005. View at Publisher · View at Google Scholar · View at ScopusH. Hwang, R. A. Kloner, M. T. Kleinman, and B. Z. Simkhovich, “Direct and acute cardiotoxic effects of ultrafine air pollutants in spontaneously hypertensive rats and Wistar-Kyoto rats,” Journal of Cardiovascular Pharmacology and Therapeutics, vol. 13, no. 3, pp. 189–198, 2008. View at Publisher · View at Google Scholar · View at PubMed · View at ScopusB. Z. Simkhovich, P. Marjoram, M. T. Kleinman, and R. A. Kloner, “Direct and acute cardiotoxicity of ultrafine particles in young adult and old rat hearts,” Basic Research in Cardiology, vol. 102, no. 6, pp. 467–475, 2006. View at Publisher · View at Google Scholar · View at PubMed · View at ScopusQ. Sun, A. Wang, X. Jin et al., “Long-term air pollution exposure and acceleration of atherosclerosis and vascular inflammation in an animal model,” Journal of the American Medical Association, vol. 294, no. 23, pp. 3003–3010, 2005. View at Publisher · View at Google Scholar · View at PubMed · View at ScopusT. Suwa, J. C. Hogg, K. B. Quinlan, A. Ohgami, R. Vincent, and S. F. Van Eeden, “Particulate air pollution induces progression of atherosclerosis,” Journal of the American College of Cardiology, vol. 39, no. 6, pp. 935–942, 2002. View at Publisher · View at Google Scholar · View at ScopusG. C. Chuang, Z. Yang, D. G. Westbrook et al., “Pulmonary ozone exposure induces vascular dysfunction, mitochondrial damage, and atherogenesis,” American Journal of Physiology, vol. 297, no. 2, pp. L209–L216, 2009. View at Publisher · View at Google Scholar · View at PubMed · View at ScopusM. J. Campen, A. K. Lund, T. L. Knuckles et al., “Inhaled diesel emissions alter atherosclerotic plaque composition in ApoE(-/-) mice,” Toxicology and Applied Pharmacology, vol. 242, no. 3, pp. 310–317, 2010. View at Publisher · View at Google Scholar · View at PubMed · View at ScopusT. W. Cherng, M. L. Paffett, O. Jackson-Weaver, M. J. Campen, B. R. Walker, and N. L. Kanagy, “Mechanisms of diesel-induced endothelial nitric oxide synthase dysfunction in coronary arterioles,” Environmental Health Perspectives, vol. 119, no. 1, pp. 98–103, 2011. View at Publisher · View at Google Scholar · View at PubMedA. Baccarelli, A. Zanobetti, I. Martinelli et al., “Effects of exposure to air pollution on blood coagulation,” Journal of Thrombosis and Haemostasis, vol. 5, no. 2, pp. 252–260, 2007. View at Publisher · View at Google Scholar · View at PubMed · View at ScopusE. S. Baja, J. D. Schwartz, G. A. Wellenius et al., “Traffic-related air pollution and QT interval: modification by diabetes, obesity, and oxidative stress gene polymorphisms in the normative aging study,” Environmental Health Perspectives, vol. 118, no. 6, pp. 840–846, 2010. View at Publisher · View at Google Scholar · View at PubMed · View at ScopusI. Mordukhovich, E. Wilker, H. Suh et al., “Black carbon exposure, oxidative stress genes, and blood pressure in a repeated-measures study,” Environmental Health Perspectives, vol. 117, no. 11, pp. 1767–1772, 2009. View at Publisher · View at Google Scholar · View at PubMed · View at ScopusL. Liu, T. Ruddy, M. Dalipaj et al., “Effects of indoor, outdoor, and personal exposure to particulate air pollution on cardiovascular physiology and systemic mediators in seniors,” Journal of Occupational and Environmental Medicine, vol. 51, no. 9, pp. 1088–1098, 2009. View at Publisher · View at Google Scholar · View at PubMed · View at ScopusI. M. Kooter, M. E. Gerlofs-Nijland, A. J. Boere, et al., “Diesel engine exhaust initiates a sequence of pulmonary and cardiovascular effects in rats,” Environmental Health Perspectives, vol. 118, no. 8, pp. 1126–1136, 2010. L. J. den Hartigh, M. W. Lamé, W. Ham, M. J. Kleeman, F. Tablin, and D. W. Wilson, “Endotoxin and polycyclic aromatic hydrocarbons in ambient fine particulate matter from Fresno, California initiate human monocyte inflammatory responses mediated by reactive oxygen species,” Toxicology in Vitro, vol. 24, no. 7, pp. 1993–2002, 2010. View at Publisher · View at Google Scholar · View at PubMed · View at ScopusI. Ferecatu, M. C. Borot, C. Bossard et al., “Polycyclic aromatic hydrocarbon components contribute to the mitochondria-antiapoptotic effect of fine particulate matter on human bronchial epithelial cells via the aryl hydrocarbon receptor,” Particle and Fibre Toxicology, vol. 7, no. 1, pp. 18–32, 2010. View at Publisher · View at Google Scholar · View at PubMed · View at ScopusA. Baulig, M. Garlatti, V. Bonvallot et al., “Involvement of reactive oxygen species in the metabolic pathways triggered by diesel exhaust particles in human airway epithelial cells,” American Journal of Physiology, vol. 285, no. 3, pp. L671–L679, 2003. View at ScopusA. Churg, C. Xie, X. Wang, R. Vincent, and R. D. Wang, “Air pollution particles activate NF-κB on contact with airway epithelial cell surfaces,” Toxicology and Applied Pharmacology, vol. 208, no. 1, pp. 37–45, 2005. View at Publisher · View at Google Scholar · View at PubMed · View at ScopusJ. Topinka, L. R. Schwarz, F. Kiefer et al., “DNA adduct formation in mammalian cell cultures by polycyclic aromatic hydrocarbons (PAH) and nitro-PAH in coke oven emission extract,” Mutation Research, vol. 419, no. 1–3, pp. 91–105, 1998. View at Publisher · View at Google Scholar · View at ScopusL. A. Jimenez, J. Thompson, D. A. Brown et al., “Activation of NF-κB by PM10 occurs via an iron-mediated mechanism in the absence of IκB degradation,” Toxicology and Applied Pharmacology, vol. 15, no. 166, pp. 101–110, 2000. View at Publisher · View at Google Scholar · View at PubMed · View at ScopusS. Becker, L. A. Dailey, J. M. Soukup, S. C. Grambow, R. B. Devlin, and Y. C. T. Huang, “Seasonal variations in air pollution particle-induced inflammatory mediator release and oxidative stress,” Environmental Health Perspectives, vol. 113, no. 8, pp. 1032–1038, 2005. View at Publisher · View at Google Scholar · View at ScopusS. Becker, S. Mundandhara, R. B. Devlin, and M. Madden, “Regulation of cytokine production in human alveolar macrophages and airway epithelial cells in response to ambient air pollution particles: further mechanistic studies,” Toxicology and Applied Pharmacology, vol. 207, no. 2, supplement, pp. S269–S275, 2005. View at Publisher · View at Google Scholar · View at PubMed · View at ScopusS. S. Salvi, C. Nordenhall, A. Blomberg et al., “Acute exposure to diesel exhaust increases IL-8 and GRO-α production in healthy human airways,” American Journal of Respiratory and Critical Care Medicine, vol. 161, no. 2 I, pp. 550–557, 2000. View at ScopusE. D. Karoly, Z. Li, X. Hyseni, and Y. C. T. Huang, “Up-regulation of tissue factor in human pulmonary artery endothelial cells after ultrafine particle exposure,” Environmental Health Perspectives, vol. 115, no. 4, pp. 535–540, 2007. View at Publisher · View at Google Scholar · View at PubMed · View at ScopusH. Ishii, S. Hayashi, J. C. Hogg et al., “Alveolar macrophage-epithelial cell interaction following exposure to atmospheric particles induces the release of mediators involved in monocyte mobilization and recruitment,” Respiratory Research, vol. 6, pp. 87–99, 2005. View at Publisher · View at Google Scholar · View at PubMed · View at ScopusG. Oberdörster, “Significance of particle parameters in the evaluation of exposure-dose-response relationships of inhaled particles,” Inhalation Toxicology, vol. 8, pp. 73–89, 1996. View at ScopusM. Sørensen, R. P. F. Schins, O. Hertel, and S. Loft, “Transition metals in personal samples of PM2.5 and oxidative stress in human volunteers,” Cancer Epidemiology Biomarkers and Prevention, vol. 14, no. 5, pp. 1340–1343, 2005. View at Publisher · View at Google Scholar · View at PubMed · View at ScopusS. Bae, X. C. Pan, S. Y. Kim et al., “Exposures to particulate matter and polycyclic aromatic hydrocarbons and oxidative stress in schoolchildren,” Environmental Health Perspectives, vol. 118, no. 4, pp. 579–583, 2010. View at Publisher · View at Google Scholar · View at PubMed · View at ScopusH. Song, W. Tan, and X. Zhang, “Ozone induces inflammation in bronchial epithelial cells,” Journal of Asthma, vol. 48, no. 1, pp. 79–83, 2011. View at Publisher · View at Google Scholar · View at PubMedI. S. Mudway and F. J. Kelly, “Ozone and the lung: a sensitive issue,” Molecular Aspects of Medicine, vol. 21, no. 1–2, pp. 1–48, 2000. View at Publisher · View at Google Scholar · View at ScopusB. Kosmider, J. E. Loader, R. C. Murphy, and R. J. Mason, “Apoptosis induced by ozone and oxysterols in human alveolar epithelial cells,” Free Radical Biology and Medicine, vol. 48, no. 11, pp. 1513–1524, 2010. View at Publisher · View at Google Scholar · View at PubMed · View at ScopusK. Triantaphyllopoulos, F. Hussain, M. Pinart et al., “A model of chronic inflammation and pulmonary emphysema after multiple ozone exposures in mice,” American Journal of Physiology, vol. 300, no. 5, pp. L691–L700, 2011. View at Publisher · View at Google Scholar · View at PubMedY. I. Chirino, Y. Sánchez-Pérez, Á. R. Osornio-Vargas et al., “PM10 impairs the antioxidant defense system and exacerbates oxidative stress driven cell death,” Toxicology Letters, vol. 193, no. 3, pp. 209–216, 2010. View at Publisher · View at Google Scholar · View at PubMed · View at ScopusY. Bagryantseva, B. Novotna, P. Rossner et al., “Oxidative damage to biological macromolecules in Prague bus drivers and garagemen: impact of air pollution and genetic polymorphisms,” Toxicology Letters, vol. 199, no. 1, pp. 60–68, 2010. View at Publisher · View at Google Scholar · View at PubMed · View at ScopusR. J. Delfino, N. Staimer, T. Tjoa et al., “Associations of primary and secondary organic aerosols with airway and systemic inflammation in an elderly panel cohort,” Epidemiology, vol. 21, no. 6, pp. 892–902, 2010. View at Publisher · View at Google Scholar · View at PubMed · View at ScopusF. J. Kelly and T. D. Tetley, “Nitrogen dioxide depletes uric acid and ascorbic acid but not glutathione from lung lining fluid,” Biochemical Journal, vol. 325, no. 1, pp. 95–99, 1997. View at ScopusA. F. Behndig, I. S. Mudway, J. L. Brown et al., “Airway antioxidant and inflammatory responses to diesel exhaust exposure in healthy humans,” European Respiratory Journal, vol. 27, no. 2, pp. 359–365, 2006. View at Publisher · View at Google Scholar · View at PubMed · View at ScopusW. O. Osburn and T. W. Kensler, “Nrf2 signaling: an adaptive response pathway for protection against environmental toxic insults,” Mutation Research, vol. 659, no. 1-2, pp. 31–39, 2008. View at Publisher · View at Google Scholar · View at PubMed · View at ScopusV. Rubio, J. Zhang, M. Valverde, E. Rojas, and Z. Z. Shi, “Essential role of Nrf2 in protection against hydroquinone- and benzoquinone-induced cytotoxicity,” Toxicology in Vitro, vol. 25, no. 2, pp. 521–529, 2010. View at Publisher · View at Google Scholar · View at PubMed · View at ScopusV. Rubio, M. Valverde, and E. Rojas, “Effects of atmospheric pollutants on the Nrf2 survival pathway,” Environmental Science and Pollution Research, vol. 17, no. 2, pp. 369–382, 2010. View at Publisher · View at Google Scholar · View at PubMed · View at Scopus EPA, “Integrated science assessment for particulate matter,” Provisional Draft (Personal communication), 2008.


Prime Minister's Meeting on Targets for Infrastructure - FY 13-14

$
0
0
Prime Minister's Meeting on Targets for Infrastructure - FY 13-14


            A meeting was held by the Prime Minister today to finalise infrastructure targets for 2013-14. The meeting was attended by the Finance Minister, Deputy Chairman, Planning Commission and Ministers and Secretaries of key infrastructure Ministries, i.e., Power, Coal, Railways, Roads, Shipping and Civil Aviation.

            The Deputy Chairman, Planning Commission made a presentation bringing out the performance of the six infrastructure ministries in achieving their targets in 2012-13  and the details of the targets that have been set for this year, i.e., 2013-14. These targets were set through a detailed process, first in the Planning Commission by Member (Infrastructure) and later revised through a second round of meetings in PMO.

            The sectoral highlights of the Prime Minister's review and the targets for 2013-14 are:

(i)                 Civil Aviation

a)      Two new international airports at Bhubaneswar and Imphal
b)      50 new low cost small airportswill be taken up by Airports Authority of India (see Box)
c)      8 Greenfield Airportsare to be awarded this year in PPP mode: Navi Mumbai, Juhu (Mumbai), Goa, Kannur, Pune (Rajguru Nagar Chakan), Sriperumbudur, Bellary and Raigarh
d)      Airport operations and maintenance through PPP contracts will be introduced in AAI airports. Airports being considered are Chennai, Kolkata, Lucknow, Guwahati, Jaipur and Ahmedabad

(ii)               Ports

a)      The two new PPP ports at Sagar (West Bengal) and Durgarajapatnam (Andhra Pradesh) approved by Cabinet will be awarded.

New Low Cost Airports by AAI

Andhra Pradesh:
Vijayawada, Nellore, Kurnool, Kadapa, Nizamabad, Tirupati, Anantapur & Karimnagar
Jharkhand:
Dhanbad, Bokaro & Hazaribagh
Bihar:
Muzaffarpur, Chapra & Sasaram
Punjab:
Ludhiana, Jalandhar & Firozpur
Uttar Pradesh:
Agra, Allahabad, Moradabad, Saharanpur, Meerut, Aligarh, Muzaffarnagar, Bijnor & Azamgarh
Arunachal Pradesh:     
Tezu, Momdila & Along
Assam:
Silchar, Jorhat & Tezpur
Madhya Pradesh:
Gwalior, Singrauli, Burhanpur, Khandwa, Jabalpur, Sidhi & Shahdol
Odisha:
Brahmpur, Raurkela & Kendujhar
Rajasthan:
Ajmer, Kota, Bhilwada & Alwar
Maharashtra:
Kolhapur, Nasik, Jalgaon, Solapur & Amarawati


(i)                 Railways

a)      An Inter-Ministerial Group of Railways, Finance and Planning will be formed with the task of coming up with a creative financing-cum-implementation mechanism in two months for clearing the large backlog of sanctioned projects of over Rs 200,000 crores in a prioritized and time-bound manner.
b)      The proposal for creating a Rail Tariff Authority will be accelerated and brought to Cabinet soon.
c)      The flagship projectsof railways such as the two Loco Manufacturing Projects, Elevated Rail Corridor, the Dedicated Freight Corridor and station redevelopment will be closely monitored for award in the next six months.

(ii)               Roads

a)      The slowdown in the award of road projects should get reversed in view of the large number of relaxations that have already been provided to PPP road projects.
b)      Expressways will get focused attentionand the Planning Commission will work with the Ministry of Road Transport & Highways to suggest an implementation mechanism for expressways.

(iii)             Power

a)      The Ministry will work with Planning Commission and Finance Ministry to resolve remaining issues in the power sector and improve generation and transmission capacity.
b)      Ministry of Power is working on a separate provision to operationalise open access.

(iv)             Coal

a)      New policies for ramping up coal production will be put in place.

            In addition to the targets, the Prime Minister highlighted the need to ramp up investment in infrastructure to revive investor sentiment. For this purpose, a target of rolling out PPP projects of at least Rs 1 lakh crores in the next six months was set. A steering group is being formed to monitor the award and implementation of projects from among the following on priority:

1)      Mumbai Elevated Rail Corridor                       Rs. 30,000 crore
2)      Two Locomotive projects                                Rs.   5,000 crore
3)      Accelerating E-DFC                                         Rs. 10,000 crore
4)      One of the two port projects                           Rs. 10,000 crore
5)      Two airport projects                                         Rs. 20,000 crore
6)      Power & Transmission projects                       Rs. 40,000 crore
                                    Total                                                   Rs. 1,15,000 crore

            The Prime Minister concluded by reiterating that a lot of work still needs to be done and there should be no slackening of the pace of work.

Fertiliser Corporation of India is Out of BIFR Fertiliser Minister Says the Move will help Revival of Talcher Unit

$
0
0
Fertiliser Corporation of India is Out of BIFR
Fertiliser Minister Says the Move will help Revival of Talcher Unit

Shri Srikant Kumar Jena, Minister of State (I/C) for Chemicals & Fertilizersand Statistics & Programme Implementation has stated that the long standing demand of the people of Odisha for revival of closed Talcher unit of Fertilizer Corporation of India Limited (FCIL) shall be fulfilled, as BIFR has given an order for de-registration of the FCIL from BIFR and the company is out of BIFR now.He said, it is a day of pride for the people of the country, especially Odisha as after sustained efforts, the clearance of FCIL from BIFR has been given, which shall help in revival of Talcher Unit in Odisha on fast track basis.Shri Jena had been actively pursuing the revival process, which has resulted in today’s decision of BIFR and has paved the way for revival of Talcher unit in Odisha, Ramagundam unit in Andhra Pradesh and Sindri unit in Jharkhand.

He said that the Talcher unit in Odisha shall be revived by Coal India Ltd (CIL) and Rashtriya Chemicals & Fertilizers Ltd (RCF) along with GAIL (I) Ltd. RCF has already released their Global Invitation calling for bids for setting up of coal gasification and gas purification plant at Talcher and the LSTK bids for Ammonia & Urea Plants shall also be invited soon. The capacity of urea plant shall be around 13 Lakh tonnes per annum which shall help in catering to the supply of urea to eastern sector of the country.He said that the revival of Talcher unit shall bring an investment of about Rs 8,000 crore to Odisha, generate direct and indirect employment in the State, would help in developing ancillary industry in the region and give a boost to the economy of the State.

****


DNM/NV
(Release ID :96874)

Carbonate overview:

Heat Exchanger

$
0
0

Heat Exchanger

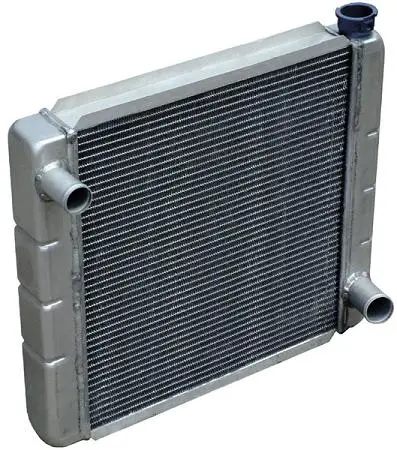
automobile radiator picture

Automobile Radiator

The heat exchanger is a very important device used in many real world applications in which heat must be transferred from one medium to another. In many cases, the two mediums are separated by a solid wall, although in some cases the two mediums are in direct contact with each other, so that mixing occurs. For example, steam injected into water in order to heat it up.


Some common applications where a heat exchanger is used are: refrigeration, air conditioning, space heating, and power plants, to name a few. There are of course many more.

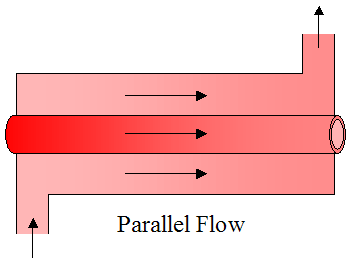
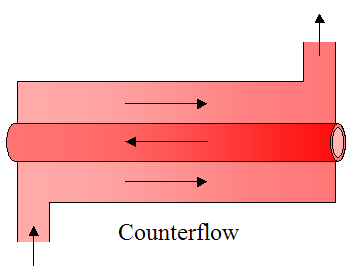
There is a large variety of heat exchanger configurations, but most can be categorized into one of three types. The three types are: Parallel-flow or counterflow configuration, cross-flow configuration, and shell-and-tube configuration.

Parallel flow and counterflow configurations are shown in the two figures below. Both figures show a simple concentric tube arrangement in which one of the fluids flows on the inner tube and the other fluid flows in the annular gap (between the tubes). The figures show the hot fluid as being inside the inner tube, and the cold fluid as being inside the annular gap. In the parallel flow configuration both the hot and cold fluids flow in the same direction. In the counterflow configuration the fluids flow in opposite directions. These will be discussed in more detail later.

parallel flow heat exchanger

counterflow heat exchanger

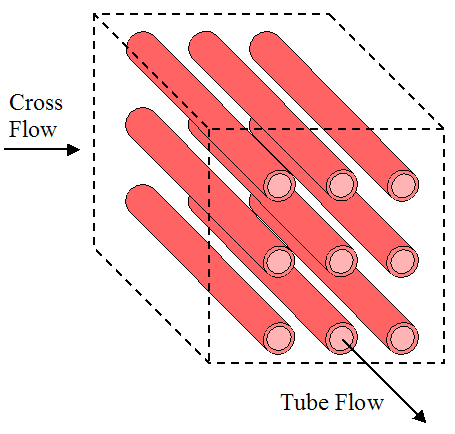
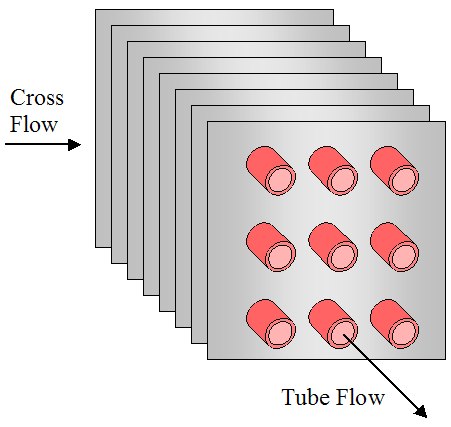
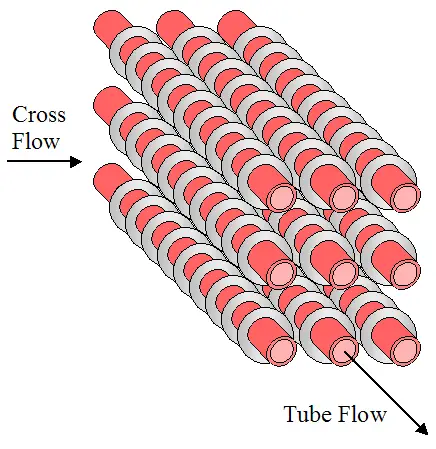
Heat transfer is usually better when a flow moves across tubes than along their length. Hence, cross-flow is often the preferred flow direction, and tends to be better than parallel flow or counterflow configurations. Cross flow configurations are shown in the three figures below. The first figure shows cross flow over an unfinned array of tubes. The second and third figures show cross flow over a finned array of tubes, with square fins and circular fins (as shown). The purpose of fins is to increase heat transfer between the hot and cold mediums. This will be discussed in more detail later.

cross flow with no fins

cross flow with square fins

cross flow with circular fins

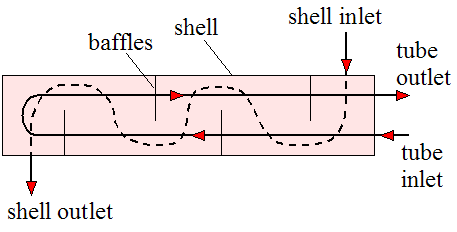
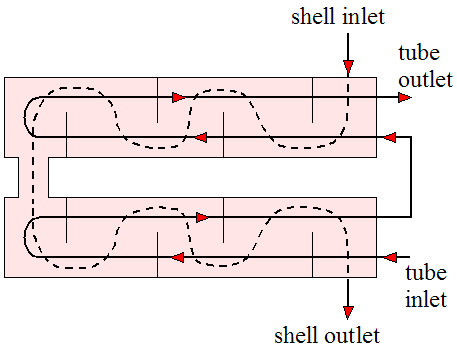
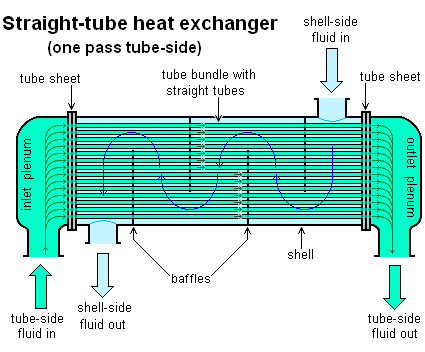
Shell-and-tube configurations are shown in the three figures below. One of the fluids flows through the inside of the shell and the other fluid flows through tubes passing through the inside of the shell, thereby enabling heat transfer between the two fluids. Baffles are added to enhance the convection coefficient, which increases heat transfer between the two fluids. The baffles serve to induce turbulent mixing and a cross-flow component, both of which increase the convection coefficient. The first figure shows one shell pass and two tube passes. The second figure shows two shell passes and four tube passes. The third figure shows a more detailed drawing of a shell-and-tube heat exchanger with one shell pass and one tube pass.

one shell pass and two tube passes

two shell passes and four tube passes

one shell pass and one tube pass


In the next section we will explain how fins are used to increase the heat transfer in a heat exchanger, thus boosting its effectiveness.

Increasing Heat Transfer In Heat Exchangers Using Fins

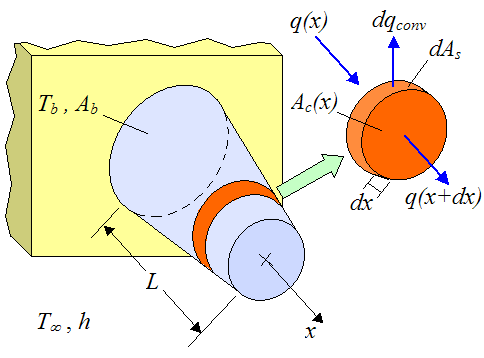
A fin can be thought of as an extension of a surface. It adds additional surface area, which enables additional heat flow to or from the medium the fin is in contact with, by way of convection. To illustrate in quantitative terms the usefulness of a fin consider the following schematic showing a pin fin protruding out of a base surface at surface temperature Tb. A differential element of width dx is shown in orange. It will be necessary to consider this element for the analysis that follows, which uses calculus.

one dimensional pin fin schematic

Where:

Ab is the area of the pin fin at its base

L is the length of the fin (in the x-direction)

T is the temperature of the ambient environment (assumed constant everywhere)

h is the convection coefficient between the fin and the ambient environment (assumed constant)

Ac(x) is the cross-sectional area of the fin at position x

dAs is the surface area around the perimeter of the differential element, at position x

dqconv is the heat flow rate from the surface area around the perimeter of the differential element, by convection, at position x

q(x) is the heat flow rate into the element at position x, by conduction

q(x+dx) is the heat flow rate out of the element at position x+dx, by conduction


Assume steady state heat flow where the energy that enters the differential element equals the energy that exits the differential element. This is a valid assumption for steady state operating conditions.

We can write the energy balance as

energy balance for the pin fin

The left side of the above equation is the heat energy entering the differential element. The right side of the above equation is the heat energy exiting the differential element.

By Newton’s law of cooling,

newtons law of cooling

where T(x) is the fin temperature at position x.

Substitute the above equation into equation (1). We get

energy balance for the pin fin 2

Rearrange the above equation to give

energy balance for the pin fin 3

Divide both sides of the above equation by dx. We get

energy balance for the pin fin 4

For dx→0 this becomes

energy balance for the pin fin 5

From Fourier’s law,

fouriers law

where k is the thermal conductivity of the fin material (assumed constant throughout the material).

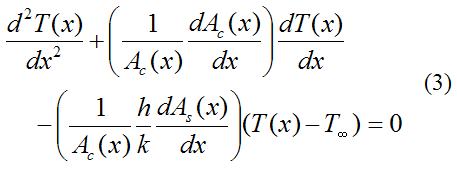
Substitute the above equation into equation (2), and simplify. This gives us the final general differential equation for one-dimensional steady state heat transfer from an extended surface (given below). Using this equation we can solve for the temperature distribution T(x) given some set of boundary conditions.

final differential equation for 1 d heat flow through pin fin

Note that although h and k are treated here as constant, this is not necessarily the case. But it is a reasonable simplification.

To get an idea of the degree to which a fin can increase heat transfer let's assume the pin fin discussed here is of constant cross-sectional area, where Ac(x) = Ac. Then, dAc(x)/dx = 0 in the above equation, and dAs(x)/dx = P, where P is the perimeter (with As(x) = Px). The above equation then becomes

final differential equation for 1 d heat flow through pin fin 2

Since the above is a second order differential equation, we need two boundary conditions in terms of x to solve it. We can set the first boundary condition as T(0) = Tb. For the second boundary condition we can assume negligible heat transfer at the tip, at x = L, so that q(L) = 0. This is a good assumption for a long fin, relative to its width, since the longer the fin is, the closer its tip temperature is to the ambient temperature T, which means that the temperature gradient T(x) at the tip approaches zero. By Fourier's law this means that the heat flow out of the tip approaches zero.

Thus, Fourier’s law at x = L gives

fouriers law boundary condition at fin tip with no heat flow

so that

fouriers law boundary condition at fin tip with no heat flow 2

We can now solve equation (4) for the temperature distribution T(x). With this temperature distribution known we can solve for the heat transfer rate qf at the base of the fin (at x = 0).

By Fourier’s law,

heat rate at base of pin fin using fouriers law

Hence, solving for T(x) and substituting into the above equation we get

heat rate at base of pin fin using fouriers law 2

where

tanh formula

and

m for tanh formula

Note that equation (5) represents the heat transfer from the base of the surface (with area Ab = Ac) to which the fin is attached (at x = 0). In the absence of the fin the heat transfer rate from the base is simply qb where

heat rate from base with no fin

To see how much the fin increases heat transfer calculate the following ratio:

heat rate ratio between fin and no fin

which becomes

heat rate ratio between fin and no fin 2

To illustrate by example, assume the pin fin is circular so that P = πd, where d is the pin fin diameter. Set d = 0.01 m, k = 180 W/m.K, h = 50 W/m2K, and L = 0.1 m.

We get

heat rate ratio between fin and no fin 3

Given this high ratio, it's clearly very useful to add fins to increase heat transfer from a surface. The alternative way to increase heat transfer is by increasing h and/or decreasing T which is not always practical. Hence, adding fins makes more sense. For example, radiators (as shown in the first picture on this page) have many fins since it is the only way to enable the high rate of thermal energy exchange with the air. Note that despite the name, radiators generally transfer the bulk of their heat (with some medium, such as air) via convection, not by thermal radiation, so a more accurate name for them would be "convectors". In fact, heat exchangers in general transfer the bulk of their heat via convection, and radiation heat transfer is usually negligible in comparison.

Note that the heat transfer rate qf increases for increasing k. This physically means that the temperature of the fin is closer to the base temperature Tb, along its length. In practical terms this means we want k as high as possible. Also, note that beyond a certain point, increases in L do not significantly increase the rate of heat transfer qf. This is because the farther you are along the fin, the closer the fin temperature T(x) is to T, which of course means a lower convective heat transfer rate from the fin to the environment (by Newton's law of cooling).

Fins are especially important for situations where the convecting medium is air or some gas (with lower h) and the surface area of the object that needs to lose (or gain) heat is (relatively) small. In this case fins will greatly aid in the transfer of heat to or from the object. If the convecting medium is a fluid, such as water, then h will generally be much higher and fins may not be necessary.

Also note that Tb can be either greater than or less than T. The mathematics of the solution does not change for either case. It just means that heat flows out of, or into the fin (respectively).

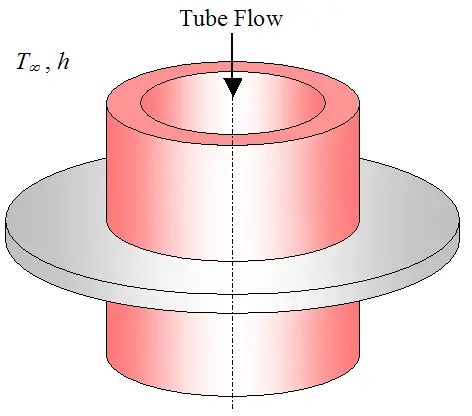
Fins can have a variety of shapes. For example, they can be pin fins protruding from a surface (as just described), or annular fins around a tube used to enhance heat flow into or out of the fluid flowing through the tube. The figure below illustrates such a fin.

finned tube figure

If fins are attached to a wall with a metallurgical or adhesive joint, a significant thermal contact resistance may exist at the interface. This can be accounted for by a fin correction factor, discussed in a later section on the overall heat transfer coefficient.

Next, we will analyze the parallel flow heat exchanger for steady state flow. Steady state flow is a valid assumption for steady operating conditions and temperatures.


Parallel Flow Heat Exchanger

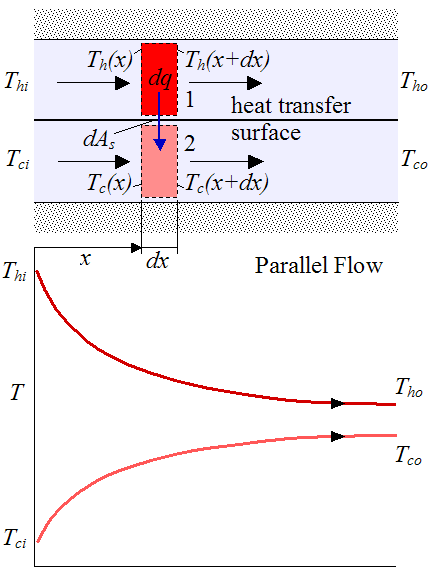
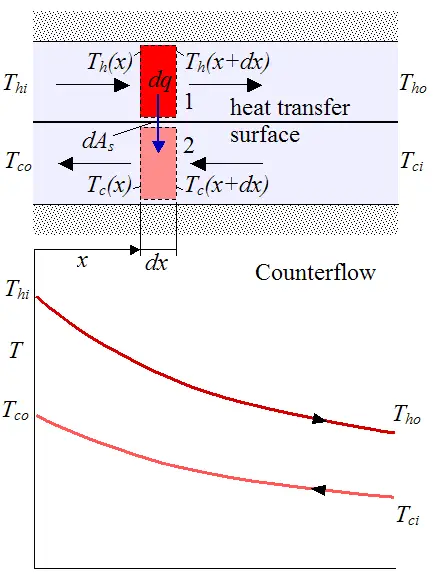
The figure below shows a schematic of a parallel-flow heat exchanger along with temperature distribution for the hot and cold fluids. We treat the heat exchanger as insulated around the outside so that the only heat transfer is between the two fluids.

As one would expect, the cold fluid (bottom curve) heats up and the hot fluid (top curve) cools down.

schematic for parallel flow heat exchanger

Where:

Thi is the temperature of the hot fluid at the inlet

Tci is the temperature of the cold fluid at the inlet

Tho is the temperature of the hot fluid at the outlet

Tco is the temperature of the cold fluid at the outlet

Th(x) is the temperature of the hot fluid at position x (left side of differential element 1. This differential element, of length dx and enclosed by dashed lines, is a control volume that is fixed in space)

Th(x+dx) is the temperature of the hot fluid at position x+dx (right side of differential element 1)

Tc(x) is the temperature of the cold fluid at position x (left side of differential element 2)

Tc(x+dx) is the temperature of the cold fluid at position x+dx (right side of differential element 2)

dAs is the differential area between differential elements 1 and 2. This differential area is located on the heat transfer surface (a wall) separating the hot and cold fluid streams.

dq is the heat flow rate between differential fluid elements 1 and 2


Assume steady state heat flow where the energy that enters the top differential element equals the energy that exits this element. We can write the energy balance as

energy balance for parallel flow heat exchanger

The left side of the above equation is the energy entering the differential element. The right side of the above equation is the energy exiting the differential element.

Rewrite the above equation so that it becomes

energy balance for parallel flow heat exchanger 2

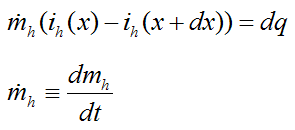
By the First law of thermodynamics the left side of the above equation can be expressed as

energy balance for parallel flow heat exchanger 3

Where:

dmh/dt is the mass flow rate of the top (hot) fluid

ih(x) is the fluid enthalpy entering the left side of the differential element, and ih(x+dx) is the fluid enthalpy leaving the right side of the differential element. In the above equation thermal conduction along the axial (x) direction can be assumed negligible, and potential and kinetic energy changes are also assumed negligible.

If we assume constant specific heat cph for the fluid in the top differential element, and express the change in enthalpy (ih(x)ih(x+dx)) as cph multiplied by the temperature difference across the differential element (Th(x)Th(x+dx)), the above expression then becomes

energy balance for parallel flow heat exchanger 4

Note that we are treating cph as constant, although it can vary as a result of temperature variations in the fluid. In this case it is reasonable to use an average value based on the average temperature of the hot fluid between the inlet and outlet.

Also note that Th(x) is the mean (average) temperature across the cross-section of the channel (at position x), for the top fluid. It is necessary to make this distinction because in real flows the temperature can vary across the cross-section.

Similarly, we can also apply an energy balance to the bottom differential element. Following the same procedure as before, we get

energy balance for parallel flow heat exchanger 5

Where:

dmc/dt is the mass flow rate of the bottom (cold) fluid

cpc is the specific heat of the fluid in the bottom differential element. We treat it as constant, although it can vary as a result of temperature variations in the fluid. In this case it is reasonable to use an average value based on the average temperature of the cold fluid between the inlet and outlet.

From Newton’s law of cooling

newtons law of cooling for parallel flow heat exchanger

where U is the overall heat transfer coefficient between the top and bottom fluid. Due to variations in fluid properties and flow conditions, U may vary over the flow length. However, in many applications such variations are not significant and one can reasonably assume a constant, and average value of U.

Combining equations (6)-(8) and using calculus to solve for q we get

final equation for parallel flow heat exchanger

Where:

ΔT1 = ThiTci

ΔT2 = ThoTco

As is the total area of the heat transfer surface. For example, if the length of the heat transfer surface is L (in the horizontal x direction) and its depth into the page is b then As = Lxb.

By direct observation, the above equation tells us that q is directly proportional to U and As. This makes sense since increasing U decreases the resistance to heat transfer thereby enabling a higher q. And increasing As increases the heat transfer surface area which also allows for a higher q.


It is worth noting that the total heat transfer rate q out of the top (hot) fluid must also equal the total heat transfer rate into the bottom (cold) fluid. Hence,

total heat transfer rate for parallel flow heat exchanger

The two equations above can be used in addition to equation (9) to solve a problem involving parallel flow heat exchangers. The above two equations also apply for a counterflow heat exchanger. Note that numerical iteration may be necessary in equation (9) for cases where unknown inlet and/or outlet temperature(s) need to be solved for. However, with computers this is easy to do.

By direct observation, the above two equations tell us that q is directly proportional to dm/dt and cp. This makes sense since increasing dm/dt increases the rate of transport of energy thereby enabling a higher q. And a greater cp means that the medium can "hold" more energy per unit mass and per unit of temperature, which also allows for a higher q.

It follows that, for a given q, a higher product (dm/dt)cp for the (hot or cold) fluid means a lower temperature difference between inlet and outlet for that fluid. And a lower product (dm/dt)cp for the (hot or cold) fluid means a higher temperature difference between inlet and outlet for that fluid.


Counterflow Heat Exchanger

The figure below shows a schematic of a counterflow heat exchanger along with temperature distribution for the hot and cold fluids. Once again, we treat the heat exchanger as insulated around the outside so that the only heat transfer is between the two fluids.

As one would expect, the cold fluid (bottom curve) heats up and the hot fluid (top curve) cools down.

schematic for counterflow heat exchanger

The same steps are followed to derive q for a counterflow heat exchanger as for a parallel flow heat exchanger. The only difference is that equation (7) does not have a negative sign. Equation (9) is the same as before, but with the following variables now defined differently, as follows:

ΔT1 = ThiTco

ΔT2 = ThoTci

Note that a counterflow heat exchanger is more efficient than a parallel flow heat exchanger. It takes a smaller heat transfer surface area As to achieve the same heat transfer rate q as a parallel flow heat exchanger, with all else being equal. But despite this there may be advantages to using a parallel flow heat exchanger instead of a counterflow exchanger, such as when we wish to limit the amount of heat transfer between two fluid streams.

Also note that in a counterflow heat exchanger Tco can be greater than Tho, but not for a parallel flow heat exchanger.

In principle, the maximum possible heat exchange would be achieved with a counterflow heat exhanger of infinite length. In such a heat exchanger the maximum possible temperature difference achieved (by one of the fluids) would be equal to ThiTci. For example, the cold fluid would be heated to the inlet temperature of the hot fluid, or the hot fluid would be cooled to the inlet temperature of the cold fluid. The maximum possible temperature difference will occur for the (hot or cold) fluid with the lowest product (dm/dt)cp. It will be this fluid which experiences the greatest temperature change between inlet and outlet. Therefore, with known inlet temperatures for both fluids, the maximum possible heat transfer rate for a counterflow heat exchanger is given by qmax = Cmin(ThiTci), where Cmin is the minimum of the product (dm/dt)cp for either the hot or cold fluid. By conservation of energy, the fluid with the greater product (dm/dt)cp will also experience the same rate of heat transfer qmax, but it will have a lower temperature difference between inlet and outlet since the product (dm/dt)cp is larger. Thus, it is easiest to calculate the maximum rate of heat transfer (qmax) for the (hot or cold) fluid which experiences the greatest possible temperature difference between inlet and outlet (ThiTci), which in turn must correspond to the fluid with the smallest product (dm/dt)cp.

Knowing qmax can be useful in making design decisions since it tells you how close your heat exchanger design is to delivering its theoretical maximum rate of heat transfer, and this in turn tells you how much improvement is possible. Keep in mind that the maximum rate of heat transfer (qmax, as given above) applies to any heat exchanger (not just a counterflow heat exchanger).


For a parallel flow or counterflow heat exchanger, if one of the (hot or cold) fluid streams is condensing or evaporating, its temperature will remain approximately constant between inlet and outlet. This constant temperature can then be applied to the equations as Tci = Tco (for the cold fluid) or Thi = Tho (for the hot fluid). These temperatures (along with other known variables) can then be substituted into equation (9) and one of the two equations shown below (which were given previously). The equation to use is the equation associated with the fluid that is not condensing or evaporating. Equation (9) and this one other equation can then be used to solve the problem. (Note that the convection coefficient for the condensing or evaporating fluid will need to be determined given its (known) condensation or evaporation temperature, and this convection coefficient will be one of the variables used to calculate the overall heat transfer coefficient, which is discussed next).

total heat transfer rate for parallel flow heat exchanger


The Overall Heat Transfer Coefficient

The overall heat transfer coefficient U is straightforward to calculate for steady state flow. To illustrate, consider the figure below which shows a fluid flowing through an (unfinned) tube.

flow through unfinned tube

Where:

hi is the internal convection coefficient

ho is the external convection coefficient

Tm1 is the mean temperature of the fluid flowing inside the tube, at the entrance. Note that this mean temperature is the average temperature of the fluid over the cross-sectional area

Tm2 is the mean temperature of the fluid flowing inside the tube, at the exit

T is the ambient temperature outside the tube (assumed constant everywhere)

Ri is the inside radius of the tube

Ro is the outside radius of the tube

L is the tube length


The U value for the tube heat transfer can be calculated from the following equation:

overall u value calculation

where A can either be equal to Ai or Ao, where Ai = 2πRiL and Ao = 2πRoL. The value of A can be chosen arbitrarily since the product UA will not change as a result.

Also,

thermal r value for cylinder

where k is the thermal conductivity of the tube (a cylinder).

Equation (10) comes from the fact that energy flow is constant (steady state) through the different mediums located between the tube fluid and the ambient. To show this, consider the schematic shown below. For visualization purposes let's imagine we have an imaginary differential strip (of thickness dx, in the x-direction) wrapping around the tube at some position x along the tube length. At this position x, heat flows outward in the radial direction through the strip at a rate dq(x). (Note that axial heat conduction (in the x direction) is assumed negligible).

flow through unfinned tube 2

We can write the following heat rate equations:

heat flow through unfinned tube

Where:

Tm(x) is the mean fluid temperature at position x

Ts1(x) is the inner wall temperature at position x

Ts2(x) is the outer wall temperature at position x

dAi is the area on the inside tube wall, at the location of the differential strip, where dAi = 2πRidx

dAo is the area on the outside tube wall, at the location of the differential strip, where dAo = 2πRodx

dq1 is the heat flow (through the differential strip) between the fluid (at mean temperature Tm(x)) and the inner tube wall (at temperature Ts1(x))

dq2 is the heat flow through the tube wall (through the differential strip), with inner wall temperature Ts1(x) and outer tube wall temperature Ts2(x)

dq3 is the heat flow (through the differential strip) between the outer tube wall (at temperature Ts2(x)) and the ambient (at temperature T)


For steady state heat flow,

flow through unfinned tube 3

where dq(x) is the heat flow through the differential strip at position x. Thus we can write

heat flow through diff strip

and U is defined as the overall heat transfer coefficient, which allows the heat flow rate to be expressed in a convenient and compact way, as given by equation (11).

Note that dA is chosen arbitrarily as either dAi or dAo. The above equation is a mathematical result of dq1 = dq2 = dq3.

U is a constant, independent of position x, in the above equation. To see this rewrite the above equation as

u value calc for diff strip

Since hi, ho, dA/dAi, dARw, and dA/dAo are all constants then U is a constant. As a result, the calculation of U from the above equation gives the same result as calculating U from Equation (10), so it’s consistent.

Note that equation (11) has the same form as equation (8) (with q = q(x)). Also, the energy balance for the fluid flow remains the same here as in equations (6) or (7). And since the ambient temperature is treated as constant here we can use equation (9) for the overall heat transfer q provided that we treat one of the fluid streams as having constant temperature throughout. Therefore, we can set Thi = Tho = T. Thus,

temperature equation for tube flow with constant external temp

Where:

ΔT1 = TTci

ΔT2 = TTco


A positive value of q means that heat is flowing into the tube, and a negative value of q means that heat is flowing out of the tube.


For the case of a tube with fins on the inside and/or outside we can still use equation (10) but with a correction factor η now included which corrects for the presence of the fins (and any contact resistance, as mentioned earlier). Thus,

corrected u value for fins

Where:

ηi is the correction factor for the inside surface of the tube, and ηo is the correction factor for the outside surface of the tube. This correction factor is between 0 and 1. For an unfinned surface η = 1.

The area on the inside of the tube (fin area plus exposed base) is equal to Ai. The area on the outside of the tube (fin area plus exposed base) is equal to Ao.

Once again, A can be chosen to be either the total surface area on the inside surface (Ai) or on the outside surface (Ao). The choice does not matter since the product UA is constant. Note that if we choose A on a side on which fins are present, then A is the total surface area comprised of the surface area all around the fins plus the surface area of the exposed base (between the fins).

The correction factors η can be found for a variety of finned surfaces (based on their shape, size, spacing, thickness, etc.) and is given in analysis books on heat exchangers, such as Compact Heat Exchangers, by Kays and London. This book is a good reference for those wanting to design or analyze finned heat exchangers. To purchase this book, click on the image link below. You will be taken to the Amazon website, where you can make your purchase.


Finally, we can add fouling factors to the above equation which accounts for deposits accumulating on the inner and outer surfaces, over time. These deposits can be a result of fluid impurities, rust, or chemical reactions between the fluid and wall material. The modified equation accounting for fouling factors then becomes

corrected u value for fins and fouling

where Rfi'' is the fouling factor on the inside tube surface and Rfo'' is the fouling factor on the outside tube surface. Typical fouling factor values are given in the section on Fouling Resistance in this heat transfer textbook available for free online, written by John H. Lienhard (IV and V), from the Department of Mechanical Engineering, University of Houston, and Massachusetts Institute of Technology (respectively). This is also a good reference for heat exchangers and heat transfer theory. I used this book as a reference when creating this page.

Since the heat transfer q is directly proportional to the product UA (from equation 12) one would wish to maximize UA in order to maximize the rate of heat transfer.

Looking at the above equation you can only maximize UA by minimizing the above equation (1/UA). This can be done by making all the terms on the right side as small as possible (while still meeting heat exchanger design requirements). The magnitude of the above equation is limited by the largest term on the right side of the equation, whatever it works out to be (based on the parameters of the problem). So it makes sense to keep all terms as small as possible, which means keeping the fouling factors and Rw as small as possible, and using fins on the inside of the tube, if practical (such as aligned with the flow direction) and the outside of the tube, in order to increase the products ηihiAi and ηohoAo, which results in increased product UA.

For example, lets say the fouling factors and Rw are small enough to be neglected, and let’s say ηihiAi = X and ηohoAo = 5X, in which the outside tube surface is finned and the inside tube surface is unfinned (which is why ηohoAo is larger).

Now, substitute ηihiAi = X and ηohoAo = 5X into the above equation and we get UA1≅ (5/6)X

Now let’s say that we add fins to the inside tube surface as well so that ηihiAi and ηohoAo are comparable in magnitude so that ηihiAiηohoAo≅ 5X

Now, substitute ηihiAi = ηohoAo = 5X into the above equation and we get UA2≅ (5/2)X

UA2/UA1 = 3, which is clearly a large improvement in heat transfer by making both surfaces finned.


Estimating The Convection Coefficient h

Estimating the convection coefficient for a variety of geometries, fluid types, and flow conditions, is a difficult problem, and is by no means simple to explain in brief terms. For this reason it is best to refer to dedicated sections in books that explain in detail how to estimate convection coefficients for different configurations, along with associated pressure drop for the fluid streams. For standard finned surfaces one may refer to the book Compact Heat Exchangers listed above, to find the convection coefficients. For unfinned surfaces one may refer to the sections on convective heat transfer, as explained in the heat transfer textbook (in PDF format, linked to above). Alternatively, you may prefer to reference a heat transfer book directly which also gives convection coefficient estimates for unfinned surfaces. A good book for this is Fundamentals of Heat and Mass Transfer, 5th Edition, by Incropera and Dewitt. The relevant sections in this book are on internal and external flow, and boiling and condensation. The fourth edition of this book was a very useful reference that I used when creating this page. To purchase this book, click on the image link below. You will be taken to the Amazon website, where you can make your purchase.


Some typical values of the convection coefficient h are:

• Free convection for gases: 2-25 W/m2K

• Free convection for liquids: 50-1000 W/m2K

• Forced convection for gases: 25-250 W/m2K

• Forced convection for liquids: 50-20,000 W/m2K

• Convection with phase change (boiling or condensation): 2500-100,000 W/m2K

The reference for the above values is from: Fundamentals of Heat and Mass Transfer, Fourth Edition, page 8, by Incropera and Dewitt, 1996.


Example Problem For Counterflow Heat Exchanger

We are given a counterflow heat exchanger with the following known values:

cpc = 4200 J/kg.K

cph = 1000 J/kg.K

dmc/dt = 1 kg/s

dmh/dt = 1.7 kg/s

Tci = 40 degrees Celsius

Thi = 280 degrees Celsius

As = 0.7 m2 (heat transfer surface area)

Rw = 4.0 x 10⁻⁵ K/W (wall thermal resistance)

hc = 1000 W/m2K (convection coefficient for cold fluid)

hh = 250 W/m2K (convection coefficient for hot fluid)

Assume that the heat transfer surface area on the cold and hot side are approximately equal.

Find the outlet temperature of the hot and cold fluid and the rate of heat transfer (q) between them.


Solution

There are three unknowns to solve for. They are Tco, Tho, and q. We need three equations to solve for these three unknowns.

The first equation to use represents the heat transfer rate (q) into the cold fluid: q = (dmc/dt)cpc(TcoTci)

The second equation to use represents the heat transfer rate (q) out of the hot fluid. This is equal to the heat transfer rate into the cold fluid. The equation is: q = (dmh/dt)cph(ThiTho)

The third equation to use is given by equation (9), with the following variables defined as follows for a counterflow heat exchanger:

ΔT1 = ThiTco

ΔT2 = ThoTci

To calculate U we can use equation (10). With hihc and hohh this gives a value of U = 198.89 W/m2K.

Solving numerically, we get Tco = 47.5 degrees C, Tho = 261.4 degrees C, and q = 31590 W.


Heat Exchanger Design

To choose a suitable heat exchanger for a certain application requires a level of knowledge and experience. The information presented here along with the books referenced here is certainly a good start. When designing or choosing a heat exchanger there is no single "correct" solution. Different types of heat exchangers can work equally well. The Wikipedia page contains good general information on different heat exchanger types.

There are different ways to optimize heat exchanger design. Part of the optimization usually requires that the tube wall thickness be as small as possible (while still being strong enough), and the thermal conductivity of the tube material be as high as possible. This ensures that the thermal resistance of the tube wall is as low as possible which aids in heat transfer. Also, we wish to keep the pressure drop of the hot and cold fluid streams between inlet and outlet as small as possible. However, to increase the rate of heat exchange between the two streams we must increase the convection coefficient (h), by either adding fins, increasing surface roughness, increasing tube length and/or decreasing tube diameter. But this unavoidably increases the pressure drop and consequently increases the pump power requirements to overcome the flow resistance associated with this pressure drop. Hence, good heat exchanger design must be a tradeoff between pressure drop and good heat exchange. In some cases, such as for shell-and-tube heat exchangers, it may be possible to minimize pressure drop by appropriately selecting one of the fluids to flow inside the shell, and the other to flow in the tubes.

Given the inherent mathematical complexity of heat exchanger design (such as estimating convection coefficients for complex flow patterns), it is often necessary to use heat exchanger software to aid in the design process, and to do so in a time efficient way. This is evident when one considers all the different design parameters to be evaluated when coming up with a "best" design. Some examples of common design parameters to be taken into account are:

• Flow rate of both fluid streams

• Inlet and outlet temperatures of both streams

• Operating pressure of both streams

• Allowable pressure drop of both streams

• Fouling resistance for both streams

• Physical properties of both streams

• Type and configuration of heat exchanger

• Tube sizes, number of tubes, number of baffles (if applicable), baffle size, baffle spacing

• Number of fins (if applicable), fin size, fin spacing, and the fan or blower power necessary to force air (or another medium) through the fins

• Material types used in the heat exchanger

• Size limitations

• Others, depending on design requirements


Clearly, heat exchanger design is a multivariable problem which does not usually lend itself to a simple solution. Several design iterations may be necessary before settling on a good design.


I went through my own heat exchanger design efforts when building a homemade air conditioner some time ago. It was a fun project which gave me a good practical understanding of how heat exchangers work. My first build attempt is shown in the two pictures below.

homemade ac picture 1

homemade ac picture 2

The picture above shows the inside of the unit. Air blows through the annular space and around a cold ice-water filled metal pail, causing the air to cool down before exiting through a hole at the top. Temperature measurements revealed that the air came out about 2.5 degrees Celsius cooler than it was going in. The heat exchange taking place is between the ice-water and the air. Naturally I want the heat exchange to be as high as possible so that the air comes out as cool as possible. So the task of figuring out how to do this is a heat exchanger problem.


For my second attempt I added vertical wooden rods in the flow stream which helped to induce turbulent mixing which boosted heat transfer between the ice-water and air stream. This is shown in the picture below. The result was that the air came out about 3 degrees Celsius cooler, which is a slight improvement.

homemade ac picture 3

Not being satisfied with the result I decided to change the design completely. In this design (shown below) I made a U-shaped channel, which worked much better. Temperature measurements revealed that the exiting air was about 10 degrees Celsius cooler than it was going in, which is a great improvement over the earlier design.

homemade ac picture 4

homemade ac picture 5

The picture above shows the U-shaped channel I made out of thin aluminum sheet, wood, and lots of silicone sealant around the edges so that water doesn't leak in when immersed in the ice-water. The channel has about a 1.8 cm gap through which the air flows. The width of the channel is 25 cm, and the length of the channel (i.e. the flow length along the U-shape) is about 60 cm. The U-shaped channel sits in a cooler of ice-water and the fan sits on top of the duct which has a hole in it so that the fan sits in snugly.

However, the household fan has difficulty blowing air through the narrow and long gap of the U-channel. The greatly improved heat transfer (and increased cooling of the air) resulting from the narrower and longer gap means that significant back pressure is created, which results in the fan having a much harder time pushing the air through the channel. The fan speed has to be set at the highest setting to get a decent rate of air flow through the channel. This is the tradeoff mentioned earlier between greater pressure drop and the increased heat transfer that results. Physically speaking, the fan must overcome the resistance to air flow associated with the pressure drop caused by the narrow and long gap the air must travel through. In this case it would be better to use a blower of some sort which is designed to push air in the presence of back pressure.

Fouling Calculations

$
0
0

Fouling Calculations

Fouling Calculations are the main simulation calculations in The Monitorcomputer program.  On a case-by-case basis, the program determines the heat, material and pressure balances over all the units in the network and the fouling coefficient for each exchanger.

Network Balance Calculations

Solving the Network balances involves calculating the heat, mass and pressure balances on all the exchangers and other unit operations.  These balances use unit feed stream data along with user specifications to calculate product stream information.  The calculations iterate until the network has converged for stream temperatures, flows and pressures.If Data Reconciliation has been run for a case, the reconciled data will automatically be used in Fouling Calculations.

Exchanger Balances

The flow rate and temperature of each feed to an exchanger are known.  One exit temperature must be specified.  The other exit temperature is determined by heat balance.The calculated exit temperature may depend on the pressure so the pressure and heat balances must be solved together.  The exchanger pressure drop is calculated from the flow rate, temperatures, fluid properties and mechanical data.  Instead of using the calculated pressure drop, you may enter pressure values for exchanger exit streams.

Actual Coefficient (Uactual)

The Actual Heat Transfer Coefficient (sometimes called the Dirty Heat Transfer Coefficient) is determined for each exchanger for each case from the equation:
Q = Uactual.A.MTD
where:
Q = duty, calculated from heat balance
Uactual = actual heat transfer coefficient
A = total exchanger area specified
MTD = Mean Temperature Difference
MTD is calculated from the Logarithmic Mean Temperature Difference (LMTD) which, for a counter-current heat exchanger, is defined by:
               
where
 
The calculation of LMTD assumes that the exchanger is single pass.  However, most real exchangers have more than one pass.  The MTD is a modified value for the LMTD which takes into account the number of shell and tube passes. MTD is determined by:
where: FT = LMTD correction factor.
For a single shell and tube pass exchanger, FT is always 1.0. Correction Factors for multi-pass exchangers are functions of the four exchanger stream temperatures and the number of shell passes in the unit.  The more shell passes, the higher the value of FT.  They are calculated from methods available in open literature.

Clean Coefficient (Uclean)

The cleanheat transfer coefficient value is a function of Reynolds and Prandtl numbers, calculated from fluid properties and exchanger configuration, and tube wall thermal conductivity.

Fouling Resistance

The difference between the actual value and the clean value determines the extent of fouling in the exchanger. The fouling resistance (Rf ) is determined as:
Rf = 1/Uactual– 1/Uclean

Results

After the calculation, the results are written back into the database.  You may examine all results in the Results Output Tabular Report. You may view results for individual units or streams using their Shortcut Menus.

Specifying Fouling Factors

If you later want to investigate the effect of different fouling factors on the furnace inlet temperature, use the Specify Fouling calculation.This calculation allows you to modify fouling factors for any or all exchangers and determine exchanger exit temperatures. The results are shown in theSpecify Fouling Report which shows the calculation history, exchanger exit temperatures and the furnace inlet temperatures.

Monitor™ economic calculations answer common questions about the cost of fouling,

$
0
0

Economic Calculations

Monitor economic calculations answer common questions about the cost of fouling, the benefits to be gained from cleaning and help to develop an optimum cleaning strategy.

Cleaning Economics Reports

Monitor Cleaning Economics calculations determine the effects of cleaning exchangers in the Network.  These are shown in tabular form  and include:
  • the cost of removing exchangers for cleaning
  • the savings that could be made by cleaning selected exchangers
  • the optimum cleaning cycles for each exchanger and for user-defined groups of exchangers.
In addition, one of the standard spreadsheet reportsis the Fouling Cost Summary which shows the additional costs that have been incurred over a range of cases for the furnace to make up the duty lost. 

Economic Data Required

The Cleaning Economic calculations require the following data:

Globally:

  • The Fuel Cost and the Furnace Efficiency are used when generating all economic reports. 
  • The Length of Plant Run is only used in the optimum cleaning cycle report. 
  • Fuel Cost expressed in $ per unit of duty.  The default value is the Solomon value for fuel oil.
  • Furnace Efficiency. The fuel cost is divided by this value to obtain the total cost of the fuel.
  • Length of Plant Run expressed as number of days between plant shutdowns.  This is used in the optimum cleaning cycle calculation.

For each exchanger:

  • Date Last Cleaned. This is used in the optimum cleaning cycle report.
  • Days to Clean. The number of days that an exchanger will be out of service when it is removed for cleaning.  This is used in the optimum cleaning cycle report.
  • Cleaning Cost. The fixed costs (man time, cleaning materials, etc.) associated with removing and cleaning an exchanger.  This does not include additional costs incurred by the reduced Network duty.  This cost is used in the optimum cleaning cycle report.
  • Clean Fouling Factor for the exchanger when returned to service after cleaning.  This is used in the Cleaning Economics calculation and the optimum cleaning cycle report.

How Cleaning Economics are Calculated

Fouling factors are first calculated for a selected Case.  These are used to calculate temperatures for all exchangers and at the furnace inlet.

Cost of removing exchangers for cleaning

The Network is solved and the furnace run-up temperature calculated with each exchanger in turn bypassed.  This determines the effect of removing the exchangers for cleaning in terms of lost enthalpy at the furnace inlet, also expressed as $/day. The program also calculates the amount by which the throughput would have to be reduced in order to maintain the furnace inlet temperature at its previous level.

Savings from cleaning

The fouling factor of each exchanger in turn is then set to its clean value and the Network is solved to obtain the increase in duty that this would produce at the furnace inlet.  This is shown as extra throughput which could be achieved and $/day.

Optimum cleaning cycles

The above results are then used, along with fixed costs, to calculate the optimum cleaning cycles for each exchanger.  The optimum cycle is that which minimises the annualised cost of fouling. By default, each exchanger is cleaned in turn.  Combinations of exchangers to be cleaned in addition to individual exchangers are defined in the User Defined Cleaning Economics Combinations Window.


Flexible Output

MONITOR's output capabilities are extensive.  
  • You can export the PFD drawing to PowerPoint so that you can use it in a presentation. 
  • You can get results tables displayed directly on the screen.
  • You can have a summary of Reconciliation, Fouling and NFIT runs for a range of cases.
  • You can plot results from a range of cases to view trends.
Output can be produced in any combination of Units of Measurement.
Tables:   


Summary:
Calculation History


Plots:   

User-Defined Plots

Tabular Output

You can get the results of the current case displayed as a table directly on the screen.  
You can export these results to Word or to a Text file. 


Input Data Reprint

To enable you to check all your data, Monitor prints it all out at the start of the main results output.
The network data include:
  • connectivity 
  • mechanical data 
Case data include:
  • stream temperatures, pressures, flowrates and properties
  • exchanger temperatures
  • mixer temperatures
  • splitter ratios


Reconciliation

Monitor uses measured plant temperatures and flowrates to calculate heat exchanger fouling factors. The Data Reconciliation calculation identifies inconsistencies in the input data and enables you to obtain a more consistent set of data for the fouling calculation.
Reconciliation output shows the duties calculated from the supplied flowrates and temperatures for each side of target exchanger and the differences between them. It also shows the differences between the target and calculated temperatures of the  products of target mixers.
The same data are then shown after the reconciliation has been completed. The table shows by how much feed stream temperatures and flowrates and splitter ratios have been changed to achieve a reconciled data set.


Fouling

After a reprint of the input data, the fouling report shows tabular results for each type of heat exchanger in turn, followed by results for all other types of unit operation in turn. Finally, the temperatures, pressures, flows and properties are presented for all the streams in the Network. 
Heat exchanger results include:
  • Exchanger duties, clean and dirty coefficients
  • Tube and shell velocities and Reynold's Numbers
  • Mixer temperatures and duties
  • Stream temperatures, rates and properties.


Normalised Output

Normalisation is the technique Monitor uses to remove the effect of the changes in external parameters, such as crude and product variations, to determine a true picture of the degradation of network performance due to fouling alone.
The calculated fouling factors from each case are superimposed onto the feeds from a selected base case and the resultant temperatures reported.
Normalisation output includes:
  • fouling resistances used
  • exchanger exit temperatures
  • run-up stream temperature


Cleaning Economics

Cleaning Economics calculations determine the effect of cleaning exchangers in the Network and an optimum cleaning cycle for each exchanger.
Cleaning output includes:
  • The cost of removing each  exchanger as the additional fuel cost/day to make up the duty and as the loss in throughput if the duty was not made up by the furnace.
  • The increase in duty of the complete Network after each exchanger has been cleaned expressed as a reduced furnace cost to maintain current operation and an increased throughput which could be achieved if furnace duty was not reduced.
  • The Optimum Cleaning Cycle period which provides the lowest annualised cost of fouling. The savings shown are compared with the cost of cleaning once at the end of the plant run.


Splitter Optimisation

Splitter Optimisation determines splitter product ratios which maximise the heat recovery of the Network. This minimises the required furnace duty for the Network.
Optimisation output includes:
  • Initial and final enthalpy and temperature of the chosen run-up stream.
  • all exchanger inlet and outlet temperatures and flowrates at the optimum splitter setting.

Calculation Histories

This report summarises the Reconciliation and/or Fouling and/or NFIT results for all cases within a range you select.It is particularly useful for troubleshooting data errors.  
The report here shows a range of Data Reconciliation results, including some failed cases.
You can choose to display all cases or just failed cases.
 

Plotted Output


For monitoring over a time period, by far the most meaningful form of output is that presented in graphical format.
There are a number of standard, predefined reports. You may also define your own reports to include the parameters, units and/or streams that you require.
The data for the selected report are written to a text file which is then opened automatically in Excel. A plot is created for each set of data in the spreadsheet. You may then modify and save the workbook or copy plots or data into other applications.
The standard reports are:


Reconciliation

This report compares results for data reconciliation over the range of Cases. It shows:
  • the initial duty imbalance for target exchangers and the initial and final duties on the shell and tube sides for each exchanger.
  • changes in flowrate and temperature of feed streams.
        

Heat Transfer

This report contains heat transfer data for all the exchangers in the Network and any normalised furnace inlet temperatures.
For each exchanger there are plots for:
  • duty
  • fouling
  • U-values .. clean, actual and normalised
  • tube velocity
  • shell velocity
  • effectiveness


Fouling Cost

This report shows the additional costs incurred when a furnace makes up the duty lost because of fouling. 
The spreadsheet plots the following on separate worksheets:
  • The normalised furnace inlet temperature.
  • The Cost/day of the additional furnace duty required to make up for the network duty loss caused by the current level of fouling.
  • The cumulative additional furnace duty required since the start of the specified period. 
  • The cumulative fuel cost of the exchanger fouling since the start of the specified period.


Stream Temperatures

This report shows the temperatures of all streams in the Network. 
Feed streams, product streams and internal streams are presented separately and are plotted on separate worksheets.
Compare this plot of the actual furnace inlet stream temperatures with the normalised plot abov.  This shows the benefit of normalisation to give a more meaningful presentation of the true effect of fouling. 

Weight and Volume Flow Rates

These two reports show the weight and volume flowrates of all streams in the Network. Feed streams, product streams and internal streams are presented separately and are plotted on separate worksheets.
Weight Flowrates
Volume Flowrates

Pressures

The pressure at the inlet and outlet of each exchanger is listed on this report along with pressure drops. The plots for each exchanger are on separate worksheets and show:
  • Shell side inlet and outlet pressures
  • Shell side pressure drops
  • Tube side inlet and outlet pressures
  • Tube side pressure drops


User Defined Spreadsheet Outputs

If none of the standard spreadsheet reports meets your requirements, you may define your own reports.
You may specify a
  • Exchanger duty, U (actual and clean), fouling factor, velocities, Re, temperatures, MTD, LMTD and Ft.
  • Pump duty, heater and cooler temperatures and splitter ratios.
  • Stream temperatures, pressures, flowrate and liquid fraction. 

The overall heat-transfer coefficient of a heat exchanger under operating conditions is reduced by fouling

$
0
0

Fouling and Heat Transfer

The overall heat-transfer coefficient of a heat exchanger under operating conditions is reduced by fouling 

During operation with most liquids and some gases a dirt film gradually builds up on the heat-transfer surface. The deposit is referred to as fouling.
The increased thermal resistance of the deposit can generally be obtained only from actual tests or experience. The fouling factor can be determined from the relation
Rd = 1 / Ud - 1 / U   (1)
where 
Rd = fouling factor - or unit thermal resistance of the deposit (m2K/W)
Ud = thermal conductance of heat exchanger after fouling (W/m2K)
U = thermal conductance of clean heat exchanger (W/m2K)
(1) can also be expressed as:
Ud  = 1 / (Rd+ 1 / U)

Typical Fouling Factors

  • Alcohol vapors : Rd = 0.00009 (m2K/W)
  • Boiler feed water, treated above 325 K : Rd = 0.0002 (m2K/W)
  • Fuel oil : Rd = 0.0009 (m2K/W)
  • Industrial air : Rd = 0.0004 (m2K/W)
  • Quenching oil : Rd = 0.0007 (m2K/W)
  • Refrigerating liquid : Rd = 0.0002 (m2K/W)
  • Seawater below 325 K : Rd = 0.00009 (m2K/W)
  • Seawater above 325 K : Rd = 0.0002 (m2K/W)
  • Steam : Rd = 0.00009 (m2K/W)

Vapor and Steam Introduction to vapor and steam

$
0
0
 Vapor and Steam

Introduction to vapor and steam

Vapor is a gas -
there is no significant physical or chemical difference between a vapor and a gas.
  • a vapor is a substance in a gaseous state - at a condition where it is ordinarily liquid or solid
Our most common example of a vapor is steam - water vaporized during boiling or evaporation. The water vapor surrounding us in the atmosphere is invisible and is often called moist. Knowledge about moist in air is important in air-condition applications like HVAC systems and dryers. Moist air technology is called air psychrometrics.
Evaporation from fluids takes place when the liquid molecules at the liquid surface have enough momentum to overcome the intermolecular cohesive forces and escape to the atmosphere. When heat is added to the liquid the molecular momentum and the evaporation increases. A reduction of the pressure above a liquid will reduce the momentum needed for molecules to escape the liquid and increase the evaporation.
  • increasing the pressure above the liquid reduces the evaporation
This can be observed as lower boiling temperature for water at higher altitudes.
Common terms used in connection with vapor and steam:

Boiling

  • Boiling is formation of vapor bubbles within a fluid. Boiling is initiated when the absolute pressure in the fluid reaches the vapor pressure.

Saturated Vapor

  • Vapor at the temperature of the boiling point which corresponds to its pressure.

Wet Saturated Vapor

  • A wet saturated vapor carries liquid globules in suspension. A wet saturated vapor is a substance in the gaseous state which does not follow the general gas law.

Dry Saturated Vapor

  • A dry saturated vapor is free from liquid particles. All particles are vaporized - any decrease in the vapor temperature or increase in the vapor pressure, will condensate liquid particles in the vapor. A dry saturated vapor is a substance in the gaseous state which does not follow the general gas law.

Superheated Vapor

  • In superheated vapor the temperature is higher than the boiling point temperature corresponding to the pressure. The vapor can not exist in contact with the fluid, nor contain fluid particles. An increase in pressure or decrease in temperature will not - within limits - condensate out liquid particles in the vapor. Highly superheated vapors are gases that approximately follow the general gas law.

High Pressure Steam

  • Steam where the pressure greatly exceeds the atmosphere pressure.

Low Pressure Steam

  • Steam of which the pressure is less than, equal to, or not greatly above, that of the atmosphere.

Ideal Gas Law

$
0
0

Ideal Gas Law

In perfect or ideal gas the change in density is directly related to the change of temperature and pressure as expressed by the Ideal Gas Law


In perfect or ideal gas the change in density is directly related to the change of temperature and pressure as expressed by the Ideal Gas Law.

The Ideal Gas Law and the Individual Gas Constant - R

The Ideal Gas Law relates pressure, temperature, and volume of an ideal or perfect gas. The Ideal Gas Law can be expressed with the Individual Gas Constant:
p · V = m · R · T         (1)
where
p = absolute pressure (N/m2, lb/ft2)
V = volume (m3, ft3)
m = mass (kg, slugs)
R = individual gas constant (J/kg.oK, ft.lb/slugs.oR)
T = absolute temperature (oK, oR)
This equation (1) can be modified to:
p = ρ · R · T         (2)
where the density
ρ = m / V         (3)
The Individual Gas Constant - R - depends on the particular gas and is related to the molecular weight of the gas.
Equation (1) can also be modified to
p1 V1 / T1 = p2 · V2 / T2         (4)
expressing the relationship between different states for a given mass of gas.

The Ideal Gas Law and the Universal Gas Constant - Ru

The Universal Gas Constant is independent of the particular gas and is the same for all "perfect" gases. The Ideal Gas Law can be expressed with the Universal Gas Constant:
p · V = n · Ru· T         (5)
where
p = absolute pressure (N/m2, lb/ft2)
V = volume (m3, ft3)
n = is the number of moles of gas present
Ru = universal gas constant (J/mol.oK, lbf.ft/(lbmol.oR))
T = absolute temperature (oK, oR)

Example - The Ideal Gas Law

A tank with volume of 1 ft3 is filled with air compressed to a gauge pressure of 50 psi. The temperature in tank is 70 oF.
The air density can be calculated with a transformation of the ideal gas law (2) to:
ρ= p / (R · T)         (6)
ρ= [(50 (lb/in2) + 14.7 (lb/in2)) · 144 (in2/ft2)] / [1716 (ft.lb/slug.oR)· (70 + 460) (oR)]
    = 0.0102 (slugs/ft3)
The weight of the air is the product of specific weight and the air volume. It can be calculated as:
w = ρ · g · V         (7)
w = 0.0102 (slugs/ft3) · 32.2 (ft/s2) · 1 (ft3)
    = 0.32844 (slugs.ft/s2)
    = 0.32844 (lb)

Note!

The Ideal Gas Law is accurate only at relatively low pressures and high temperatures. To account for the deviation from the ideal situation, another factor is included. It is called the Gas Compressibility Factor, or Z-factor. This correction factor is dependent on pressure and temperature for each gas considered.
The True Gas Law, or the Non-Ideal Gas Law, becomes:
P · V = Z · n · R · T  (7)
where
Z = Gas Compressibility Factor
n = number of moles of gas present

Pipes and Tubes - Recommended Insulation Thickness

$
0
0
To avoid heat loss and reduced efficiency pipe work in heating systems should always be insulated. Very hot systems, like hot water and steam systems should also be insulated to avoid potential personal injuries.
The table below indicates recommended insulation thickness.
Recommended minimum Thickness of Insulation (inches)*
Nominal Pipe Size
NPS
(inches)
Temperature Range (oC)
50 - 9090 - 120120 - 150150 - 230
Temperature Range (oF)
120 - 200201 - 250251 - 305306 - 450
Hot WaterLow Pressure SteamMedium Pressure SteamHigh Pressure Steam
< 1"1.01.52.02.5
1 1/4" - 2"1.01.52.52.5
2 1/2" - 4"1.52.02.53.0
5" - 6"1.52.03.03.5
> 8"1.52.03.03.5
* based on insulation with thermal resistivity in the range 4 - 4.6 ft2 hr oF/ Btu in

Water Delivery Flow Velocities

$
0
0

Water Delivery Flow Velocities

 Required flow velocities in water transport systems - on the delivery side of the pump

As a rule of thumb the following velocities can be used in design of piping and pumping systems for water:
Pipe DimensionWater
inchesmmm/sft/s
12513.5
2501.13.6
3751.153.8
41001.254
61501.54.7
82001.755.5
1025026.5
123002.658.5

Refrigerants - Environment Properties

$
0
0

Refrigerants - Ozone Depletion (ODP) and Global Warming Potential (GWP)

Common refrigerants and Ozone Depletion Potential (ODP) and Global Warming Potential (GWP) are indicated below.
  • Ozone Depletion Potential (ODP) of a chemical compound is the relative amount of degradation  it can cause to the ozone layer
  • Global Warming Potential (GWP) is a measure of how much a given mass of a gas contributes to global warming. GWP is a relative scale which compares the amount of heat trapped by greenhouse gas to the amount of heat trapped in the same mass of Carbon Dioxide. The GWP of Carbon Dioxide is by definition 1. Be aware that GWPs are highly controversial.
RefrigerantOzone Depletion Potential
(ODP)
Global Warming Potential
(GWP)
R-11 Trichlorofluoromethane1.04000
R-12 Dichlorodifluoromethane1.02400
R-13 B1 Bromotrifluoromethane10
R-22 Chlorodifluoromethane0.051700
R-32 Difluoromethane0650
R-113 Trichlorotrifluoroethane0.84800
R-114 Dichlorotetrafluoroethane1.03.9
R-123 Dichlorotrifluoroethane0.020.02
R-124 Chlorotetrafluoroethane0.02620
R-125 Pentafluoroethane03400
R-134a Tetrafluoroethane01300
R-143a Trifluoroethane04300
R-152a Difluoroethane0120
R-245a Pentafluoropropane0
R-401A (53% R-22, 34% R-124, 13% R-152a)0.371100
R-401B (61% R-22, 28% R-124, 11% R-152a)0.041200
R-402A (38% R-22, 60% R-125, 2% R-290)0.022600
R-404A (44% R-125, 52% R-143a,  R-134a)03300
R-407A (20% R-32, 40% R-125, 40% R-134a)02000
R-407C (23% R-32, 25% R-125, 52% R-134a)01600
R-502 (48.8% R-22, 51.2% R-115)0.2834.1
R-507 (45% R-125, 55% R-143)03300
R-717 Ammonia - NH300
R-718 Water - H200
R-729 Air0
R-744 Carbon Dioxide - CO2 1*
*  CO2 is the GWP reference

Measuring Air Humidity

$
0
0


Measuring relative air humidity with dry and wet bulb temperatures

Air humidity can be estimated by measuring
  • the dry bulb temperature
  • the wet bulb temperature
humidity measurement dry wet bulbe temperature
Dry Bulb Temperature - Tdb - can be measured with a simple thermometer as shown above.
Wet Bulb Temperature - Twb - can be measured with a standard thermometer with some wet clothing, cotton or similar, around the bulb. Note that a continuously air flow is important to evaporate water from the wet clothing and achieve a correct wet bulb temperature.
Sufficient air movement can be achieved with a sling thermometer or similar.
Relative humidity can be estimated from the tables below or alternatively from a psyhrometric or Mollier diagram.

Temperature in Fahrenheit

Relative Humidity - RH (%)
Difference Between Dry Bulb
and Wet Bulb Temperatures
 Tdb - Twb
(oF)
Dry Bulb Temperature - Tdb (oF)
6064687276808488
19495959596969696
29090909191929292
38485858687888889
47880818283848485
57375767879808081
66870727375767778
76366676971727374
85861636567687071
95457596163656668
104952555759616364
dry and wet bulb temperature - relative moisture diagram degrees fahrenheit

Temperature in Celsius

Relative Humidity - RH (%)
Difference Between Dry Bulb
and Wet Bulb Temperatures
 Tdb - Twb
(oC)
Dry Bulb Temperature - Tdb (oC)
1518202225273033
19091919292929393
28082838485858687
37173757677787980
46265676870717374
55357596164656769
64449525457596163
73642454751535558
82834384145475053
92127313439414548
101320252833364043
dry and wet bulb temperature - relative moisture diagram degrees celsius

Ammonia

$
0
0

Documentation for Immediately Dangerous To Life or Health Concentrations (IDLHs)


Ammonia

CAS number: 7664-41-7
NIOSH REL: 25 ppm (18 mg/m3) TWA, 35 ppm (27 mg/m3) STEL
Current OSHA PEL: 50 ppm (35 mg/m3) TWA
1989 OSHA PEL: 35 ppm (27 mg/m3) STEL
1993-1994 ACGIH TLV: 25 ppm (17 mg/m3) TWA, 35 ppm (24 mg/m3) STEL
Description of substance: Colorless gas with a pungent, suffocating odor.
LEL: 15% (10% LEL, 15,000 ppm)
Original (SCP) IDLH: 500 ppm
Basis for original (SCP) IDLH: The chosen IDLH is based on the statement by AIHA [1971] that 300 to 500 ppm for 30 to 60 minutes have been reported as a maximum short exposure tolerance [Henderson and Haggard 1943]. AIHA [1971] also reported that 5,000 to 10,000 ppm are reported to be fatal [Mulder and Van der Zahm 1967] and exposures for 30 minutes to 2,500 to 6,000 ppm are considered dangerous to life [Smyth 1956].
Existing short-term exposure:
1988 American Industrial Hygiene Association (AIHA) Emergency Response Planning Guidelines (ERPGs)
  • ERPG-1: 25 ppm
  • ERPG-2: 200 ppm
  • ERPG-3: 1,000 ppm
National Research Council [NRC 1987] Emergency Exposure Guidance Levels (EEGLs)
  • 1-hour EEGL: 100 ppm
  • 24-hour EEGL: 100 ppm
U.S. Navy Standards [U.S. Bureau of Ships 1962] Maximum allowable concentrations (MACs):
  • Continuous exposure (60 days): 25 ppm
  • 1 hour: 400 ppm
ACUTE TOXICITY DATA
Lethal concentration data:
SpeciesReferenceLC50(ppm)LCLo(ppm)TimeAdjusted 0.5-hr LC (CF)Derived Value
RatAlarie 198140,300-----10 min23,374 ppm (0.58)2,337 ppm
RatAlarie 198128,595-----20 min23,448 ppm (0.82)2,335 ppm
RatAlarie 198120,300-----40 min23,345 ppm (1.15)2,335 ppm
RatAlarie 198111,590-----1 hr16,342 ppm (1.41)1,634 ppm
RatBack et al. 19727,338-----1 hr10,347 ppm (1.41)1,035 ppm
MouseBack et al. 19724,837-----1 hr6,820 ppm (1.41)682 ppm
RabbitBoyd et al. 19449,859----- 1 hr13,901 ppm (1.41)1,309 ppm
CatBoyd et al. 19449,859----- 1 hr13,901 ppm (1.41)1,309 ppm
RatDeichmann and Gerarde 19692,000-----4 hr5,660 ppm (2.83) 566 ppm
MammalFlury 1928-----5,0005 min2,050 ppm (0.41)205 ppm
MouseKapeghian et al. 19824,230-----1 hr5,964 ppm (1.41)596 ppm
HumanTab Biol Per 1933-----5,0005 min 2,050 ppm (0.41)205 ppm
*Note: Conversion factor (CF) was determined with "n" = 2.0 [ten Berge et al. 1986]. Other animal data:RD50 (mouse), 303 ppm [Appelman et al. 1982].
Other human data: The maximum short exposure tolerance has been reported as being 300 to 500 ppm for 0.5 to 1 hour [Henderson and Haggard 1943]. A change in respiration rate and moderate to severe irritation has been reported in 7 subjects exposed to 500 ppm for 30 minutes [Silverman et al. 1946].
Revised IDLH: 300 ppm
Basis for revised IDLH: The revised IDLH for ammonia is 300 ppm based on acute inhalation toxicity data in humans [Henderson and Haggard 1943; Silverman et al. 1946].
REFERENCES:
  1. AIHA [1971]. Anhydrous ammonia. In: Hygienic guide series. Am Ind Hyg Assoc J 32:139-142.
  2. Alarie Y [1981]. Dose-response analysis in animal studies: prediction of human responses. Environ Health Perspect 42:9-13.
  3. Appelman LM, ten Barge WF, Reuzel PGJ [1982]. Acute inhalation toxicity study of ammonia in rats with variable exposure periods. Am Ind Hyg Assoc J 43:662-665.
  4. Back KC, Thomas AA, MacEwen JD [1972]. Reclassification of materials listed as transportation health hazards. Wright-Patterson Air Force Base, OH: 6570th Aerospace Medical Research Laboratory, Report No. TSA-20-72-3, pp. A-172 to A-173.
  5. Boyd EM, MacLachlan ML, Perry WF [1944]. Experimental ammonia gas poisoning in rabbits and cats. J Ind Hyg Toxicol 26:29-34.
  6. Deichmann WB, Gerarde HW [1969]. Trifluoroacetic acid (3FA). In: Toxicology of drugs and chemicals. New York, NY: Academic Press, Inc., p. 607.
  7. Flury F [1928]. Moderne gewerbliche vergiftungen in pharmakologisch-toxikologischer hinsicht (Pharmacological-toxicological aspects of intoxicants in modern industry). Arch Exp Pathol Pharmakol 138:65-82 (translated).
  8. Henderson Y, Haggard HW [1943]. Noxious gases. 2nd ed. New York, NY: Reinhold Publishing Corporation, p. 126.
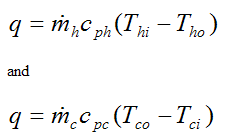
  9. Kapeghian JC, Jones AB, Mincer HH, Verlangieri AJ, Waters IW [1982]. The toxicity of ammonia gas in the mouse. Fed Proc 41:1568 [Abstract #7586].
  10. Mulder JS, Van der Zahm HO [1967]. Fatal case of ammonium poisoning. Tydschrift Voor Sociale Geneeskunde (Amsterdam) 45:458-460 (translated).
  11. NRC [1987]. Emergency and continuous exposure guidance levels for selected airborne contaminants. Vol. 7. Ammonia, hydrogen chloride, lithium bromide, and toluene. Washington, DC: National Academy Press, Committee on Toxicology, Board on Toxicology and Environmental Health Hazards, Commission on Life Sciences, National Research Council, pp. 7-15.
  12. Silverman L, Whittenberger JL, Muller J [1946]. Physiological response of man to ammonia in low concentrations. J Ind Hyg Toxicol 31:74-78.
  13. Smyth HF Jr [1956]. Improved communication: hygienic standards for daily inhalation. Am Ind Hyg Assoc Q 17(2):129-185.
  14. Tab Biol Per [1933]; 3:231-296 (in German).
  15. ten Berge WF, Zwart A, Appelman LM [1986]. Concentration-time mortality response relationship of irritant and systematically acting vapours and gases. J Haz Mat 13:301-309.
  16. U.S. Bureau of Ships [1962]. Submarine atmosphere habitability data book. AVSHIPS 250-649-1. Rev. 1. Washington, DC: U.S. Department of the Navy, U.S. Bureau of Ships, p. 629.

NDMA pegs death toll at 10,000, NORTH INDIA TSUNAMI

$
0
0
Dehradun/New Delhi: The National Disaster Management Authority on Sunday said that the death toll in Uttarakhand floods might cross 10,000. "Like the Speaker said, it could be more than 10,000. The exact number, however, cannot be known immediately," NDMA Vice Chairman Shashidhar Reddy said. He added that as many 1500 people are still stranded in the hill state.
Uttarakhand Assembly Speaker Govind Singh Kunjwal had said on Saturday that he fears that more than 10,000 people could have been killed in the calamity. "When I returned from Garhwal, I said the death toll could be between 5000 and 10,000. But now I think the death toll could be more than 10,000," he said.
While there has been no clarity yet on how many people lost their lives in Uttarakhand floods, conflicting figures are emerging about the number of missing people also. Uttarakhand Chief Minister Vijay Bahuguna on Sunday claimed that as many as 3000 people could be missing in the floods but the NDMA pegged the figure at 1800.

"After compiling the data, I've been informed that around 3000 people are missing. If a person is not found in 30 days, the state government will give compensation to the family. About 1335 villages still have no connectivity or aid," Bahuguna said.
The Chief Minister also said a team of 200 people has been formed, including doctors, which will take DNA samples of the dead bodies found. Bahuguna added that out of 4200 villages, connectivity has been restored in 2865 villages. Relief material is being provided through choppers to rest of the 1335 villages, he said. He further clarified that there are no report of an epidemic anywhere.
The NDMA Vice Chairman said that among the 1500 people who are stranded at various parts of Uttarakhand, there are many locals also. "According to the figures 1,07,670 people have been rescued so far. The road between Badrinath and Rambada has been repaired while a stretch in Lambagad is being repaired," he added. The road from Joshimath to Govindghat has now been restored and pilgrims are being evacuated on foot. But there is confusion over the number of pilgrims on ground.
The rescue operations in Uttarakhand are set to wind by Monday and the focus of the security forces has shifted on saving 2000 people, who are still stuck in the higher reaches. However, evacuated pilgrims claim that far greater number of pilgrims are stranded than what the officials have been stating.
According to the Indian Air Force, 842 people were rescued from Badrinath on Saturday even as air sorties were stalled briefly due to bad weather and many pilgrims in Badrinath were evacuated on foot through a newly constructed foot track in Govindghat valley. Harsil was fully evacuated on Saturday.
Meanwhile, the India Meteorological Department (IMD) has claimed it issued several advisories to the Uttarakhand government, warning it about the massive landslides and rains that have ravaged the state, killed hundreds of people and swept away houses.
"We had issued warnings on June 14 and since then we have been regularly issuing advisories. The warnings were even published in newspapers and a press release was also issued," Uttarakhand MeT department Director Anand Sharma said.
A Congress leader on Sunday claimed there was "poor coordination" among the rescue teams in Uttarakhand. "There was poor coordination in the rescue operations. Authorities in one area did not know the progress of operations in other areas. I kept asking the state authorities including the Chief Minister for immediate air support. Speedy action by the state government would have been effective," Pradeep Tamta said.

KAKNADA -EAST GODAVARI JUNE 2013 METEROLOGICAL PARAMETERS

Condenser Life Cycle Seminar

$
0
0

Condenser Life Cycle Seminar

Summary


condenser drawingThe Condenser Life Cycle Seminar is the don’t miss event for 2013 for condenser related solutions and best-practices throughout the life cycle of your condenser.

Gain unfettered access to technical experts across a wide variety of fields with real-world answers to the toughest questions. You will leave this event better equipped to maintain optimal efficiency and availability for your condenser.

Join us on the campus of Georgia Tech in the heart of Atlanta for this educational event presented by condenser experts from respected companies throughout the country.

Topics Include:

  • Condenser Theory and Function 
  • Test Codes and Methods
  • Condenser Failures
  • Preventive and Predictive Maintenance
  • Tube Fouling and Corrosion Mitigation
  • Effective Tube Cleaning Methods
  • Non-Destructive Testing
  • Tube Failure Prevention
  • Condenser Leak Detection
  • Condenser Assessment
  • Thermal Performance
  • Protective Coatings
  • Retubing Activities
  • Defining a Specification for Retubing
  • Tube Material Selection
  • Anti-Vibration Technologies


Condenser Life Cycle Seminar Organizing Companies:

    retubeco-logo                           conco-logo                          plastocor-logo                   nalco-logo   


Utility Speakers Representing:


 socologo                                    tva-logo                                         luminant

Details

  • When

  • Monday, September 9, 2013 - Wednesday, September 11, 2013
    8:30 AM - 3:00 PM
    Eastern Time Zone
  • Where

  • Georgia Tech Hotel & Conference Center
    800 Spring St. NW
    Atlanta, Georgia 30308
    USA
    404-838-2100

NFCL CDR plant was placed in July 2007 with a completion schedule of 22 months (by May, 2009).

$
0
0

A milestone: K.S. Raju, Chairman and Managing Director of the Nagarjuna Fertilizers and Chemicals Limited, inaugurating the carbon dioxide recovery plant at the NFCL in Kakinada on Tuesday.
Kakinada: Nagarjuna Fertilizers and Chemicals Limited Chairman and Managing Director K.S. Raju commissioned a Carbon Dioxide Recovery (CDR) plant of 450 metric tons per day capacity for commercial use in the urea production facilities on Tuesday.
The order for CDR plant was placed with Mitsubishi Heavy Industries (MHI), Japan, and Tecnimont ICB (TICB), Mumbai on lump-sum turnkey basis.
The scope of MHI was for basic knowhow and licensing while TICB was vested with engineering, procurement and construction.
NFCL has two units for manufacturing urea with a capacity of six lakh metric tons per annum each. Unit-I is operated on natural gas and the other one is being operated mainly on naphtha because of the short supply of natural gas from Gas Authority of India Limited.
In anticipation of additional natural gas from Reliance Industries Limited from its KG basin reserves, the order of CDR plant was placed in July 2007 with a completion schedule of 22 months (by May, 2009).
But due to the intensive efforts of NFCL, TICB and MHI, the project could be completed two months in advance.
With the commissioning of this CDR plant, NFCL will be able to recover 450 MTPD of CO2 from the flue-gas stack thus helping the company to be eligible for carbon credits through Clean Development Mechanism.
While changing over the operations from naphtha to natural gas, there will be a shortage of carbon dioxide (CO2).
For making urea, ammonia and CO2 are required in a specific proportion which will be met by the new CDR plant. The energy norm will improve to 5.500 Gcal / MT of urea from the present level of 5.610 Gcal / MT of Urea.
Besides, production will increase from both units by about 2 lakh MT per annum.
NFCL COO and Director (Operations) R.S. Nanda, Vice-President R.D. Mall, Senior General Manager R Singh, TICB Managing Director Pietro Paolo Alessandrello and MHI Deputy General Manager Minami were among those present.

ECOLOGICAL ASSESSMENT OF LENTIC WATER BODIES OF BANGALORE T. V. Ramachandra and Malvikaa Solanki

$
0
0

ECOLOGICAL ASSESSMENT OF LENTIC WATER BODIES OF BANGALORE
T. V. Ramachandra    and    Malvikaa Solanki
AQUATIC ECOSYSTEM
Ecosystem is defined as ‘the complex of a community of organisms and its environmental functioning as an ecological unit’. It is a dynamic system where the biotic and abiotic components are constantly acting and reacting upon each other bringing forth structural and functional changes. An aquatic ecosystem is a group of interacting organisms dependent on one another and their water environment for nutrients (e.g., nitrogen and phosphorus) and shelter. An aquatic ecosystem is an ecosystem that is based in water, whether it is a pond, lake, river or an ocean. It involves living aquatic organisms (e.g.: fish, planktons, annelids, etc.), which constitute as the biotic factors and their relationship with their environment, which collectively can be referred to as the abiotic factor. Composing more than 70% of the earth’s surface, aquatic ecosystems are not only the dominant features of earth but are also very diverse in species and complexity of interaction among their physical, chemical and biological components.

Types of aquatic ecosystems
Aquatic ecosystems are broadly categorised based on the differences in their salt content as:
  • Freshwater ecosystems
  • Marine ecosystems (includes the ocean and the sea) and
  • Estuarine ecosystems (region where freshwater from a river mixes with the sea)
Familiar examples of Freshwater ecosystems include lakes, ponds, rivers, streams, and prairie potholes. They also include areas such as floodplains and wetlands, which are flooded with water for all or only parts of the year. Freshwater ecosystems are characterised as
  • Lotic (running waters) – streams, rivers, etc.
  • Lentic (still waters) – wetlands, ponds, tanks, lakes, etc.
The lotic ecosystems comprises of springs, rivulets, creeks, brooks, rivers, etc. which tread their course from being narrow, shallow and relatively rapid to increasingly broad, deep and slow moving. Waterfalls are common features of lotic ecosystems.  Lentic ecosystems generally include ponds, lakes, bogs, swamps, reservoirs, pools, etc. and they vary considerably in physical, chemical and biological characteristics.
Ponds are smaller bodies of still water located in natural hollows, such as limestone sinks, or that result from the building of dams, either by humans or beavers. Ponds are found in most regions and may exist either seasonally or persist from year to year.
Rivers and streams are bodies of fresh, flowing water. The water runs permanently or seasonally within a natural channel into another body of water such as a lake, sea, or ocean. Rivers and streams are generally more oxygenated than lakes or ponds, and they tend to contain organisms that are adapted to the swiftly moving waters 5.
A lake is a sizable waterbody surrounded by land and fed by rivers, springs, or local precipitation. A lake's structure has a significant impact on its biological, chemical, and physical features. Lakes can be classified on the basis of a variety of features, including their formation and their chemical or biological condition, as oligotrophic and eutrophic. Oligotrophic lakes are characterised by relatively low productivity and are dominated by cold-water bottom fishes such as lake trout. Eutrophic lakes, which are relatively shallower, are more productive and are dominated by warm-water fishes such as bass. Natural processes of lake formation most commonly include glacial, volcanic, and tectonic forces while human constructed lakes are created by reservoirs or excavation of basins.
Wetlands are habitats that are partially submerged by water and include habitats like marshes, swamps, ponds, etc. they also include lakes, reservoirs and ponds. They function as ecotones, transitions between different habitats and have characteristics of both aquatic and terrestrial ecosystems. These habitats support diverse flora and fauna and are highly productive ecosystems akin to the tropical rainforest in terrestrial ecosystems (Ramachandra T.V. Ahalya N., and Rajasekara Murthy C, 2005 6)

Watershed – Linking aquatic and terrestrial ecosystems
Aquatic ecosystems are not simply isolated bodies or conduits but are closely connected to terrestrial environments. Further, aquatic ecosystems are connected to each other and provide essential migration routes for species. Aquatic ecosystems require sediment loads, chemical and nutrient inputs from the adjoining terrestrial ecosystems for sustenance. Even isolated lakes are linked to the land and water around them through the flow of freshwater. Many of the problems faced by freshwater ecosystems come from outside the lakes, rivers, or wetlands themselves. Watershed is all the land and water area, which drains towards a river or a lake, river or a pond. A watershed is a catchment basin that is bound by topographic features, such as ridge tops and performs primary functions of the ecosystem (Ramachandra T.V. Ahalya N., and Rajasekara Murthy C, 2005 6). Thus, the watershed can constitute slopes, agricultural lands, forests, streams, waterbodies, buildings, etc.  People and animals are also a part of the watershed community and all depend on the watershed and they in turn influence what happens there. Accordingly, what happens in a small watershed also affects the larger watershed.  Soil, water and vegetation are the most vital natural resources for the survival of man and animals. To obtain the maximum and optimum production from all the resources, the three resources need to be managed efficiently. They need to be managed effectively, collectively and simultaneously, and all these can be conveniently and efficiently managed in a watershed.

Freshwater ecology
Aquatic ecosystems usually contain a wide variety of life forms including bacteria, fungi, and protozoan; bottom-dwelling organisms such as insect larvae, snails, and worms; free-floating microscopic plants and animals known as plankton; large plants such as, grasses and reeds; and also fish, amphibians, reptiles, and birds. Viruses are also a significant part of the microbial ecology in natural waters and have recently been shown to play an important role in the nutrient and energy cycles. Plants, animals and microbes interact with each other and their environment bringing about changes in the water quality with the performance of ecological services, such as decomposition and nutrient cycling.
The assemblages of these organisms vary from one ecosystem to another because the habitat conditions unique to each type of ecosystem tend to affect species distributions. Freshwater ecosystems like rivers are relatively oxygen-rich and fast flowing compared to lakes. The species adapted to these particular river conditions are rare or absent in the still waters of lakes and ponds.  Organisms capable of adhering to exposed surfaces are found in the upper reaches of streams. Such adhering organisms are termed periphyton. The periphyton includes attached clumped and filamentous green and blue green algae and various sessile invertebrates including larvae of insects like blackflies and other midges, mayfly and stonefly nymphs and planarians. Farther downstream floating and emergent vegetation may be found along with sessile invertebrates and those that burrow in the softer substrate, such as clams and burrowing mayfly nymphs. Chemically, the upper reaches of lotic environments are rich in oxygen; as the water moves downstream and becomes sluggish, the oxygen level tends to drop. Due to the continual addition of nutrients and detritus en route, nutrient levels tend to be higher downstream. In small streams in which producers are limited or absent, the major source of nutrients is from external ecosystems. Such materials are referred to as being allocthanous.
Lentic ecosystems (still waters) can be considered to have three zones – littoral, limnetic and benthic (figure 1.3). The littoral zone is the near shore area where sunlight penetrates all the way to the sediment and extends from the shoreline to the innermost rooted plants, successively passing form the rooted species with floating leaves, such as water lilies and deeper water to various submerged but rooted species. This zone is populated by frogs, snakes, snails, clams, and considerable variety of adult and larval insects. The limnetic (pelagic) zone is the open water down to the depth of light penetrations: in shallow lentic environments the light may penetrate to the bottom. This zone contains phytoplankton (diatoms, green and blue green algae, etc.), zooplankton (protozoa, microcrustaceans, arthropods, etc.). It is also inhabited by a variety of larger swimming organisms including fish, amphibians and larger insects. The benthic zone (the bottom of the lake) is covered by fine layers of mud consisting mostly of decomposers. Euphotic zone of the lake is the layer from the surface to the depth where light levels become too low for photosynthesis. In the littoral zone, there is enough light for rooted plants to grow, but beyond this zone, there are no rooted plants as the water is too deep for light to reach them. The deepest part of the open water forms the profoundal zone, but this is relevant only in extremely deep lakes. The profoundal zone occurs below the limnetic zone and this zone may constitute the largest water volume of a lake.  This zone is beyond the depth of effective light penetration.


Figure 1.3: Sketch showing major zones of lake
The major food source in the profoundal zone comes from a detritus rain form the limnetic and thus the photosynthetic zone.  A pond or a lake ecosystem is a dynamic ecosystem since the boundaries are limited. The water is retained in a trough and lined by terrestrial region. The entry nutrients, sediments through the surface runoffs enter and remain in the system causing fluctuations in the physico-chemical characteristics of these ecosystems. The organisms are subjected to pressure, changes in quality of water and are adapted to such changes. The primary producers like phytoplankton in the surface water perform photosynthesis and through the food chain and food webs transfer energy to higher trophic levels. The daily alteration of light and darkness forms a rhythm of activities of many aquatic organisms. The plants require light for the photosynthesis to prepare food from natural substance. The light penetration depends much on the turbidity of water caused by suspended particulate matter. The wind generates water currents, which in turn helps in nutrient movement and diffusion of gases. The distribution of oxygen in the dissolved form is essential to all aquatic life. Some organisms are lung breathers while others are gill breathers. The oxygen supply of lakes is reduced in various ways most significantly through respiration of organisms and decomposition of organic matter. In addition high temperatures also prevent the dissolution of atmospheric oxygen.

Freshwater organisms and food web
Freshwaterhabitats contain representatives of many groups of organism on earth. Archeae and bacteria are difficult to distinguish unless they can be brought into culture and metabolic characteristics can be used as taxonomic characteristics. Algae are the primary autotrophs in many aquatic ecosystems and are well represented in freshwaters. Protozoa are common in all freshwater habitats and can often be identified if a good microscope is available. All major phyla of invertebrates, with the exception of Echinodermata, (e.g. star fish) have some freshwater species. Invertebrates are the most fascinating and very important in the ecology of most aquatic habitats. Identification by non-taxonomists can be difficult at the species level, but numerous keys are available for coarser taxonomic resolution. Identification of Vertebrates is generally easier, because fewer and better-studied organisms are represented and many of these are assigned names. As with vertebrates many of the plants in aquatic systems have been well characterised. Aquatic plants are moderately diverse. Identification of the more obscure Mosses and liverworts is more difficult though.
Among the 'lower' (non-vascular) plants, the mosses and liverworts are virtually all terrestrial, although flourishing only in moist environments; but the larger algae are primarily aquatic. The larger algae comprise some 5,000 species in three major groups (the green, brown and red algae), the great majority of which are marine or brackish water forms ('seaweeds'). The green algae Chlorophyta includes one order of around 80 species (Ulotrichales) that is mainly freshwater. However, one major group sometimes associated with the green algae - the stonewort (Charophyta) – belongs almost entirely to freshwater. The stonewort includes 440 species, most of which are endemic at continental level or below; they tend to be very sensitive to nutrient enrichment and have declined in many areas.
Animal species are considerably more diverse and numerous in inland waters than plants. Most of the major groups include terrestrial or marine species as well as freshwater forms. Apart from fishes, important groups with inland water species include crustacea (crabs, crayfishes and many smaller organisms), mollusca (including mussels and snails), insects (including stoneflies Plecoptera, caddisflies Trichoptera, mayflies Ephemoptera), sponges, flatworms, polychaete worms, oligochaete worms, numerous parasitic species in various groups, and numerous microscopic forms.


Figure 1.4: A simple aquatic food chain
The sun provides the ultimate source of energy in all natural systems. If we look at a simple food chain in a freshwater ecosystem (figure 1.4), it may comprise of the primary producers phytoplankton, wherein they fix sunlight and convert the light energy to chemical energy. They form the base of the food chain, and are eaten by the zooplankton and planktivorous fishes, which make up the primary and secondary consumers in the aquatic food chain. Other small fishes in turn eat the zooplankton. Other larger fishes, birds, etc form the upper trophic levels. When plants or animals die, the chemicals that make up their bodies are broken down and released back into the system as nutrients by the decomposers. The major decomposers are bacteria and fungi, which make up the last trophic level in the food chain.
Phytoplankton comprises of aquatic microscopic plants suspended in water - many species of prokaryotic (blue green alga) and eukaryotic algae. Zooplankton comprises of small (often microscopic) aquatic animals, and non-photosynthetic protists suspended or weaklyswimming in water, which feed on the phytoplankton. E.g., protozoa, bacteria, small crustaceans, rotifers, micro invertebrates and fish larvae, etc. Some species from most major groups of aquatic animals can eat phytoplankton, periphyton, macrophytes, detritus or other animals. Omnivory is common in freshwater invertebrates with many organisms representing various trophic levels.

Table 1. 2: The major groups of organisms in freshwater (UNEP)
Organisms General featuresSignificance in freshwaters
VirusesMicroscopic; can reproduce only within the cells of other organisms, but can disperse and persist without host.Causes diseases in many aquatic organisms, and associated with water-borne diseases in humans (eg. hepatitis).
BacteriaMicroscopic; can be numerically very abundant, eg. 1,000,000 per cm3, but less so than in soils. Recycles organic and inorganic substances. Mostly derives energy from inorganic chemical sources, or from organic materials.Responsible for the decay of dead material. Present on all submerged detritus where a food source for aquatic invertebrates. Many cause diseases in aquatic organisms and humans.
FungiMicroscopic. Recycles organic substances; responsible for decay of dead material; tends to follow bacteria in the decomposition processes. Able to break down cellulose in plant cell walls and chitinous insect exoskeletons.Present on all submerged detritus where it is a food source for aquatic invertebrates. Some cause diseases in aquatic organisms and humans.
AlgaeMicroscopic and macroscopic; includes a variety of unicellular and colonial photosynthetic organisms. All lack leaves and vascular tissues of higher plants. Green Algae (Chlorophyta) and Red Algae (Rhodophyta) include freshwater species; Stoneworts (Charophyta) mostly freshwater.Responsible for most primary production (growth in biomass) in most aquatic ecosystems. Free-floating phytoplankton main producers in lakes and slow reaches of rivers; attached forms important in shallow parts of lakes and streams.
PlantsPhotosynthetic organisms; mostly higher plants that possess leaves and vascular tissues. Some free-floating surface species; mostly rooted forms are restricted to water margins. Provide a substrate for other organisms and food for many. Trees are ecologically important in providing shade and organic debris (leaves, fruit), structural elements (fallen trunks and branches) that enhance vertebrate diversity, in promoting bank stabilisation, and in restricting or modulating floodwaters.
Invertebrates: protozoanMicroscopic mobile single-celled organisms. Tend to be widely distributed through passive dispersal of resting stages. Attached and free-living forms; many are filter feeders.Found in virtually all freshwater habitats. Most abundant in waters rich in organic matter, bacteria or algae. Feed on detritus, or consume other microscopic organisms; many are parasitic on algae, invertebrates or vertebrates.
Invertebrates: rotifersNear-microscopic organisms; widely distributed; mostly attached filter feeders, some predatory forms. Important in plankton communities in lakes and may dominate animal plankton in rivers.
Invertebrates: myxozoansMicroscopic organisms with complex life cycles, some with macroscopic cysts. Formerly classified with protozoa but are metazoa.Important parasites in or on fishes.
Invertebrates: flatwormsA large group of worm- or ribbon like flatworms; includes free-living benthic (Turbellaria), and parasitic forms (Trematoda, Cestoda).Turbellaria include mobile bottom-living predatory flatworms. The Trematodes includes various flukes, such as the tropical schistosome that causes bilharzia; Cestodes are tapeworms: both these groups are important parasites of fishes and other vertebrates including humans. Molluscs are often intermediate hosts.
Invertebrates: nematodesGenerally microscopic or near-microscopic roundworms.May be parasitic, herbivorous or predatory. Typically inhabit bottom sediments. Some parasitic forms can reach considerable size. Poorly known; may be more diverse than recognised.
Invertebrates: annelid wormsTwo main groups in freshwaters; oligochaetes and leeches.Oligochaetes are bottom-living worms that graze on sediments; leeches are mainly parasitic on vertebrate animals, some are predatory.
Invertebrates: molluscsTwo main groups in freshwaters; Bivalvia (mussels, etc) and Gastropoda (snails, etc). Very rich in species; tend to form local endemic species.Snails are mobile grazers or predators; bivalves are attached bottom-living filter-feeders. Both groups have specialised profusely in certain freshwater systems. The larvae of many bivalves are parasitic on fishes. Due to its feeding mode, bivalves can help maintain water quality but tend to be susceptible to pollution.
Invertebrates: crustaceansA very large class of animals with a jointed exoskeleton often hardened with calcium carbonate.Include larger bottom-living species such as shrimps, crayfish and crabs of lake margins, streams, alluvial forests and estuaries. Also, larger plankton: filter-feeding Cladocera and filter-feeding or predatory Copepoda. Many isopods and copepods are important fish parasites.
Invertebrates: insectsBy far the largest class of organisms known. Jointed exoskeleton. The great majority of insects are terrestrial, because they breathe air.In rivers and streams, grazing and predatory aquatic insects (especially larval stages of flying adults) dominate intermediate levels in food webs (between the microscopic producers, mainly algae, and fishes). Also important in lake communities. Fly larvae are numerically dominant in some situations (eg. in Arctic streams or low-oxygen lake beds), and are vectors of human diseases (eg. malaria, river blindness).
Vertebrates: fishesMore than half of all vertebrate species are fishes. These are comprised of four main groups: hagfishes (marine), lampreys (freshwater or ascend rivers to spawn), sharks and rays (almost entirely marine), and ray-finned 'typical' fishes (>8,500 species in freshwaters, or 40% of all fishes).Fishes are the dominant organisms in terms of biomass, feeding ecology and significance to humans, in virtually all aquatic habitats including freshwaters. Certain water systems, particularly in the tropics, there  is a good number of species. Many species are restricted to a few lakes or river basins. They are the basis of important fisheries in inland waters in tropical and temperate zones.
Vertebrates: amphibiansFrogs, toads, newts, salamanders, caecilians. Require freshwater habitats. Larvae of most species need water for development. Some frogs, salamanders and caecilians are entirely aquatic; generally in streams, small rivers and pools. Larvae are typically herbivorous grazers, adults are predatory.
Vertebrates: reptilesTurtles, crocodiles, lizards, snakes. All crocodilians and many turtles inhabit freshwaters but nest on land. Many lizards and snakes occur along water margins; a few snakes are highly aquatic.Because of their large size, crocodiles can play an important role in aquatic systems, by nutrient enrichment and shaping habitat structure. They, as well as freshwater turtles and snakes are all predators or scavengers.
Vertebrates: birdsMany birds, including waders and herons, are closely associated with wetlands and water margins. Relatively few, including divers, grebes and ducks, are restricted to river and lake systems.Top predators. Wetlands are often key feeding and staging areas for migratory species. Likely to assist passive dispersal of small aquatic organisms.
Vertebrates: mammalsRelatively few groups are strictly aquatic (eg. River Dolphins, platypus), several species are largely aquatic but emerge onto water margins (eg. otters, desmans, otter shrews, water voles, water oppossum, hippopotamus). Top predators and grazers. Large species widely impacted by habitat modification and hunting. Through damming activities, beavers play an important role in shaping and creating aquatic habitats.
Causes and effects of pollution on aquatic ecosystems
When pollutants enter lakes, streams, rivers, oceans, and other waterbodies, they get dissolved or lie suspended in water or get deposited on the bed. The system is able to withstand the pollutants up to a certain threshold, beyond which the quality of the water deteriorates, affecting aquatic ecosystems. The most common problems associated with various pollutants are discussed below.
  • Oxygen demanding wastes are substances that oxidise in the receiving body of water, reducing the amount of dissolved oxygen (DO) available. As DO drops, fish and other aquatic life are threatened and, in the extreme case, get killed. In addition  to the fall in DO levels, undesirable odours, tastes, and colours reduce the acceptability of the water as a domestic supply and its attractiveness for recreational purposes. Oxygen demanding wastes are usually biodegradable organic substances contained in municipal wastewaters or in effluents from industries such as food processing and paper production.
  • Contaminated water is responsible for the spread of many contagious diseases. Pathogens associated with water include bacteria responsible for cholera, dysentery, typhoid, etc., viruses cause hepatitis and poliomyelitis, protozoa are responsible for amoebic dysentery and giardiasis, and helminthes or parasitic worms cause diseases like schistosomiasis, etc.
  • Nutrients, when present in concentrations that can stimulate the growth of algae can be considered pollutants. The discharge of waste from industries, agriculture, and urban communities into waterbodies generally stretches the biological capacities of aquatic systems. Chemical run-off from fields also adds nutrients to water. Excess nutrients cause the waterbody to become choked with organic substances and organisms. When organic matter exceeds the capacity of the microorganisms in water that break down and recycle the organic matter, it encourages rapid growth, or blooms of algae. When they die, the remains of the algae add to the organic wastes already in the water; eventually, the water becomes deficient in oxygen. Anaerobic organisms (those that do not require oxygen to live) then attack the organic wastes, releasing gases such as methane and hydrogen sulphide, which are harmful to the oxygen requiring (aerobic) forms of life. The result is a foul-smelling, waste-filled body of water. This artificial supplementation of nutrients, and consequent abnormal increase in the growth of water plants is often referred to as eutrophication. This is a growing problem in freshwater lakes all over India. Eutrophication can produce problems such as bad tastes and odours as well as green scum algae. Also, the growth of rooted plants increases, which decreases the amount of oxygen in the deepest waters of the lake. It also leads to the death of all forms of life in the waterbodies.
  • Organic inputs from the food industry, i.e., carbohydrates, lipids, and proteins, all impact lakes and rivers by increasing the biological oxygen demand. The worst-case scenario is the total loss of oxygen from the water as a result of microbial activity. Lipids create the greatest oxygen demand but carbohydrates (more easily biodegradable) also result in unsightly ‘sewage fungus’. Protein waste can be degraded to produce ammonia and sulphide, both of which produce toxicity problems (Gwynfryn Jones J, 2001 10).
  • Acid precipitation is caused mainly by humans burning fossil fuels, which leads to increased sulphuric, and nitric acid in the atmosphere. Acidification of aquatic ecosystems impacts all aquatic organisms. Acid rain has major effects on biological systems ranging from altered microbial activity to the ability of fish to survive and reproduce. (Table 1.3).

Table 1.3: Influences of decreasing pH on several groups of aquatic organisms (Modified fromJeffries M., and Mills D, 1990 11)
Organism of processApproximate pH value
Most mayflies disappear6.5
Phytoplankton species decline/green filamentous periphyton dominate6
Most molluscs disappear5.5 – 6
Waterfowl breeding declines 5.5
Bacterial decomposition slows/fungal decomposition predominates5
Salmonoid reproduction fails/aluminium toxicity increases5
Most amphibians disappear5
Caddisflies, stoneflies, and megaloptera disappear4.5 – 5
Beetles, bugs, dragonflies, and damselflies disappear4.5
Most adult fish harmed4.5
Metals and other inorganic pollutants act as toxic pollutants in aquatic ecosystems. Metals can bioaccumulate in many organisms and can be bioconcentrated in trophic food chains. Bioconcentration has led to problems such as excessive lead and mercury contamination in fish. Atmospheric deposition and industrial waste releases, particularly mining are common sources of metallic contamination. Such mining activities have had extensive negative impacts in aquatic habitats. The inorganic inputs, particularly of phosphorus, stimulate undesirable algal growths, some of which may produce particularly dangerous toxins. Arsenic can cause problems because it can be present in high concentrations naturally or as runoff form industrial uses. Historically arsenic was also used as pesticide and subsequently contaminated aquatic ecosystems. In a particularly terrible case, thousands of drinking water wells in West Bengal, India, are contaminated by naturally occurring arsenic. Radioactive compounds can be contaminants in water. They usually occur naturally in water. The primary contaminants are isotopes of radium, radon, and uranium. The effects of natural radioactive materials on aquatic habitats are difficult to gauge.
More than 10,000 organic pollutants have been created and used by man. Several hundred new chemicals are created each year and discharged by humans into the aquatic habitats, including pesticides, oil, and materials in urban runoff. Only a few of them have been tested for toxicity. In some cases microbes can break down these compounds through bioremediation in a given time. The effects of unregulated release of pollutants into large ecosystems are exemplified by the experiences in the Great Lakes of North America. Worldwide, where, about 2.3 million metric tons of pesticides are used yearly. (Walter K. Dodds, 2002 12).
Petroleum products are another source of aquatic contamination. Urban runoff is a significant source of oil contamination. Chlorinated hydrocarbons such as poly-chlorinated biphenyl (PCBs) have carcinogenic properties. In addition to this many sewage treatment plants treat their final effluents with chlorine to kill all pathogens and this forms chlorinated hydrocarbons. Bioremediation is one possible way of cleaning up the spills of organic materials. (Walter K. Dodds, 2002 12).
Turbidity and suspended solids are natural parts of all freshwater environments. Some are naturally highly turbid but human activities have increased the levels of suspended solids in many habitats. Agricultural and urban runoff, watershed disturbance such as logging, construction of roads, etc., removal of riparian vegetation, alteration of hydrodynamic regimes can all lead to anthropogenically attributed increment in the total suspended solids. Sediments can have different biological and physical effects depending on the type of suspended solids. High values of suspended solids can lower the primary productivity of systems by covering  the algae and macrophytes, at times leading to almost their complete removal (Walter K. Dodds, 2002 12)
Thermal pollution can cause shifts in the community structure of aquatic organisms. This may allow for the establishment of exotic species and local extinction of native species.  As water temperature increases, it makes it more difficult for aquatic life to get sufficient oxygen to meet its needs.
Aquatic systems respond on a much shorter time scale than their terrestrial counterparts. For example, species invasions take 10 to 1000 years in terrestrial systems but only a few weeks to a few months in aquatic systems. Similarly, population changes can take 10 to millions of years on land but can occur within a few months to a few years in water. Therefore, any pressure placed on a freshwater system can result in a very rapid and deleterious response. The driving forces involved (some of which are under man’s control) can be divided into the physical and the chemical, but the response is, almost entirely, biological (Gwynfryn Jones J, 2001 10).
Human encroachment on aquatic ecosystems is increasing at an unprecedented rate. The impacts of human pollution and habitat alteration are most evident and of greatest concern at the microbial level, where a bulk of the production and nutrient cycling takes place. Aquatic ecosystems are additionally affected by natural perturbations, including droughts, storms, and floods, where its frequency and extent may be increasing.
More than 70% of the world’s human population live in watersheds that drain to the coast (Vitousek P.M et al, 1997 13 ). Further population growth will be centred in these regions, exerting unprecedented pressure on riverine, estuarine and coastal habitats receiving human pollutants (Vitousek P.M et al, 199713, Peierls B.L et al, 1991 14). Multiple negative ecological impacts on these fragile habitats (i.e., loss of biodiversity, increasing frequencies of harmful algal blooms, hypoxia, disease and declines in fisheries) have been documented (Jørgensen B.B and Richardson K. 1996 15, Nixon S.W, 1995 16, Paerl H.W, 1997 17, Conley D.J, 2000 18). Most evident are water quality and habitat changes attributable to nutrient over-enrichment, leading to excessive primary production or eutrophication (Jørgensen, B.B and Richardson, K. 1996, Nixon S.W, 1995, Paerl H.W, 1997 15, 16, 17). Eutrophication has caused significant changes in coastal nutrient (C, N, P, Si) cycling, water quality, biodiversity, fisheries, and the overall ecosystem health (Jørgensen, B.B and Richardson, K. 1996, Nixon S.W, 1995, Paerl H.W, 1997, Conley D.J, 2000, Diaz, R.J. and Solow, A., 1999 15, 16, 17, 18, 19).
Natural perturbations such as droughts, storms and floods additionally impact aquatic ecosystems. Like human disturbances, these events are predicted to increase in the foreseeable future (Goldenberg S.B et al, 2001 20). Among aquatic biota, microorganisms are generally highly sensitive to and profoundly affected by environmental perturbations. Microbes comprise the majority of aquatic biomass and are responsible for the bulk of productivity and nutrient cycling in aquatic systems. They have fast growth rates, and respond to low levels of pollutants as well as other physical, chemical, and biotic environmental changes. From detection and effect perspectives, they provide sensitive, meaningful, and quantifiable indications of ecological change.
Viewing all 8077 articles
Browse latest View live