Quantcast
Channel: EHSQL(Environment-Energy ,Health,Safety, Security and Social Ac. ,Quality-Lab) Technical services
Viewing all 8156 articles
Browse latest View live

Weather Report and Forecast For: Kakinada Dated :May 12, 2015

$
0
0

Local Weather Report and Forecast For: Kakinada    Dated :May 12, 2015
Kakinada
Past 24 Hours Weather Data
Maximum Temp(oC)37.4
Departure from Normal(oC)0
Minimum Temp (oC)27.8
Departure from Normal(oC)1
24 Hours Rainfall (mm)NIL
Todays Sunset (IST)18:24
Tommorows Sunrise (IST)05:31
Moonset (IST)12:46
Moonrise (IST)00:43

Today's Forecast:Sky condition would be generally cloudy. Rain or Thundershowers may occur in parts of city. Maximum & Minimum temperatures would be around 38 and 27 degrees Celsius respectively.

Date Temperature ( o C ) Weather Forecast
Minimum Maximum
13-May 27.0 38.0 Partly cloudy sky with possibility of rain or Thunderstorm
14-May 27.0 38.0 Partly cloudy sky with possibility of rain or Thunderstorm
15-May 27.0 37.0 Partly cloudy sky with Thundery development
16-May 28.0 37.0 Partly cloudy sky with Thundery development
17-May 28.0 38.0 Partly cloudy sky
18-May 28.0 38.0 Partly cloudy sky


ActualAverage Record
Temperature 
Mean Temperature32 °C -  
Max Temperature37 °C - - ()
Min Temperature27 °C - - ()
Cooling Degree Days26  
Growing Degree Days40 (Base 50)  
Moisture 
Dew Point25 °C  
Average Humidity63  
Maximum Humidity79  
Minimum Humidity45  
Precipitation 
Precipitation0.0 mm - - ()
Sea Level Pressure 
Sea Level Pressure1007.63 hPa  
Wind 
Wind Speed1 km/h ()  
Max Wind Speed6 km/h  
Max Gust Speed -   
Visibility7.0 kilometers  
Events    
T = Trace of Precipitation, MM = Missing ValueSource: Averaged Metar Reports

Daily Weather History Graph

Daily Weather History Graph


 MaxAvgMinSum
Temperature 
Max Temperature38 °C36 °C29 °C
Mean Temperature33 °C32 °C29 °C
Min Temperature29 °C27 °C25 °C
Degree Days 
Heating Degree Days (base 65)0000
Cooling Degree Days (base 65)272520323
Growing Degree Days (base 50)423935512
Dew Point 
Dew Point28 °C26 °C22 °C
Precipitation 
Precipitation0.0 mm0.0 mm0.0 mm0.00 mm
Snowdepth - - - -
Wind 
Wind11 km/h1 km/h0 km/h
Gust Wind - - -
Sea Level Pressure 
Sea Level Pressure1011 hPa1008 hPa1005 hPa

Monthly Weather History Graph

Monthly Weather History Graph


Approval to comprehensive New Urea Policy 2015

$
0
0
Ministry of Chemicals and Fertilizers13-May, 2015 16:10 IST
Approval to comprehensive New Urea Policy 2015

Nutrient Based Subsidy rates for Phosphatic and Potassic fertilizers for the year 2015-16

The Union Cabinet chaired by the Prime Minister, Shri Narendra Modi, today gave its approval to a comprehensive New Urea Policy 2015 for the next four financial years. The Policy has multiple objectives of maximizing indigenous urea production and promoting energy efficiency in urea units to reduce the subsidy burden on the Government. Savings in energy shall reduce the carbon-footprint and would thus be more environment friendly. It will enable the domestic urea sector having 30 urea producing units, to become more energy efficient, would rationalize the subsidy burden and incentivize urea units to maximize their production at the same time. The policy will ensure timely supply of urea to farmers at same Maximum Retail Price (MRP) with lesser financial burden on the exchequer. It will also reduce import dependency in the urea sector.

Urea units would adopt best available technology in the world and will become globally more competitive. The Policy will result in direct saving of subsidy of around Rs. 2618 crore and indirect saving of Rs. 2211 crore (total savings will be Rs.4829 crore) on account of revised specific energy consumption norms and import substitution respectively during the next four years. It is expected to result in additional production of around 20 lakh/MT annually.

Farmers, the urea industry and Government of India would benefit from the New Urea Policy.

Earlier the Government had approved gas pooling policy under which all urea units would get gas at a uniform price.

Government had also already decided in January to allow urea producers to produce neem coated urea upto 100 percent of production and making it mandatory to produce a minimum of 75 percent of domestic urea as neem coated, so that farmers are benefitted. Neem coated urea is required less in quantity with same plot size and gives higher crop yields. Underground water contamination due to leaching of urea also gets reduced with neem coating since nitrogen in the neem coated urea gets released to plants very slowly. Neem coated urea is not fit for industrial use, so chances of its illegal diversion to industries will also be lesser.

The MRP of urea for the farmers has been kept the same at Rs. 268/- per bag of 50 kgs. excluding local taxes. Farmers have to pay an additional price of only Rs.14/- per bag of neem coated urea.

The movement plan for urea would continue to be given by the Government every month to urea suppliers, to ensure its timely and adequate availability, in all parts of the country.

Earlier the Government had also decided to revive closed urea units at Gorakhpur in Uttar Pradesh and Barauni in Bihar to produce and additional 26 lakh tonnes. Joint venture agreements among various stakeholders were signed in December, 2014 and January, 2015 for revival of the closed Talcher urea unit in Odisha and Ramagundam in Telangana. These two units shall also increase domestic production of urea by 26 lakh tonnes.

By all these measures, import dependency of India for urea is likely to reduce drastically. Presently, India is importing about 80 lakh metric tonnes of urea out of total demand of 310 lakh metric tonnes.

Government today also decided to continue the existing subsidy rates for Phosphatic and Potassic (P&K) fertilizers (22 grades including DAP, Single Super Phosphate (SSP), Muriate of Potash (MOP), etc.) under the Nutrient Based Subsidy (NBS) policy for the current year. Subsidy rate for DAP remains same at Rs 12350/- per metric tonne while it is Rs 9300/- for MOP. Separate subsidy for boron and zinc coated fertilizers has also been continued.

Movement plan for P&K fertilizers has also been freed to reduce monopoly of few companies in a particular area so that any company can sell any P&K fertilizer in any part of the country. Rail freight subsidy has been decided to be given on a lump sum basis so that the companies economise on transport. This will help farmers and reduce pressure on the railway network. The Government continues to have legal tools to direct fertilizer suppliers to supply fertilizers in any part of the country where there would be any shortage.

There are 19 units producing phosphatic fertilizers and 103 units making SSP. The entire requirement (approximately 30 lakh Metric Tonnes) of MOP is met from imports, since there is no resource of potash in India. About 90 percent of the phosphates are imported.

Subsidy would be payable to suppliers only after fertilizers are received in the districts and final settlement of subsidy claims will continue to be done only after acknowledgement of receipt of fertilizers by retailers. Quality certificates are to be given by the respective State Governments within six months from the receipt of fertilizers. If quality is sub-standard, subsidy will not be given to fertilizer suppliers.

 http://pib.nic.in/newsite/erelease.aspx

Progress of Kakinada-Vijayawada Gas Pipeline

$
0
0
Progress of Kakinada-Vijayawada Gas Pipeline
The Minister of State (I/C) for Petroleum & Natural Gas Shri Dharmendra Pradhan informed the Rajya Sabha in a written reply today that GAIL is not laying any pipeline from Kakinada to Vijaywada. However, GAIL is executing Lingala-Kaikaluru pipeline which would interconnect the Lingala-Kaikaluru isolated gas field grid with KG basin pipeline network.

The project work relating to laying of 42 km pipeline has been completed except for two railway crossings, stretch of 345 metres of pipeline laying and few Station Works. The work could not be completed due to contractual issues and resistance on Right of Use (RoU). The Ministry reviews the projects periodically and, in the last review, GAIL has been advised to expeditiously complete the project for ensuring gas pipeline connectivity to the targeted customers.

Demand of Natural Gas

$
0
0
Demand of Natural Gas
             The Minister of State (I/C) for Petroleum & Natural Gas Shri Dharmendra Pradhan informed the Rajya Sabha in a written reply today that the details of natural gas production during 2014-15 to 2017-18 are as under:
Year
Natural gas production (in mmscmd) *
2014-15 (Actual)
90.993
2015-16 (Projected)
97.43
2016-17 (Projected)
106.33
2017-18 (Projected)
138.33

* The availability of natural gas varies depending upon internal consumption and technical flaring of natural gas.
Presently, the normative requirement of gas for power sector at 70/75 % PLF is around 81.5 mmscmd and after commissioning of 5449 MW of gas based power generation capacity, the normative requirement of gas would be around 102.90 mmscmd.

The current requirement of natural gas for fertilizer sector is 49.321 mmscmd which would increase by 14.4 mmscmd by the end of 2017-18.

The cost of production of natural gas varies  from company to company and field to field depending upon size/type of the reservoir, location of reservoir, operating cost, financing cost, depreciation, depletion and amortization applicable and accounting procedure followed by various E&P companies as well as taxes and duties levied by the Government. The price of domestic natural gas is determined in accordance with the New Domestic Natural Gas Pricing Guidelines, 2014. Save as otherwise provided in the above guidelines, the base price of domestic natural gas supplied from a particular source is same for all consumers irrespective of their location, except for North East Region where the rate is 60% of the notified rate for certain allocations. However, the delivered price of the domestic natural gas may change from State-to-State depending upon transportation charges, State and Local Taxes and levies etc.
Government has taken several steps to improve the availability of gas which, inter-alia, include,  intensification of domestic exploration and production activities through New Exploration Licensing Policy (NELP) rounds, development of shale gas policy framework, research and development of gas hydrate resources in the country, import of Liquefied Natural Gas (LNG), exploring possibility of transnational gas pipelines, clearance for exploration and development of some NELP blocks, exploration in the Mining Lease Area with certain conditions and acquisition of overseas oil and gas assets.
MJPS/Rk

(Release ID :121648)

Enhanced Cooling Tower Maintenance Saves Water

$
0
0

Enhanced Cooling Tower Maintenance Saves Water

1008-enhanced1Any amount of wasted water is too much. Perhaps it’s time to compare your maintenance procedures to current best practices. Do they measure up?

Water is an undervalued utility. Since many consumers essentially view it as a “free” resource, many plants make little effort to conserve water the same way they try to conserve fuels and electricity. While countless opportunities to conserve Btus and kilowatts have been explored over the past 30 years, less attention has been paid to reducing water consumption. But things are changing…
Severe droughts, like those seen in the Southeast and Southwest, combined with rapid population and industrial growth in those and other water-stressed regions, have created a water crisis in many parts of the United States. The available supply of fresh water is decreasing as residential customers compete with industry for available water supplies. (Witness the lawn sprinkling and car washing bans in many communities. Agriculture, the largest consumer of water, increasingly relies on irrigation to offset drought conditions that limit yields. Residential customers accuse farmers of drawing down the water table and causing local shortages. Meanwhile, government regulatory agencies are hesitant to wade in to restrict water withdrawal rates or raise usage fees force conservation, since most consumers view the plentiful supply of safe, clean water as an inalienable right.
The conflict is intensifying. What’s worse, scientific and government forecasters predict no relief is in sight over the next decade. Blame it on global warming or not, the need to conserve water is here to stay.
On the bright side, most plants already have a water conservation program under way. It’s called a cooling tower. As shown in Fig. 1, cooling towers conserve water by recycling it through equipment such as mechanical chillers, turbine condensers, air compressors, oil coolers and process heat exchangers. In the process, unwanted heat is removed and then rejected to the atmosphere by evaporative and convective cooling.
1008-enhanced2
It is estimated that over 1,000,000 cooling towers—that’s one million—are in service. They are used in every conceivable application where water conservation is a concern, including electric utilities, oil refineries, steel mills, manufacturing facilities, pharmaceutical plants, food processing operations, hospitals, universities, commercial buildings and many more.
Interestingly, plant maintenance teams play a critical role in keeping their cooling towers operating at peak efficiency. They focus on keeping plant equipment clean by preventing mineral scale deposits, mitigating corrosion, limiting bacteria growth, and controlling fouling. Because of the growing importance of water conservation, however, best maintenance practices have been updated to cover the operation of cooling towers in a way that reduces fresh water withdrawal rates and produces less wastewater. That means if you are still maintaining your cooling tower the same way you did five years ago, it’s time to upgrade to the newer water conservation format.
Cooling tower basics Cooling towers work by evaporative and convective heat transfer. As water flows over the tower, some of it (about 0.1% of the flow) is evaporated to the atmosphere. About 1000 Btus of heat is removed for every one pound of water evaporated. Removing this heat from the bulk of the cooling water decreases the temperature by 10 to 15 degrees. On average, 75% of the heat rejected at the tower is by the evaporative cooling process; 25% of the cooling occurs due to the direct contact of cooler air with the warmer water. This varies, of course, based on weather conditions. If the air temperature is warmer than the water temperature, for example, all of the cooling takes place by the evaporative process. When the air is colder, such as during the winter, more heat is removed by convective heat transfer.
The water that is evaporated from the tower is pure—that is, it doesn’t contain any of the dissolved minerals present in the raw water supply. As the evaporation process continues, these minerals concentrate in the cooling water. If this is allowed to continue without limit, the dissolved minerals soon concentrate to a point where they can no longer remain in solution. Here the less-soluble minerals such as calcium and magnesium precipitate to form an insoluble sludge, or an adherent, dense scale in the tower basin or within plant equipment. For these reasons, cooling towers must be operated to keep the dissolved minerals soluble. This is accomplished by bleeding a small amount of tower water to drain while replacing the water lost by evaporation and bleed with fresh makeup. The ratio between the dissolved solids in the cooling water and the dissolved solids in the makeup is called the “concentration ratio,” “cycles of concentration” or, more simply, “cycles.” This is an indication of how efficiently the cooling tower is recycling water. A simple way to measure cycles is by calculating the ratio of the specific conductance of the cooling water to the specifi c conductance of the makeup. Alternatively, if the cooling tower has a water meter on the makeup and bleed lines, you can estimate cycles by computing the ratio between the gallons makeup to the gallons bleed. The cycles determined by either method should be in fairly good agreement assuming there are no uncontrolled water losses due to leaks or an overflow condition.
Establishing the proper operating limit for cycles is one of the supercritical decisions one faces in cooling tower maintenance. Towers that operate at high cycles use less water and produce less waste than towers that operate at lower cycles. The maximum permissible cycles of concentration are limited by the makeup water quality, bleed rate and uncontrolled water losses. Set the cycles too high and you risk running the tower under scale-forming conditions. Set it too low and you waste water, chemicals and energy.
1008-enhanced3
Makeup water quality is key The quality of the cooling tower makeup determines the maximum cycles of concentration. Since calcium and magnesium are the primary scale-forming impurities, tower operation is confined to keeping the cycles below the solubility limit of calcium carbonate. This requires a proper balance to be maintained between the calcium hardness, total alkalinity, total dissolved solids and pH in the recirculated cooling water. Since these variables differ from one water supply to another, the limitation on cycles also varies. As a general rule of thumb, the calcium hardness is limited to 350 to 450 ppm in most cooling towers. Other limiting factors—such as silica, phosphate and process contaminates—need to be considered as well.
Generally, cooling towers use potable water as their makeup supply. This is a good choice when a plentiful supply of fresh water is available. But, as competition for clean, fresh water heats up, plants are increasingly forced to use alternative sources. Reclaimed water from municipal or industrial wastewater treatment plants is often an alternative source for cooling tower makeup. Although this reduces fresh water withdrawal rates, some pre-treatment of the wastewater may be required to make it suitable for use in the cooling tower. In many cases, regeneration by simple filtration may be all that is necessary to reuse wastewater as cooling tower makeup. Reverse osmosis (RO) continues to gain favor as a method for pre-treating makeup for steam boilers. The RO process produces a continuous supply of softened and dealkalized water for this application. The downside of RO is that it produces a continuous waste stream that is sent to drain—25% of the feedwater to the RO is lost to drain, while 75% is recovered for use as boiler makeup. In many cases, the RO reject is perfectly acceptable for use as cooling tower makeup. Although dissolved solids in the RO reject are about four times that of the RO feedwater, if the water is softened ahead of the RO to remove calcium and magnesium, it is of acceptable quality for reuse in this manner.
If the plant does not produce enough recycled wastewater to meet the cooling tower demand, the wastewater may be combined with fresh water to produce a suitable blend. Using an alternative water supply in this way reduces fresh water consumption and wastewater generation.
Maximize cycles to reduce water consumption Obtaining maximum performance from a cooling tower requires it to be operated at the maximum permissible cycles of concentration. Since the concentration ratio is determined by the ratio between makeup and bleed (C=MU/B), reducing the bleed increases the cycles, and conversely, increasing the bleed decreases the cycles. As shown in the Fig. 2 of bleed versus cycles, a point of diminishing returns is soon reached at about 10 cycles of concentration. From a practical view, it is difficult to operate a tower at more than 10 cycles because of leaks, windage and other uncontrolled water losses that contribute to the “bleed” and thereby limit cycles. If 10 cycles of concentration is taken as our target, then cooling towers that operate at less than 10 cycles can be considered as less than 100% efficient as determined by freshwater consumption and wastewater generation.
Table I reflects measures of tower efficiency as determined by the cycles of concentration, if we assume 10 cycles represents a practical 100% water efficiency rating. This table suggests that cooling towers that use freshwater makeup and operate at less than four cycles are not achieving their full potential. This condition wastes water, consumes excess chemicals and produces more wastewater. Towers that operate at five to eight cycles are acceptable for most applications, although large systems can save significant volumes of freshwater by reaching eight cycles. Towers that are maintained at nine to 10 cycles are operating at peak efficiency in terms of water consumption, chemical usage and energy demand.
1008-enhanced4
Strategies to achieve cycles goal If the cooling tower is on the low end of the efficiency scale, several maintenance strategies are available to increase cycles, including pH adjustment and softening the makeup.
The standard method for increasing cycles on high hardness, high-alkalinity makeup is to use a strong mineral acid—such as sulfuric or hydrochloric—to reduce alkalinity and control pH. Calcium carbonate scale forms as a result of the chemical reaction between calcium hardness and carbonate alkalinity. By neutralizing the alkalinity with acid, the chemical reaction leading to calcium carbonate is stopped. Enough acid is injected into the tower makeup to reduce the total alkalinity to 50 to 100 ppm and maintain the pH of the cooling water within the range of 6.8 to 7.5.
Acid also has the reputation for being “forgiving” in that if scale deposits should form, a slight drop in pH will help remove them.
On the negative side, sulfuric acid is a hazardous, aggressive chemical. An accidental overfeed will cause a very corrosive condition that will result in irreversible system damage. Low pH conditions will also cause deterioration of concrete basins, steel pipe and galvanized steel cooling towers. For these reasons, the use of acid is generally restricted to very high hardness and alkalinity conditions.
As mentioned previously, calcium in the makeup restricts cycles of concentration to a practical limit of 350 to 450 ppm. A makeup supply that has 100 ppm calcium hardness, for example, limits the cooling tower cycles to 3.5 to 4.5. A practical way to remove this restriction is to soften the makeup to remove the calcium and magnesium hardness. An industrial or commercial water softener removes essentially all of the hardness and iron from the makeup. This water can be used “as is” or blended with a percentage of raw water to produce a final makeup of any desired hardness. Reducing the hardness to 50 ppm by softening and blending would permit the tower in our example to operate at seven to nine cycles instead of 3.5 to 4.5.
Softening offers another advantage in that it does not remove the alkalinity nor depress the pH. The high alkalinity and pH of the cooling water tends to passivate (make less prone to corrosion) steel, copper and galvanized steel. The higher pH also serves to inhibit bacteria growth in that many organisms do not thrive at pH values above nine.
Benefits of improved maintenance Maintaining cooling towers at maximum cycles of concentration is a practical way to conserve on freshwater withdrawal rates and produce less wastewater. This has a secondary benefit in that operating a cooling tower more efficiently reduces chemical treatment requirements and saves energy.
The maintenance team plays a vital role in helping to increase profit, gain competitive advantage and protect the natural environment. Water and energy conservation are at the core of this effort. These simple upgrades in cooling tower maintenance practices will help achieve these goals now and into the future. MT

Best Management Practice : Cooling Tower Management

$
0
0

Best Management Practice : Cooling Tower Management

Cooling towers regulate temperature by dissipating heat from recirculating water used to cool chillers, air-conditioning equipment, or other process equipment. Heat is rejected from the tower primarily through evaporation. Therefore, by design, cooling towers consume significant amounts of water.

Overview

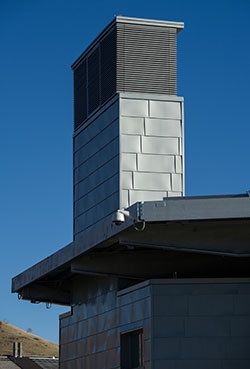
An air intake structure outside the west wing of the Research Support Facility.The thermal efficiency and longevity of the cooling tower and equipment used to cool depend on the proper management of water recirculated through the tower. Water leaves a cooling tower system in any one of four ways:
  1. Evaporation: This is the primary function of the tower and is the method that transfers heat from the cooling tower system to the environment. The quantity of evaporation is not a subject for water efficiency efforts (although improving the energy efficiency of the systems you are cooling will reduce the evaporative load on your tower).
     
  2. Drift: A small quantity of water may be carried from the tower as mist or small droplets. Drift loss is small compared to evaporation and blowdown, and is controlled with baffles and drift eliminators.
     
  3. Blowdown or bleed-off: When water evaporates from the tower, dissolved solids (such as calcium, magnesium, chloride, and silica) are left behind. As more water evaporates, the concentration of dissolved solids increases. If the concentration gets too high, the solids can cause scale to form within the system or the dissolved solids can lead to corrosion problems. The concentration of dissolved solids is controlled by blowdown. Carefully monitoring and controlling the quantity of blowdown provides the most significant opportunity to conserve water in cooling tower operations.
     
  4. Basin leaks or overflows: Properly operated towers should not have leaks or overflows. Check float control equipment to ensure the basin level is being maintained properly and check system valves to make sure there are no unaccounted for losses.
The sum of water that is lost from the tower must be replaced by make-up water:
Make-up = Evaporation + Blowdown + Drift
A key parameter used to evaluate cooling tower operation is "cycles of concentration" (sometimes referred to as cycles or concentration ratio). This is calculated as the ratio of the concentration of dissolved solids (or conductivity) in the blowdown water compared to the make-up water. Since dissolved solids enter the system in the make-up water and exit the system in the blowdown water, the cycles of concentration are also approximately equal to the ratio of volume of make-up to blowdown water.
From a water efficiency standpoint, you want to maximize cycles of concentration, which will minimize blowdown water quantity and reduce make-up water demand. However, this can only be done within the constraints of your make-up water and cooling tower water chemistry. Dissolved solids increase as cycles of concentration increase, which can cause scale and corrosion problems unless carefully controlled.
In addition to carefully controlling blowdown, other water efficiency opportunities arise from using alternate sources of make-up water. Water from other equipment within a facility can sometimes be recycled and reused for cooling tower make-up with little or no pre-treatment, including the following.
  • Air handler condensate (water that collects when warm, moist air passes over the cooling coils in air handler units). This reuse is particularly appropriate because the condensate has a low mineral content, and typically is generated in greatest quantities when cooling tower loads are the highest.
     
  • Water used in a once through cooling system.
     
  • Pretreated effluent from other processes, provided that any chemicals used are compatible with the cooling tower system.
     
  • High-quality wastewater effluent or recycled water (where available).

Operation and Maintenance

To maintain water efficiency in operations and maintenance, Federal agencies should:
  • Calculate and understand your "cycles of concentration." Check the ratio of conductivity of blowdown and make-up water. Work with your cooling tower water treatment specialist to maximize the cycles of concentration. Many systems operate at two to four cycles of concentration, while six cycles or more may be possible. Increasing cycles from three to six reduces cooling tower make-up water by 20% and cooling tower blowdown by 50%
  • The actual number of cycles you can carry depend on your make-up water quality and cooling tower water treatment regimen. Depending on your make-up water, treatment programs may include corrosion and scaling inhibitors along with biological fouling inhibitors
  • Install a conductivity controller to automatically control blowdown. Working with your water treatment specialist, determine the maximum cycles of concentration you can safely achieve and the resulting conductivity (typically measured as microSiemens per centimeter, uS/cm). A conductivity controller can continuously measure the conductivity of the cooling tower water and discharge water only when the conductivity set point is exceeded
  • Install flow meters on make-up and blowdown lines. Check the ratio of make-up flow to blowdown flow. Then check the ratio of conductivity of blowdown water and the make-up water (you can use a handheld conductivity meter if your tower is not equipped with permanent meters). These ratios should match your target cycles of concentration. If both ratios are not about the same, check the tower for leaks or other unauthorized draw-off. If you are not maintaining target cycles of concentration, check system components including conductivity controller, make-up water fill valve, and blowdown valve
  • Read conductivity and flow meters regularly to quickly identify problems. Keep a log of make-up and blowdown quantities, conductivity, and cycles of concentration. Monitor trends to spot deterioration in performance
  • Consider using acid treatment such as sulfuric, hydrochloric, or ascorbic acid where appropriate. When added to recirculating water, acid can improve the efficiency of a cooling system by controlling the scale buildup potential from mineral deposits. Acid treatment lowers the pH of the water and is effective in converting a portion of the alkalinity (bicarbonate and carbonate), a primary constituent of scale formation, into more readily soluble forms. Make sure workers are fully trained in the proper handling of acids. Also note that acid overdoses can severely damage a cooling system. The use of a timer or continuous pH monitoring via instrumentation should be employed. Additionally, it is important to add acid at a point where the flow of water promotes rapid mixing and distribution. Be aware that you may have to add a corrosion inhibitor when lowering pH
  • Select your water treatment vendor with care. Tell vendors that water efficiency is a high priority and ask them to estimate the quantities and costs of treatment chemicals, volumes of blowdown water, and the expected cycles of concentration ratio. Keep in mind that some vendors may be reluctant to improve water efficiency because it means the facility will purchase fewer chemicals. In some cases, saving on chemicals can outweigh the savings on water costs. Vendors should be selected based on "cost to treat 1,000 gallons make-up water" and highest "recommended system water cycle of concentration." Treatment programs should include routine checks of cooling system chemistry
  • Consider measuring the amount of water lost to evaporation. Some water utilities provide a credit to the sewer charges for evaporative losses, measured as the difference between metered make-up water minus metered blowdown water
  • Consider a comprehensive air handler coil maintenance program. As coils become dirty or fouled, there is increased load on the chilled water system to maintain conditioned air set point temperatures. Increased load on the chilled water system not only has an associated increase in electrical consumption, it also increases the load on the evaporative cooling process, which uses more water.

Retrofit Options

The following retrofit options help Federal agencies maintain water efficiency across facilities:
  • Install a sidestream filtration system composed of a rapid sand filter or high-efficiency cartridge filter to cleanse the water. These systems draw water from the sump, filter out sediments, and return the filtered water to the tower. This enables the system to operate more efficiently with less water and chemicals. Sidestream filtration is particularly helpful if your system is subject to dusty atmospheric conditions. Sidestream filtration can turn a troublesome system into a more trouble-free system
  • Install a make-up water or sidestream softening system when hardness (calcium and magnesium) is the limiting factor on cycles of concentration. Water softening removes hardness using an ion exchange resin and can allow you to operate at higher cycles of concentration
  • Install covers to block sunlight penetration. Reducing the amount of sunlight on tower surfaces can significantly reduce biological growth such as algae
  • Consider alternative water treatment options, such as ozonation or ionization, to reduce water and chemical usage. Be careful to consider the life cycle cost impact of such systems
  • Install automated chemical feed systems on large cooling tower systems (over 100 tons). The automated feed system should control blowdown/bleed-off by conductivity and then add chemicals based on make-up water flow. These systems minimize water and chemical use while optimizing control against scale, corrosion, and biological growth.

Replacement Options

The following replacement options help Federal agencies maintain water efficiency across facilities:
  • Get expert advice to help determine if a cooling tower replacement is appropriate. New cooling tower designs and improved materials can significantly reduce water and energy requirements for cooling. However, since replacing a cooling tower involves significant capital costs, you should investigate every retrofit, operations, and maintenance option available and compare costs and benefits to a new tower
  • For specifics on this technology, consult with experts in the field. Your first resource should be local or headquarters engineers, but do not overlook input from experienced contractors or other Government agencies.

Local Weather Report and Forecast For: Kakinada Dated :May 13, 2015

$
0
0
Local Weather Report and Forecast For: Kakinada    Dated :May 13, 2015
Kakinada
Past 24 Hours Weather Data
Maximum Temp(oC)37.4
Departure from Normal(oC)0
Minimum Temp (oC)28.9
Departure from Normal(oC)2
24 Hours Rainfall (mm)NIL
Todays Sunset (IST)18:24
Tommorows Sunrise (IST)05:30
Moonset (IST)13:44
Moonrise (IST)01:30
Today's Forecast:Sky condition would be generally cloudy. Rain or Thundershowers may occur in parts of city. Maximum & Minimum temperatures would be around 37 and 29 degrees Celsius respectively.
Date Temperature ( o C ) Weather Forecast
Minimum Maximum
14-May 28.0 37.0 Mainly or Generally cloudy sky with possibility of rain or Thunderstorm
15-May 27.0 37.0 Partly cloudy sky with possibility of rain or Thunderstorm
16-May 27.0 38.0 Partly cloudy sky with Thundery development
17-May 28.0 38.0 Partly cloudy sky with Thundery development
18-May 28.0 37.0 Partly cloudy sky with Thundery development
19-May 28.0 37.0 Partly cloudy sky with Thundery development


ActualAverage Record
Temperature
Mean Temperature32 °C-
Max Temperature37 °C- - ()
Min Temperature28 °C- - ()
Cooling Degree Days26
Growing Degree Days42 (Base 50)
Moisture
Dew Point26 °C
Average Humidity67
Maximum Humidity83
Minimum Humidity41
Precipitation
Precipitation0.0 mm- - ()
Sea Level Pressure
Sea Level Pressure1007.50 hPa
Wind
Wind Speed1 km/h ()
Max Wind Speed6 km/h
Max Gust Speed-
Visibility7.0 kilometers
Events 
T = Trace of Precipitation, MM = Missing ValueSource: Averaged Metar Reports

Daily Weather History Graph

Daily Weather History Graph


Monthly
 MONTHLY


Urea Formaldehyde

$
0
0

Urea Formaldehyde

UFC-85 is a viscous liquid containing 60% formaldehyde, 25% urea and balance water. Formaldehyde is first produced by the reaction of Methanol with Air. This is then absorbed in urea solution to form UFC-85.
Urea Formaldehyde Condensate (UFC-85) is an additive, which is added to the urea product to improve its strength. UFC-85 is used as an anticaking agent for the urea. Around 80% of the UFC-85 product is consumed internally, in all the urea plants of QAFCO and the remaining product is exported via trucks to the neighbouring countries.
Product Specification UFC:85
Formaldehyde Concentrate : 60 ± 0.5 % by Weight
Urea 25:± 0.5 % by Weight
F / U Molar Ratio : 4.8 ± 0.2
Methanol Content : 0.21 % by Weight,
Max. Formic Acid Content : 0.005 % by Weight, Max.

Method of cleaning dust-containing gas mixtures from a urea plant

$
0
0
Method of cleaning dust-containing gas mixtures from a urea plant
US 4507129 A
Abstract
Gas mixtures from a urea plant, particularly such mixtures containing dust and especially off-gases from prilling towers or granulation units are cleaned. In order to prevent precipitation and accretion in the cleaning unit, there is applied an aqueous washing solution to which formaldehyde is added before it is brought in contact with the gas mixture. Formaldehyde is preferably added in the form of formaline, and the addition of formaline is regulated by pH-measurements in the washing solution such that pH is maintained at pH=6-8.5. The pH of the washing solution is preferably kept at pH=about 7, especially in order to obtain optimal removal of ammonia. The method is carried out during application of standard scrubbers in which aqueous washing solutions can be used.
Images(2)
Claims(4)
I claim:
1. In a method for cleaning a dust-containing gas mixture from a urea plant, wherein said gas mixture is washed by an aqueous solution, the improvement comprising:
adding formaldehyde to said aqueous washing solution before bringing said solution into contact with said gas mixture.
2. The method claimed in claim 1, comprising adding said formaldehyde in the form of formaline.
3. The method claimed in claim 2, further comprising measuring the pH of said washing solution, and regulating the addition thereto of said formaline to maintain said pH from 6-8.5.
4. The method claimed in claim 3, comprising continuously adding a controlled amount of said formaline to said washing solution to maintain said pH at about 7.
Description
BACKGROUND OF THE INVENTION The present invention relates to a method of cleaning gas mixtures from a urea plant, particularly such mixtures containing dust, and especially off-gases from prilling towers or granulation units and where the gases are scrubbed by an aqueous solution.
Urea prills or granules are produced from highly concentrated urea solutions or melts and treated in a prilling tower or granulation unit where air is used for cooling the product. The air drawn from these units must be cleaned before it is released into the atmosphere because it will contain urea dust, ammonia and different other decomposition products of urea.
The air drawn from the urea plant is scrubbed by an aqueous solution in order to reduce air pollution from the plant. This aqueous solution usually circulates in the scrubber until it has the desired concentration of urea, whereupon it is returned to the process for reclaiming urea. There are known several types of such scrubbers.
From DE-application No. 2,513,925 it is known to employ a venturi scrubber, in which water is mixed with the off-gases before they are conducted into the venturi scrubber. Water is primarily mixed with the off-gases in order to reduce plugging of the venturi nozzles by urea dust.
During washing of the off-gases from a prilling tower with a circulating aqueous urea solution, problems have been experienced with precipitation giving accretion and plugging of the scrubber. The precipitation resulted in increasingly thick accretions in the scrubber. Finally, dispersed mud sedimented in the tanks and pipes and a hard brittle coating occurred on all surfaces that came into contact with the washing solution. The nozzles for spraying liquid into the multiventuri were plugged and the ability of the unit to separate dust from water was soon strongly reduced.
The precipitates and the accretions were insoluble in water, and even when the supply of water was increased this did not help. Mechanical cleaning of the unit by scraping or the like of the deposits was accordingly very laborious and expensive.
SUMMARY OF THE INVENTION The main object of the present invention is to provide a new method for washing off-gases from a urea plant so that precipitation of solid particles and formation of accretions in the scrubber can be avoided.
Another object is to provide a method to dissolve a deposit which already has been formed. It also is an object to improve removal of undesired gases in the off-gases and especially ammonia.
The effort of solving the problem was first started by studying the composition of the off-gases and then to determine the chemical and physical nature of the precipitates and the deposit. It is known that over a urea melt there will be a vapour pressure of decomposition products from urea, for instance ammonia and cyanic acid. When the melt is sprayed into a prilling tower or a granulation unit, there will be evaporation of decomposition products. Solid and urea droplets together with decomposition products of urea will partly be dissolved in the washing solution when brought into contact with the off-gases. A reaction between the different components in the solution is then evidently taking place, and a precipitate is formed which does not dissolve in water. To determine the reaction product proved to be difficult, but such product seemed to be a compound of cyanic acid, most likely a polymer. Therefore, an attempt was made to find a component which could neutralize the polymerization of cyanic acids. Both the absolute and relative amounts of the different components in the off-gases can vary, and this complicates the determination of possible reactions which might occur in the solution. A series of different reaction paths and products can be expected when all these components are present.
Experiments then were started in order to find suitable additives. When choosing additives one had to consider whether they could contaminate or in other ways damage the urea product.
As stated above, one wanted to reclaim the urea absorbed in the washing solution, and this is preferably carried out by continuously purging some of the urea solution circulating in the cleaning unit to the urea plant. Compounds added to the washing solution will accordingly end up in the urea product.
Having considered and tested several additives and thereupon rejected them because of negative results both in view of dissolving properties and contamination of the urea product, the inventors were finally left with formaldehyde as a possible additive to the washing solution. Formaldehyde was already used as an additive during the urea production, for increasing the crushing strength of the urea. It was then found that precipitation in the washing solution stopped and it was surprisingly found that formerly formed precipitate dissolved. After some time even the hard deposits started to dissolve, and the whole cleaning unit was cleaned in this way. The washing solution became completely clear, contrary to what it had been earlier when it was faded or contained milky precipitated compounds suspended in the solution.
The special feature of the method according to the invention is that during cleaning the gas mixture formaldehyde is added to the washing solution before it is brought in contact with the gas mixture.
The formaldehyde is preferably added to the washing solution as formaline, and the supply is regulated by means of pH-measurements in the washing solution, and the pH should be kept at pH=6-8.5.
The most preferred method is to continuously supply a controlled amount of formaline to the washing solution such that the pH=about 7.
BRIEF DESCRIPTION OF THE DRAWINGS The applied apparatus which was a technical unit is shown in the attached drawings, and the invention will be further explained during the following description thereof and of the examples.
FIG. 1 is a schematic illustation of a prilling tower for urea and a scrubber.
FIG. 2 is a schematic illustration of details of the formaline supply to the scrubber.
DETAILED DESCRIPTION OF THE INVENTION In FIG. 1 is shown a prilling tower 1, from which off-gases are led through pipes 2 to a venturi scrubber 3. Clean water is supplied via pipe 5 to nozzles 6 ahead of a demister 4. The washing solution from the scrubber is conducted through pipe 7 to a circulating tank 8, from which it is pumped back to the venturi scrubber 3 through pipe 9. Cleaned off-gases from the droplet demister 4 are discharged to an exhaust such as a pipe 10 or stack. A urea containing washing solution is continuously removed from the circulation tank 8 and conducted through pipe 13 back to the urea plant. Formaline is supplied through pipe 11 into the circulating tank 8. This supply is controlled by means of an instrument 12 which measures pH in the pipe 7 just before the solution reaches the tank 8.
The supply of formaldehyde is shown in more detail in FIG. 2. The aqueous formaldehyde solution (formaline) is supplied through pipe 11 to the circulating tank 8. The amount is regulated by a valve 14 which is controlled from the pH-measurements in pipe 7 by means of the instrument 12. The pH is registered by a control unit 15. The signal from this unit is used to control the regulating valve 14. Formaline or formaldehyde in other forms can first be mixed with water in a separate mixing tank to the desired concentration and then supplied through pipe 11. This mixing operation is not shown on the drawing.
EXAMPLE 1 The cleaning unit for off-gases was started by applying a circulated aqueous urea solution. Clean water was supplied to the unit in such amounts that the desired concentration of urea in the aqueous solution was obtained, and part of the solution was continuously purged and returned to the urea plant. At a production of 620 tons of urea/day, measurement of the ammonia emission in the gases leaving the scrubber was 11.4 kg/h. The pH in the washing solution was about 8.7. The washing solution faded and an increasing precipitation of solid particles and accretion in the scrubber occurred.
EXAMPLE 2 The cleaning unit was run as in Example 1, but now formaldehyde was added. Addition of formaldehyde was started after having noticed a definite precipitation, which soon disturbed the performance of the cleaning unit. Shortly afterwards the precipitated particles now dissolved and the solution became completely clear, and after some time even the deposits in the scrubber dissolved. The pH of the washing solution was reduced when formaldehyde was added. Emission of ammonia in the gases leaving the scurbber was recorded and proved to be reduced as a result of the improved washing by a washing solution having a lower pH.
There was now run a series of experiments in which the amount of formaldehyde in the washing solution was varied. When decreasing amounts of formaldehyde were used, it was noticed that first the emission of ammonia increased and the pH in the washing solution also increased. Further reduction of addition of formaldehyde resulted in fading of the washing solution and precipitation of the washing solution and precipitation of solids which dissolved again as soon as more formaldehyde was added. It was found that even small amounts of formaldehyde in the solution had a positive effect on preventing precipitation and accretion in the scrubber. Addition of larger amounts of formaldehyde resulted in reduced ammonia emission. It was found to be advantageous to keep the pH of the washing solution at pH=6-8.5, preferably pH=7, in order to obtain as good results as possible regarding low ammonia emission. It was experienced that an addition of formaline corresponding to about 1 kg CH2 O per ton urea produced gives acceptable results.
Thus it was found advantageous to apply the pH of the washing solution as a parameter for controlling the addition of formaldehyde. This is especially advantageous when it also is desired to obtain optimal removal of ammonia. Other parameters for the addition of formaldehyde can of course be applied. Constant amounts of formaldehyde can be used and also visual surveyance of precipitation which are shown by fading of the washing solution.
At which part of the cleaning unit formaldehyde should be added and in which form, has to be chosen in view of the practical performance of the unit. The determining factor is that the washing solution must contain formaldehyde and in desired amounts so that accretion is avoided and that absorption of ammonia is as good as possible.
The formaldehyde added to the washing solution will later on end up in the urea product. It has been found that the amount of formaldehyde added during the urea production in order to obtain products having a high crushing strength, can be reduced corresponding to the amount of formaldehyde added via the washing unit. It might even be possible to add all the formaldehyde necessary for increasing the crushing strength via the cleaning unit.
The present invention has made it possible to prevent precipitation and plugging of the scrubber and also doubling the removal of ammonia without increasing the addition of additives during the urea production. Further, there has been found a method for dissolving deposits in the scrubber if such deposits have been formed, for instance during stops of supply of formaldehyde to the washing solution.
The method which has been developed gives minimum performance and investment costs and can easily be applied in a standard cleaning unit for washing off-gases from a urea plant. The advantages of known units will be retained at the same time as better performance and better cleaning of the off-gases are retained by using the invention. These advantages are obtained by applying chemicals which do not pollute the product or disturb the production of urea. The cost of chemicals will be as before.
The degree of removal of ammonia from the off-gases was increased from about 30% to about 70%, and in the unit used for the above experiments this means that the emission of ammonia was reduced from about 10 kg/h to below 5 kg/h.

Weather Report and Forecast For: Kakinada Dated :May 14, 2015

$
0
0
Local Weather Report and Forecast For: Kakinada    Dated :May 14, 2015
Kakinada
Past 24 Hours Weather Data
Maximum Temp(oC)37.0
Departure from Normal(oC)0
Minimum Temp (oC)27.5
Departure from Normal(oC)0
24 Hours Rainfall (mm)NIL
Todays Sunset (IST)18:25
Tommorows Sunrise (IST)05:30
Moonset (IST)14:43
Moonrise (IST)02:17
Today's Forecast:Sky condition would be partly cloudy. Maximum & Minimum temperatures would be around 38 and 27 degrees Celsius respectively.
Date Temperature ( o C ) Weather Forecast
Minimum Maximum
15-May 27.0 38.0 Partly cloudy sky with Thundery development
16-May 27.0 38.0 Partly cloudy sky
17-May 26.0 27.0 Partly cloudy sky
18-May 26.0 37.0 Partly cloudy sky
19-May 26.0 37.0 Partly cloudy sky
20-May 25.0 36.0 Partly cloudy sky


ActualAverage Record
Temperature 
Mean Temperature32 °C -  
Max Temperature37 °C - - ()
Min Temperature27 °C - - ()
Cooling Degree Days24  
Growing Degree Days40 (Base 50)  
Moisture 
Dew Point27 °C  
Average Humidity70  
Maximum Humidity88  
Minimum Humidity55  
Precipitation 
Precipitation0.0 mm - - ()
Sea Level Pressure 
Sea Level Pressure1008.50 hPa  
Wind 
Wind Speed1 km/h ()  
Max Wind Speed6 km/h  
Max Gust Speed -   
Visibility7.0 kilometers  
Events    
T = Trace of Precipitation, MM = Missing ValueSource: Averaged Metar Reports

Daily Weather History Graph

Daily Weather History Graph


 today prediction

monthly

MaxAvgMinSum
Temperature 
Max Temperature38 °C36 °C30 °C
Mean Temperature32 °C32 °C30 °C
Min Temperature28 °C27 °C25 °C
Degree Days 
Heating Degree Days (base 65)0000
Cooling Degree Days (base 65)272520373
Growing Degree Days (base 50)424035594
Dew Point 
Dew Point28 °C26 °C22 °C
Precipitation 
Precipitation0.0 mm0.0 mm0.0 mm0.00 mm
Snowdepth - - - -
Wind 
Wind11 km/h1 km/h0 km/h
Gust Wind - - -
Sea Level Pressure 
Sea Level Pressure1011 hPa1008 hPa1005 hPa

Monthly Weather History Graph

Monthly Weather History Graph 
 

Forecast of the Onset date of Southwest Monsoon - 2015 over Kerala

$
0
0
Forecast of the Onset date of Southwest Monsoon - 2015 over Kerala

The southwest monsoon is likely to set over Kerala on or around 30th May.

The onset of southwest monsoon over Kerala signals the arrival of monsoon over the Indian subcontinent and represents beginning of rainy season over the region. From 2005 onwards ESSO-India Meteorological Department (IMD) has been issuing operational forecasts for the date of monsoon onset over Kerala using an indigenously developed statistical model, which uses the following six predictors:

i) Minimum Temperature over North-west India, ii)  Pre-monsoon rainfall peak over south Peninsula, iii) Outgoing Long wave Radiation (OLR) over south China Sea, (iv) Lower tropospheric zonal wind over southeast Indian ocean, (v) upper tropospheric zonal wind over the east equatorial Indian Ocean, and (vi) Outgoing Long wave Radiation (OLR) over south-west Pacific region.

The operational forecasts for the event issued during all the last nine years (2005 to 2014) were correct as seen in the table given below.

Year
Actual Onset Date
Forecast Onset Date
2005
7th June
10th June
2006
26th May
30th May
2007
28th May
24th May
2008
31st May
29th May
2009
23rd May
26th May
2010
31st May
30th May
2011
29th May
31st May
2012
5th June
1st June
2013
1st June
3rd June
2014
6th June
5th June

Advance of southwest monsoon over the Andaman Sea normally takes place around 20th May with a standard deviation of about one week.  During the last few days, enhanced convection and increased rainfall activity has been observed over the Bay of Bengal and the Andaman Sea.  The cross equatorial flow is likely to strengthen and deepen over the area. As such, conditions are becoming favourable for advance of southwest monsoon over the Andaman Sea and adjoining sea areas during the next 3-4 days. Past data suggests absence of any one to one association of the date of monsoon advance over Andaman Sea with the date of monsoon onset over Kerala or that with the seasonal monsoon rainfall over the country.

Moisture is generally referred to as a chemical contaminant when suspended in lubricating oils.

$
0
0
Moisture is generally referred to as a chemical contaminant when suspended in lubricating oils. Its destructive effects in bearing applications can reach or exceed that of particle contamination, depending on various conditions. Like particles, vigilant control must be exercised over entry of water to minimize its accumulation in the lubricants and its damage to bearing surfaces.
This paper will discuss the influence of moisture on the chemical stability of a lubricant's additives and base stock. The effects of moisture on machine surfaces, particularly as relates to wear and corrosion, will also be discussed. Finally, a three-step, proactive maintenance strategy will be proposed to minimize the effects of moisture on lubricant and bearing life.


 http://dramarnathgiri.blogspot.in/2012/12/the-second-most-destructive-lubricant.html?q=LUBE+OIL


Fouling FactorsFouling is a function of the system and the equipment used.  Parameters which influence the fouling rate in a system include: the type of fluid, the type of heat exchanger, the temperatures, the velocities and the materials of construction.  The actual fouling rate is different for each application.  There are numerous resources for fouling factor values.  The best source is from existing operating facilities.  When production data is available, it can be used to calculate the actual fouling factors for the system.  Together with the maintenance and cleaning history, this provides the best resource for selecting the fouling factors for a particular application.However, when production data is not available, one must rely on other sources.  Over the years, typical fouling factors have been compiled for various systems and fluids.  The tables below show some of these typical fouling factors:
Process Fluids
Fouling Resistance
(ft2-°F-hr/BTU)
Oils
         Fuel Oil #2
0.002
         Fuel Oil #6
0.005
         Transformer Oil
0.001
         Engine Lube Oil
0.001
Gases and Vapors
         Acid gas
0.002 - 0.003
         Ammonia vapor
0.001
         Chlorinated hydrocarbons vapors
0.001 - 0.0015
         Chlorine Vapor 
0.002
         CO2 vapor
0.001
         Compressed Air
0.001
         Hydrogen
0.0005
         Hydrogen (saturated with water)
0.002
         Light Hydrocarbon vapors (clean)
0.001
         Natural Gas
0.001 - 0.002
         Natural Gas Flue Gas
0.005
         Nitrogen
0.0005
         Polymerizable vapors (with inhibitor)
0.003 - 0.03
         Refrigerant Vapors (oil bearing)
0.002
         Solvent Vapor
0.001
         Stable Overhead Products
0.001
         Steam (non-oil bearing)
0.0005
         Steam (exhaust, oil bearing)
0.0015 - 0.002
Liquids
         Ammonia Liquid
0.001
         Ammonia Liquid (oil bearing)
0.003
         CO2 Liquid
0.001
         Chlorinated hydrocarbons liquid
0.001 - 0.002
         Chlorine Liquid
0.002
         DEG & TEG Solutions
0.002
         Ethylene Glycol Solutions
0.002
         Gasoline
0.002
         Heavy Fuel Oils
0.005 - 0.007
         Heavy Gas Oil
0.003 - 0.005
         Hydraulic Fluid
0.001
         Kerosene
0.002 - 0.003
         Light Gas Oil
0.002 - 0.003
         Light hydrocarbon liquid (clean)
0.001
         MEA & DEA Solutions
0.002
         Naphtha and Light Distillates
0.002 - 0.003
         Organic Heat Transfer Liquids
0.002
         Refrigerant Liquids
0.001
                                                       
Water
Fouling Resistance
Fouling Resistance
(ft2-°F-hr/BTU)
(ft2-°F-hr/BTU)
water temperature
 125°F or less
over 125°F
water velocity
3 ft/s or less
over 3 ft/s
3 ft/s or less
over 3 ft/s
Boiler Blowdown Water
0.002
0.002
0.002
0.002
Brackish Water
0.002
0.001
0.003
0.002
Condensate
0.0005
0.0005
0.0005
0.0005
Cooling Tower Water (treated)
0.001
0.001
0.002
0.002
Cooling Tower Water (untreated)
0.003
0.003
0.005
0.004
City or Well Water
0.001
0.001
0.002
0.002
River Water (minimum)
0.002
0.001
0.003
0.002
River Water (average)
0.003
0.002
0.004
0.003
River Water (muddy or silty)
0.003
0.002
0.004
0.003
Sea Water
0.0005
0.0005
0.001
0.001
Treated Boiler Feed Water
0.001
0.0005
0.001
0.001
 

New Urea Policy alters energy math, encourages production: CRISIL

$
0
0

New Urea Policy alters energy math, encourages production: CRISIL

Govt has estimated subsidy savings of Rs 2,600 cr in 4 yrs by resetting energy consumption norms


The New Urea Policy 2015 announced by the Union Cabinet earlier this week may not be uniformly beneficial for the industry. The policy tightens energy consumption norms and aims to increase production by two million tonne. This, according to a CRISIL report, would have a mixed impact that would vary between manufacturers. While the new norms on energy savings would be a credit negative since they reduce the profit on production up to a specified cut-off capacity, profit can be higher for production beyond that threshold.

The negative impact will depend on what energy norms are applicable for each unit and scope for further efficiencies. The positive impact will depend on capacity utilization, specifically, the extent of production possible and any fixed-subsidy allocated per tonne in order to incentivize production  So far, urea manufacturers have benefited because their energy consumption has been less than the norms set by the government. And subsidy was given based on these norms for production up to the cut-off.

The new policy is yet to be notified but the government estimates subsidy savings of Rs.2,600 crore in four years by resetting energy consumption norms. Besides, there will be indirect saving of Rs 2,211 crore (total savings will be Rs 4,829 crore) on account of revised specific energy consumption norms and import substitution respectively during the next four years. 

According to CRISIL, this will be directly mopped up from the bottomlines of urea manufacturers because stricter norms will translate into lower gains from energy savings unlike before. However, the policy will push manufacturers to further enhance their energy efficiencies.

For production beyond cut-off, the prevailing subsidy was linked to import-parity prices of urea. But in the last fiscal, import-parity price fell, domestic natural-gas prices rose, and consumption of imported re-gasified liquefied natural gas (RLNG) also increased because of which profit from production beyond cut-off capacity had almost dried up for most manufacturers.

Depending on the domestic-imported gas mix, and in the absence of any change in policy, production beyond cut-off had also become unviable for some manufacturers.

CRISIL said the New Urea Policy aims to increase domestic output by encouraging production beyond cut-off. But the extent of increase in profits can be ascertained only once the fixed subsidy, if any, payable for production beyond cut-off is known.

The increase in profit will largely offset the impact of tightening of energy norms for production up to cut-off. And fixed subsidy for production beyond cut-off capacity will add to stability in cash flows. For urea manufacturers that haven’t revamped their plants and do not produce beyond 100 per cent capacity, the policy will largely be negative. 

Urea production can be divided into two parts: production up to cut-off capacity (nearly 90 per cent of domestic capacities) and production beyond cut-off capacity (nearly 10 per cent of domestic capacities)

Among the companies that are likely to be impacted are Chambal Fertilisers and Chemicals Limited, Indian Farmers Fertilisers Co-operative Limited, KRIBHCO Shyam Fertilizers Limited, Krishak Bharati Cooperative Limited, Mangalore Chemicals and Fertilizers Limited, National Fertilizers Limited, Rashtriya Chemicals and Fertilizers and Tata Chemicals Limited.

The Union Cabinet on Monday approved a comprehensive New Urea Policy for the next four financial years. The policy is aimed at maximizing indigenous urea production and promoting energy efficiency in urea units to reduce the subsidy burden on the Government. "It will enable the domestic urea sector having 30 urea producing units, to become more energy efficient, would rationalize the subsidy burden and incentivize urea units to maximize their production at the same time," said a government statement.

It is expected to result in additional production of around 20 lakh/MT annually. Presently, India is importing about 80 lakh metric tonnes of urea out of total demand of 310 lakh metric tonnes.

Earlier the Government had approved gas pooling policy under which all urea units would get gas at a uniform price. The government had also decided in January to allow urea producers to produce neem coated urea upto 100 per cent of production and making it mandatory to produce a minimum of 75 per cent of domestic urea as neem coated, so that farmers are benefitted. Neem coated urea is required less in quantity with same plot size and gives higher crop yields. Underground water contamination due to leaching of urea also gets reduced with neem coating since nitrogen in the neem coated urea gets released to plants very slowly. Neem coated urea is not fit for industrial use, so chances of its illegal diversion to industries will also be lesser. 

The MRP of urea for the farmers has been kept the same at Rs. 268/- per bag of 50 kgs. excluding local taxes. Farmers have to pay an additional price of only Rs.14/- per bag of neem coated urea. 

The Government also decided to continue the existing subsidy rates for Phosphatic and Potassic (P&K) fertilizers (22 grades including DAP, Single Super Phosphate (SSP), Muriate of Potash (MOP), etc.) under the Nutrient Based Subsidy (NBS) policy for the current year. Subsidy rate for DAP remains same at Rs 12350/- per metric tonne while it is Rs 9300/- for MOP. Separate subsidy for boron and zinc coated fertilizers has also been continued. 

There are 19 units producing phosphatic fertilizers and 103 units making SSP. The entire requirement (approximately 30 lakh Metric Tonnes) of MOP is met from imports, since there is no resource of potash in India. About 90 percent of the phosphates are imported.

http://www.business-standard.com/article/economy-policy/new-urea-policy-alters-energy-math-encourages-production-crisil-115051500564_1.html

Do a regular Health Check up on your Urea plant !

$
0
0
Do a regular Health Check up on your Urea plant !
• How to keep your urea plant in optimum shape ?
• Is your plant running at optimum process conditions and what about
realizing maximum output, minimum ammonia losses, minimum energy
consumption and optimum product quality ?
• And how to realize a maximize reliability and on stream figures
minimizing unplanned shut downs and keep safety standards up to date ?
• And what about future debottlenecking possibilities ?
UreaKnowHow.com offers now Health Check services covering all these aspects !
Typically a team of experts assesses your plant during a five-day visit and performs a comprehensive
and detailed Heath Check on the agreed items of interest. At the end of the visit a comprehensive
report including conclusions and recommendations (for short term and long term) is prepared,
presented and discussed in detail with you. As an option our experts can also include a training
module in their presentation.
Tick the items of interest in the list below and we will send you an offer (without any further
obligations):
☐ Are we operating at the optimum process parameters?
☐ How to maximize urea production?
☐ How to minimize ammonia emission / consumption?
☐ How to minimize energy consumption?
☐ How to increase safety standards?
☐ How to optimize urea product quality?
☐ What are our debottlenecking options?
☐ Do we face risks of atmospheric corrosion or corrosion under insulation?

Weather Report and Forecast For: Kakinada Dated :May 15, 2015

$
0
0


Local Weather Report and Forecast For: Kakinada    Dated :May 15, 2015
Kakinada
Past 24 Hours Weather Data
Maximum Temp(oC)36.6
Departure from Normal(oC)-1
Minimum Temp (oC)27.9
Departure from Normal(oC)1
24 Hours Rainfall (mm)NIL
Todays Sunset (IST)18:25
Tommorows Sunrise (IST)05:30
Moonset (IST)15:42
Moonrise (IST)03:04
Today's Forecast:Sky condition would be generally cloudy. Rain/thundershowers may occur in parts of city. Maximum & Minimum temperatures would be around 37 and 27 degrees Celsius respectively.
Date Temperature ( o C ) Weather Forecast
Minimum Maximum
16-May 27.0 36.0 Mainly or Generally cloudy sky with possibility of rain or Thunderstorm
17-May 26.0 36.0 Mainly or Generally cloudy sky with possibility of rain or Thunderstorm
18-May 26.0 36.0 Partly cloudy sky with possibility of rain or Thunderstorm
19-May 26.0 36.0 Partly cloudy sky with Thundery development
20-May 26.0 37.0 Partly cloudy sky
21-May 26.0 37.0 Partly cloudy sky


ActualAverage Record
Temperature 
Mean Temperature32 °C -  
Max Temperature36 °C - - ()
Min Temperature27 °C - - ()
Cooling Degree Days24  
Growing Degree Days40 (Base 50)  
Moisture 
Dew Point26 °C  
Average Humidity68  
Maximum Humidity78  
Minimum Humidity54  
Precipitation 
Precipitation0.0 mm - - ()
Sea Level Pressure 
Sea Level Pressure1008.63 hPa  
Wind 
Wind Speed0 km/h ()  
Max Wind Speed6 km/h  
Max Gust Speed -   
Visibility7.0 kilometers  
Events    
T = Trace of Precipitation, MM = Missing ValueSource: Averaged Metar Reports

Daily Weather History Graph

Daily Weather History Graph
 TODAY PREDICTION


MaxAvgMinSum
Temperature 
Max Temperature38 °C36 °C30 °C
Mean Temperature32 °C32 °C30 °C
Min Temperature29 °C27 °C25 °C
Degree Days 
Heating Degree Days (base 65)0000
Cooling Degree Days (base 65)272520397
Growing Degree Days (base 50)424035634
Dew Point 
Dew Point28 °C26 °C22 °C
Precipitation 
Precipitation0.0 mm0.0 mm0.0 mm0.00 mm
Snowdepth - - - -
Wind 
Wind11 km/h1 km/h0 km/h
Gust Wind - - -
Sea Level Pressure 
Sea Level Pressure1011 hPa1008 hPa1005 hPa

Monthly Weather History Graph

Monthly Weather History Graph


Home secretary asks state govt not to take IMD warnings lightly

$
0
0

Home secretary asks state govt not to take IMD warnings lightly


Home secretary asks state govt not to take IMD warnings lightly
A screen grab of IMD website.
New Delhi: The Union home secretary on Saturday exhorted all state governments to not take warnings, whether big or small, issued by the India Meteorological Department (IMD) lightly.
He also asked states to identify disaster vulnerable areas and take up long term projects to create necessary infrastructure to tackle disasters.
“Every warning issued by the India Meteorological Department must be taken seriously whether it is big or small ... Every state must identify disaster vulnerable areas and take up projects on long term projects to address the concerns ... it should be done as these (issues) tends to be ignored,” said L.C. Goyal on Saturday.
He was speaking while inaugurating the annual conference of relief commissioners and secretaries of the department of disaster management of states government and administrations of union territories to review the status of preparedness for southwest monsoon 2015.
He urged for building capacities of the National Disaster Response Force (NDRF) and SDRFs to effectively tackle natural and man-made disasters. Goyal also observed that civil society including NGOs play a critical role in disaster management.
Stating that the primary responsibility of disaster management rests with the state authorities, Goyal noted that only 21 States have constituted SDRFs (State Disaster Response Force). He said that he expects other states to set up SDRFs in a given timeframe and asked them to use funds given to them by the 14th Finance Commission for this purpose.
K.K. Pathak, joint secretary in the union home ministry, asked states to appoint permanent personnel rather than drawing personnel from fire or police services on an ad-hoc basis.
Meanwhile, highlighting that nearly 80% of damage caused by disasters in India is due to flooding of rivers, Goyal said the problem cannot be tackled without periodic dredging.
National Disaster Management Authority’s member secretary R.K. Jain, who also attended the meeting, echoed with Goyal’s views. “Though we are now able to save more human lives due to floods, still more attention needs to be paid to minimizing loss to livelihood including livestock,” Jain added.
The home secretary further called for organising the conference twice a year compared to present practice of having it once a year only so that all work done carried out for disaster management can be reviewed.
Apart from relief commissioners and secretaries of department of disaster management of States, the meeting was also attended by top officials of the NDMA, IMD, ISRO, CWC, GSI, NIC, NDRF, NIDM and UNDP participated in the daylong conference.

Local Weather Report and Forecast For: Kakinada Dated :May 16, 2015

$
0
0

Local Weather Report and Forecast For: Kakinada    Dated :May 16, 2015

Kakinada
Past 24 Hours Weather Data
Maximum Temp(oC)37.2
Departure from Normal(oC)-1
Minimum Temp (oC)26
-2
24 Hours Rainfall (mm)NIL
Todays Sunset (IST)18:25
Tommorows Sunrise (IST)05:29
Moonset (IST)16:42
Moonrise (IST)03:52
Today's Forecast:Sky condition would be generally cloudy.Rain/ Thundershowers may occur in parts of city.Maximum and Minimum temperatures would be around 37 & 28 degrees Celsius respectively.
Date Temperature ( o C ) Weather Forecast
Minimum Maximum
17-May 27.0 37.0 Mainly or Generally cloudy sky with possibility of rain or Thunderstorm
18-May 27.0 37.0 Partly cloudy sky with possibility of rain or Thunderstorm
19-May 27.0 37.0 Partly cloudy sky with Thundery development
20-May 28.0 37.0 Partly cloudy sky with Thundery development
21-May 28.0 38.0 Partly cloudy sky
22-May 28.0 38.0 Partly cloudy sky


ActualAverage Record
Temperature
Mean Temperature32 °C-
Max Temperature37 °C- - ()
Min Temperature26 °C- - ()
Cooling Degree Days26
Growing Degree Days41 (Base 50)
Moisture
Dew Point26 °C
Average Humidity66
Maximum Humidity85
Minimum Humidity41
Precipitation
Precipitation14.0 mm- - ()
Sea Level Pressure
Sea Level Pressure1006.75 hPa
Wind
Wind Speed1 km/h ()
Max Wind Speed6 km/h
Max Gust Speed-
Visibility7.0 kilometers
EventsRain
T = Trace of Precipitation, MM = Missing ValueSource: Averaged Metar Reports

Daily Weather History Graph

Daily Weather History Graph

 today prediction


MaxAvgMinSum
Temperature
Max Temperature38 °C36 °C25 °C
Mean Temperature32 °C32 °C26 °C
Min Temperature28 °C27 °C25 °C
Degree Days
Heating Degree Days (base 65)0000
Cooling Degree Days (base 65)272413416
Growing Degree Days (base 50)423928668
Dew Point
Dew Point28 °C26 °C22 °C
Precipitation
Precipitation14.0 mm0.8 mm0.0 mm14.00 mm
Snowdepth- - - -
Wind
Wind11 km/h1 km/h0 km/h
Gust Wind- - -
Sea Level Pressure
Sea Level Pressure1011 hPa1008 hPa1004 hPa

Monthly Weather History Graph

Monthly Weather History Graph


151 Ways to Save Energy

$
0
0

151 Ways to Save Energy

The consumption of fossil fuels has been going at a steady pace since last century and has contributed much to the degradation of our environment. Climate change, global warming, extinction of several endangered species, depletion of ozone layer, increase in air pollution are few of the effects from which our environment is suffering. Although many countries have taken steps to move toward clean and green energy sources like solar energy, wind energy and geothermal energy to save energy, still there is long way to go before we can leave fossil fuels behind and depend on these natural sources of energy for our daily needs.
Below are 151 ways that you can use to save and conserve energy and make this planet a better and clean place for our future generations to come.

Heating Systems

1. Inspect windows and ductwork for any air leakage. If you do feel air leaking at duct joints, use duct tape to seal them. Winterize windows with weather stripping (for all movable parts) and caulk (for non-moving parts). Eliminating these leaks can reduce heating costs up to 10%.
2. Use kitchen, bath and other ventilating fans sparingly. Leaving them on too long will suck away a tremendous amount of household heat. Turn them off when their job is complete.
3. Turn down your thermostat at night or when you’re away for more than four hours during the day. Do not turn off your heating system entirely as this may cause pipes to freeze.
4. Keep heating supply registers and cold-air return registers clear of draperies and furniture to maintain proper air circulation.
Sunlight_in_open_room
5. Keep drapes and shades open during the day to let the sunshine in; close them at night.
6. Dust or vacuum radiator surfaces frequently. Dust and grime impede the flow of heat.
7. Keep lamps, TVs and other electrical appliances away from the thermostat. Heat from these appliances is sensed by the thermostat and could cause your furnace to shut off too soon and restart frequently.
8. Dress warmly to help retain body heat. Wear closely woven fabrics. Dressing in layers retains more heat than a single thick piece of clothing.
9. Keep garage doors closed in winter. An open garage door is just a giant hole that sucks warm air out of your home and lets cold drafts in.
10. When having company, turn down the thermostat before your guests arrive. Their collective body heat will add to the room temperature.
11. Warm with a space heater. A portable space heater can heat a single room without using your furnace to heat the whole house. Using a space heater to heat all or most of your home costs more. Always follow the manufacturer’s safety instructions when operating space heaters.
12. Use natural gas for heating. Consider switching to a natural gas heating system. Natural gas is less expensive than other heating fuels.

KITCHEN

13. Boil water in a kettle or covered pan; the water will boil faster and use less energy.
14. Keep range-top burners and reflectors clean. They will reflect heat better and you will save energy.
15. Match the size of the pan to the heating element. More heat will get to the pan, and less will be dissipated.
16. Turn off the stove or oven five to 10 minutes before cooking time is up and let trapped heat finish the cooking.
17. Avoid opening the oven door repeatedly to check food while it cooks. This allows heat to escape and requires more energy to complete the job. Use a timer to let you know when food is ready.
18. Use small electric cooking appliances (such as portable grills and skillets) for small meals rather than the stove or oven.
19. Don’t preheat the oven unless absolutely necessary and then for no more than 10 minutes.
20. Avoid using the broiler as much as possible; it uses a great deal of energy.
21. Thaw frozen foods thoroughly before cooking.
22. Barbecue outside as much as possible during warm weather months.
23. Cook during cooler hours (early morning and late evening) whenever possible.
24. Use a microwave to cook meals whenever possible; it uses about half the energy of a conventional oven.
25. Use crock pots and slow cookers; they can be as much at 75% more energy efficient than stoves and ovens.
26. After using your oven, leave it open a crack to let warm air escape into your kitchen. (Don’t do this if you have children or pets around).
27. Use smaller kitchen appliances whenever possible. Microwaves, toaster ovens and slow-cookers can use 75 percent less energy than a large electric oven.
28. Water heaters should be close to kitchen so that it does not have to travel through a long distance of pipe and lose its heat.

WATER HEATER

29. Purchase an energy-efficient model. The initial cost may be more but operating costs are less in the long run. Consider a tank less or instantaneous water heater, which uses energy only when hot water is needed, rather than maintaining 40 gallons or more of hot water all the time.
30. Purchase the correct size. Consider your family’s hot water needs. If your water heater is too large, it uses more energy than needed. If it is too small, you may run out of hot water.
31. Purchase a natural gas water heater. If you currently have an electric water heater, consider replacing it with a natural gas water heater. When it comes to heating water, natural gas is less expensive than electricity, and it heats more water faster during heavy use. Consider a sealed combustion or an on-demand water heater. Both types use less energy.
32. Install your water heater near the kitchen. The kitchen is where you use the hottest water. When the water heater is located near the kitchen, hot water doesn’t have to travel as far and less heat is lost.
33. Insulate water pipes. Use half-inch foam or pipe tape for insulation wherever pipes are exposed. On cold water pipes, insulate four to five feet nearest to the water heater. Pipe insulation can save you up to $25 annually.
34. Set the water temperature to 120° F. It takes less energy to heat water to a lower temperature. If you have an electric water heater, you’ll have to remove the cover plate of the thermostat to adjust the temperature. For safety reasons, remember to turn off the water heater at the circuit breaker/fuse before changing the temperature.
35. Repair dripping faucets promptly. If the faucet leaks hot water, the energy used to heat it is costing you money. (One drop a second can waste up to 48 gallons a week!)
36. Install a heat loop or in-line trap. If you add a new water heater to your home, consider having a heat loop or in-line trap installed. These mechanisms can be inexpensive to install and keep hot water from moving into the piping system when you are not using hot water. Ask your plumbing contractor for details.
37. Insulate the outside of your electric water heater with an insulation blanket to reduce heat loss; this can easily save you $10 to $20 per year.
38. Turn down your hot water heater to its lowest setting when you go on vacation or are away from the house for an extended time period.
39. Drain a bucket of water out of the hot water heater once a year to remove sediment and dirty water and improve heating efficiency.

FANS & LIGHTING

40. Use Energy Star compact fluorescent light bulbs. Energy Star compact fluorescent light bulbs last longer and use up to 75 percent less energy than standard light bulbs.
Fluorescent_light_bulbs
41. Use halogen light bulbs for outdoor lighting (spot lights, flood lights, security lights). They use about 25% less energy than traditional incandescent bulbs.
42. Turn off lights in any room not being used. Turn on outdoor lights only when needed.
43. When using incandescent bulbs, use the lowest wattage possible or convenient. In many cases a lower wattage bulb can be substituted for the one currently being used.
44. Light-zone your home to save electricity. Concentrate lighting to areas where needed for reading, work and safety. Reduce lighting in little used areas.
45. Install lighting dimmer switches; they save energy by reducing the lighting intensity in a room.
46. Keep light bulbs dust-free. Dust on bulbs could be reducing your light output by 50%.
47. Use timers, motion detectors, heat sensors or photocell controls for light fixtures when possible.
48. Use satin or semi-gloss paint on your walls will reflect more light and allow you to use lower watt bulbs.
49. Put your computer to sleep instead of using a screen saver.
50. Laser printers use an incredible amount of energy. Switch to ink-jet printers.
51. Get rid of your CRT monitor. CRT monitors are energy hogs. Get an LCD monitor for your computer instead.
52. Dump your desktop computer. Laptops use a fraction of the electricity that desktop use.

ROOM AIR CONDITIONER

53. Don’t over-cool. The ideal thermostat setting is between 75°F and 78°F. Every degree you raise your thermostat can result in a 5% savings on the cost of cooling your home.
54. Keep lamps, televisions and other heat sources away from the air conditioner thermostat. Heat from these sources may cause the air conditioner unit to run longer than it should.
55. Make sure that no furniture or other obstacles are blocking ducts or fans. This will enable cooled air to circulate more freely.
56. When selecting a central air conditioning unit, be sure to choose one that is sized appropriately for your home and uses the minimal amount of electricity to complete its task. Air conditioners with high Seasonal Energy Efficiency Ratios (SEERs) – such as 13.0 SEER and above – provide the greatest energy efficiency.
57. Install a ventilating fan in your attic or in an upstairs window to help dissipate hot air and cool down your home.
58. Don’t set your thermostat at a colder setting than normal when you turn your air conditioner on. It will not cool the room any faster, but it will use more energy.
59. Use a ceiling fan in conjunction with your air conditioner to spread cooled air to other rooms.
60. Clean the outside air conditioner condenser coil once a year. Turn off the unit and spray the coils with water at a low pressure to remove dirt, dust, leaves and grime.
61. Use duct tape to seal the cracks between each section of an air duct on your central air conditioning or forced heating system.
62. Close your blinds, curtains and shades during the hottest part of the day. Keep out the daytime sun with vertical louvers or awnings on the outside of your windows.
63. Keep lights low or off when not needed. Electric lights generate unnecessary room heat.

REFRIGERATORS & FREEZERS

64. Vacuum the coils on your refrigerator at least every three months. Dust and dirt build-up makes the refrigerator work harder and uses more energy.
65. Set the refrigerator thermostat at 38 degrees F for fresh food compartments and 5 degrees F for the freezer compartment.
66. Regularly defrost your freezer. Frost buildup increases the amount of energy needed to keep the refrigerator at its proper temperature. Never allow frost to build up more than one quarter of an inch.
67. Don’t place your refrigerator or freezer in direct sunlight or near the stove.
68. Make sure your refrigerator door seals airtight. Test them by closing the door on a piece of paper or dollar bill so it is half in and half out of the refrigerator. If you can pull the paper or dollar out easily, the hinge may need adjusting or the seal may need replacing.
69. Keep the refrigerator door closed. Each time you open the refrigerator, up to 1/4 of the cold air inside can leak out. Stop making unnecessary trips to the fridge.
70. Purchase an Energy Star model. When buying a new refrigerator or freezer, look for the Energy Star label. Energy Star refrigerators and freezers can save you hundreds of dollars on your electric bill over the life of the appliance. Remember, older refrigerators and freezers use two to three times more electricity than ones that are 10 years old or less.
71. Select the right size. Determine your household’s needs before purchasing a refrigerator or freezer. One that is too large wastes energy.
72. Only use one refrigerator or freezer. You can spend up to $120 in electricity per year using a second refrigerator or freezer. If you want to use a second refrigerator or freezer during holidays or for special occasions, turn it on one to two days before you need it.
73. Defrost a manual-defrost unit regularly. Frost makes your unit work harder and wastes energy. Don’t allow more than one-quarter inch of frost to build up.
74. Stay away from direct heat. Place the refrigerator or freezer away from direct sunlight and other heat sources such as ovens or ranges. Heat will cause the unit to use more energy to stay cold.

DISHWASHER

75.When buying a dishwasher, look for an energy-efficient model with air power or overnight dry setting. These features automatically turn off the dishwasher after the rinse cycle. This can save you up to 10% of your dishwashing energy costs.
76. Scrape dishes and rinse with cold water before loading them into the dishwasher. Avoid using the dishwasher’s pre-rinse cycle.
Dishwasher
77. Don’t use the “rinse-hold” on your machine for just a few soiled dishes. It uses several gallons of hot water each time you use it.
78. Run full loads. Always wait until you have a full load before running your dishwasher. Full loads use the same amount of hot water and energy as smaller loads. You run fewer loads and save energy.
79. Use short cycles. Select the shortest cycle that properly cleans your dishes. Shorter cycles use less hot water and less energy.
80. Skip rinsing the dishes. If you do rinse, use cold water.
81. Clean the filter. If your dishwasher has a filter screen, clean it regularly. A clean appliance runs more efficiently.
82. Don’t bother pre-rinsing dishes with the idea that your dishwasher will work less hard.

BUYING NEW APPLIANCES

83. Remember that it pays to invest in energy efficiency. In some cases, the money you save in energy costs can pay back the purchase price in just a few years.
84. Always read the Energy Guide label carefully, and make sure you’re comparing “apples to apples.” Energy use can range significantly even within a single brand.
85. Choose the capacity that’s right for your family. Whether it’s a furnace or a refrigerator, it doesn’t pay to purchase a unit that’s too large or too small.
86. In almost every case, a natural gas appliance is more economical to use than an electric model. The $50-75 price difference can be paid back in energy savings in less than a year.
87. Replace inefficient appliances – even if they’re still working. An aging water heater or refrigerator could be costing you much more than you think. If your central air conditioner is more than 10 years old, replacing it with a high-efficiency new unit will cut your summer electric bills by about one-third.
88. Shop during the off-season. Many heating and cooling manufacturers offer significant rebates during seasonal sales promotions, and dealers may charge less for installation.
89. Investigate new technology carefully. Some innovations, like convection ovens or argon-filled windows, may save energy and make life more convenient; others, such as commercial-grade kitchen appliances, might be merely expensive cosmetic enhancements.
90. Look for the “Energy Star” logo. This designation from the Environmental Protection Agency means that the appliance exceeds minimum federal energy- use standards, usually by a significant amount.
91. Don’t forget to ask about warranties, service contracts, and delivery and installation costs.

WASHER, DRYER & LAUNDRY

92.Wash clothes in warm or cold water instead of hot water. Rinse in cold water; this can save you about $50 per year.
93. Put a dry towel in the dryer with each load of wet clothes. The towel will absorb dampness and reduce drying time, thus saving energy and money.
94. Fill washers and clothes dryers but do not overload them.
95. Clean the lint screen after each load of laundry and check the exhaust regularly. Clogged, dirty lint screens and exhausts can increase drying time and energy usage.
96. Use a front-loading washing machine; they require less water and energy than other washing machines.
97. Use less detergent and skip the extra rinse cycle on your washing machine to save water and time. If your clothes need to be rinsed twice, you’re using too much soap.
98. Adjust the water level. If you have a washer that allows you to control the load’s water level, adjust the level according to laundry load size. You can save energy by using less hot water for small loads.
99. Run full loads. Always run a full load in your washer or dryer. Running a partial load uses the same amount of energy as a full load – but you get less done. Running full loads allows you to run your washer or dryer less often.
Clothesline
100. Dry your clothes on an outside clothesline whenever possible
101. Rinse in cold water. Rinse water temperature has no effect on cleaning. Rinsing with cold water saves money by heating less water.
102. Place the washer close to the water heater. Water loses heat as it flows through pipes. When the washer is located near the water heater, hot water doesn’t have to travel as far to reach the washer, and less heat is lost. Insulating the pipes between the water heater and washer helps retain heat, too

FOR TRAVELERS

103. Put indoor and outdoor lights on timers.
104. Don’t leave your lights on 24/7 while you’re away.
105. Put water heater on the vacation setting, if it has one.
106. Choose green-rated hotels when travelling for business or pleasure.
107. Pull the plug on my battery chargers. Laptops, cell phones and digital cameras always draw power if they’re plugged in.
108. If you travel at 65 mph instead of 55, you are penalized by lowering your mileage 12.5 percent. If you get your vehicle up to 75 mph, you’re losing 25 percent compared with mileage at 55 mph.
109. A loaded roof rack can decrease an SUV’s fuel efficiency by 5 percent and that of a more aerodynamic car by 15 percent or more.
110. Stick with regular. If your car’s manufacturer specifies regular gas, don’t buy premium with the thought of going faster or operating more efficiently.
111. After starting the car in the morning, begin driving right away; don’t let it sit and “warm up” for several minutes.
112. If your windows don’t have a low-E coating, consider applying a self-adhesive film on the glass.
113. Use reusable containers for food storage instead of wrapping food in foil or plastic wrap.
114. Be aware of your paint you use – Use latex paint instead of oil-based paint. Oil-based paint is highly toxic.

AT OFFICE

115. Train myself or an employee to become an Energy Conservation Officer.
116.Making conservation someone’s responsibility will set your business on the path of saving energy.
117. Participate in an OPA commercial demand response program.
118. Install effective automatic door closer. Doors can’t save energy if they’re not closed
119. Educate and encourage employees who identify and implement energy savings.
120. Reward the people who work with me for their innovative, money-saving ideas.
121. Celebrate the implementation of successful energy efficiency measures.
122. Ensure meeting rooms are equipped with light switches.

AT WORK- EMPLOYEES

123. Turn off meeting room lights when not in use.
124. In the summer, unnecessary lighting can increase air conditioning load.
125. Dim, turn off or remove lights near windows in the daytime.
126. Use efficient task lighting where needed.
127. Unplug coffeemakers, toasters and microwaves. Make sure they’re unplugged on weekends and before shutting the office down for the holidays.
Girl_walking_down_stairs
128. Use the stairs instead of taking the elevator. It not only saves energy, it’s good exercise too.
129. Consider double-sided printing, re-using paper, and using e-mail instead of mailing or faxing documents.

WHILE DRIVING

130.When driving, avoid quick breaking and starting as it decreases mileage.
131. Don’t start the car before settling well in it. Read more on gas saving tips.
132. Avoid as much as possible getting stuck in traffic jams as they also decrease mileage.
133. Keep your tires properly inflated-under-inflated tires will reduce mileage.
134. Use premium unleaded gasoline because it is more efficient, although it’s debatable.
135. Use air conditioning only when it is necessary.
136. Open window or close them to adjust the heat instead of using the air conditioner.
137. Park in a shade to prevent your car from overheating and reliance on air-conditioning.
138. Service your air conditioner to ensure it works efficiently and it does not leak CFC’s.
139. Do not turn off your engine if you are stopping for less than 30 seconds.
140. Drive slowly, my mile-per-gallon indicator runs at highest efficiency at 55 mph speed on high ways.

OTHER ENERGY SAVERS

141. Get rid of spare refrigerators or freezers. An extra appliance can add more than $100 to your energy bills every year, and it’s a safety hazard for small children.
142. Keep outdoor hot tubs covered when not in use. If you have a pool, use a solar cover to use the natural warmth of the sun to heat the water.
143. Keep waterbeds covered with quilts or blankets to help retain their heat. You might also want to insulate the bottom with a sheet of rigid foam insulation.
144. Keep the garage door closed, especially during the winter.
145. If you need a new lawn mower, consider an electric model. They’re less expensive to operate (about three cents of electricity per use), 75 percent quieter, and they significantly reduce toxic emissions.
146. Instead of air-polluting and expensive charcoal or propane, try an electric or natural gas grill. They’re more economical and more convenient – you’ll never run out of fuel.
147. Unplug any electrical device that’s not being used. Many appliances, especially computers, televisions and VCR’s draw power even when turned off.
148. Place humidifiers and dehumidifiers away from walls and bulky furniture. These appliances work best when air circulates freely around them. Be sure to clean the unit often to prevent unhealthy mold and bacteria from developing.
149. If your home has no sidewall insulation, place heavy furniture like bookshelves, armoires and sofas along exterior walls, and use decorative quilts as wall hangings. This will help block cold air.
150.When you take a vacation, don’t forget to give your appliances a rest too. Turn off and unplug everything you can, set your water heater to the lowest setting and shut off the water supply to the dishwasher and washing machine.
151. Use public transit whenever possible.

IDENTIFICATION OF ENERGY CONSERVATION POTENTIAL IN EXISTING PLANTS

$
0
0


IDENTIFICATION OF ENERGY CONSERVATION POTENTIAL
IN EXISTING PLANTS
A. General
1.01      Energy saving is not new to the fertilizer industry.  Efficient use of raw materials and energy is normally one of the main areas attended to by corporate and plant management, maintenance personnel and operators.Moreover, with the steep increase in fuel and raw material prices during the last decade, production techniques have been improved to achieve more
efficient feedstock and energy use, compared to the substantially less efficient plants commissioned 10-15 years ago. However, because of urgent pressures of plant operation, corporate and plant management had generally not paid adequate attention to energy conservation. Prevailing economic conditions now provide the impetus for adopting new methods and techniques to economize on inputs.
1.02      Energy conservation programs at the plant level need an organized and systematic approach if their full potential is to be realized. Effective plant organizational measures and energy audits are necessary to track down losses, to identify possible measurement anomalies, to evaluate audit results both technically and economically, and to work out detailed energy conservation programs. These programs will usually consist of two or three distinct parts: improved housekeeping and maintenance (needing little or no investment); short-term investment (revamping) programs; and long-term (reconstruction) programs. While organizational measures, energy audits and good housekeeping can be of general applicability to fertilizer plants, revamping and reconstruction measures are always process-specific.
B. Organizational Arrangements
1.03      The organizational arrangements needed at the plant level to collect the required energy consumption information, analyze it adequately to facilitate preparation of an energy efficiency program specific for each plant facility, and monitor the implementation of the identified program, are the following:
(a) Organize a General Energy Audit, along the lines discussed below, by in-house specialists or by an outside agency (an energy audit firm or consultants with expertise in this field is normally required where revamping is considered) based on which energy conservation measures and investments can be designed;
(b)  Install an Energy Accounting System to initiate availability of energy utilization data on a regular basis. Initially this system may be rough and approximate, because a more accurate and detailed accounting system will be possible only after unit-by-unit energy audits have been carried out;
 (c) Establish the Position of Energy Coordinator, who should be responsible either to the production manager or to the works manager. He should be a process engineer with reasonable
experience in the fertilizer industry. In addition, it would be desirable for the works manager and/or the production manager to attend a general course on energy saving methods.
(d)  Initiate Unit-by-Unit Energy Audits as soon as everyone concerned becomes familiar with energy conservation. This analysis, under the supervision of the energy coordinator, should be made by a process technologist, and the energy accounting system referred to in (b) above should be refined for each unit studied. This is a step-by-step procedure,
explained further in the next section.
(e)  Install a Follow-up Program based on the above audits, with clearly established improved energy consumption standards endorsed by the top management. A regular periodic energy
accounting is necessary to measure maintenance of these standards, enabling management to constantly monitor the use
of energy.
1.04      Organizationally, it is important to have one person in the company, the energy coordinator, as the focal point for all energy-saving activities. It is not necessary to create a department for energy saving.
In fact, the creation of such a department may be counter productive since the operating managers should retain the main responsibility and motivation to achieve energy savings in the plant. The energy coordinator could have an assistant, but may use the existing staff of the technological, engineering, maintenance and project departments, for project preparation and implementation. If these departments do not have the required level of inrhouse knowledge on energy conservation, outside consultants with knowledge of the process under scrutiny could be utilized.
C. General and Unit Energy Audits
1.05      Several of the larger chemical and fertilizer companies have worked out detailed energy audit procedures for whole complexes and individual units. In complexes where people are not yet sufficiently energy-conscious, it may be especially desirable to start with a general energy audit of the whole complex with the assistance of a specialized outside consulting firm or operating company.
1.06      As noted earlier, the next step is to carry out detailed energy audits of individual units, including offsites and services. These audits should be in adequate depth to result in the identification and evaluation of definite energy saving proposals. In these audits, the following
factors should be given close attention:
(a) Establish the overall economics of the plant and the desirability of energy saving. Even after energy savings are achieved, some of the older plants may still have consumption levels much higher than modern plants and the economic viability of the plant could be doubtful. In this case, it may be more appropriate to close down the plant.
(b) Make an energy balance of inputs and outputs (including drains, stacks, etc.) within about 5% accuracy, to locate major areas of loss and inefficiency, looking especially at the balance of available energy.
(c) Review broadly the plant energy audit with a team (coordinated by the audit leader) consisting of the plant manager, plant engineer, process manager and energy coordinator, to identify major energy saving potentials;
(d) Review in detail the energy audit with a larger team including foremen and specialists in addition to the members mentioned under (e) above; and
(e) Prepare an action program in which costs and benefits are carefully identified and taken into account.

Birds have 'fundamental right to fly', they cannot be caged: Delhi HC

$
0
0

Birds have 'fundamental right to fly', they cannot be caged: Delhi HC

  constitutional right to live with dignity

  • HT Correspondent, Hindustan Times, New Delhi
  • |
  • Updated: May 17, 2015 22:02 IST

Migratory birds leaving their homes at Okhla Bird Sanctuary in Noida as the lake is drying during the breeding season of the birds. (Sunil Ghosh/HT Photo)


Birds have a “fundamental right to fly” and cannot be caged, the Delhi high court has said, issuing notice to an alleged bird trader and holding the trade as a “violation of the rights of birds”. A notice was also issued to the Delhi Police.

“Birds have fundamental rights, including the right to live with dignity and they cannot be subjected to cruelty by anyone…They deserve sympathy,” said Justice Manmohan Singh.
 Justice Singh’s ruling -- which came on a plea by People for Animals (PFA) -- overturned a trial court order which allowed the release of birds back to Md Mohazzim from whom they were rescued. The alleged bird trader faces criminal prosecution under the Prevention of Cruelty Act.
In its plea, the NGO claimed the trial court released the birds into Mohazzim’s custody despite concluding that he wasn’t the owner. It submitted photographs to the judge that purportedly show that Mohazzim kept the birds in small cages. The pictures did not make it clear whether their wings and tails were clipped.

Justice Singh expressed anguish that instead of being allowed to fly free, birds were “exported illegally to foreign countries without proper food, water or medical aid”.
“Running the trade of birds is in violation of the rights of the birds. They deserve sympathy,” the judge noted. He posted the matter for further hearing on May 28.
“Nobody is caring as to whether they have been inflicted cruelty or not despite a settled law that birds have a fundamental right to fly and cannot be caged and will have to be set free in the sky,” the court said.

“I have been informed by the learned counsel for the petitioner that more than thousands of birds are subjected to pain as the so called owner put them in small cages and sell them in the commercial market for his vested rights, despite of statutory and constitutional right to live with dignity,” the judge said in his order.
Viewing all 8156 articles
Browse latest View live