Quantcast
Channel: EHSQL(Environment-Energy ,Health,Safety, Security and Social Ac. ,Quality-Lab) Technical services
Viewing all 8115 articles
Browse latest View live

Government to Bring a new Agriculture Insurance Scheme soon, Says Agriculture Minister

$
0
0
Government to Bring a new Agriculture Insurance Scheme soon, Says Agriculture Minister
Union Agriculture Minister Shri Radha Mohan Singh has said that a new Agriculture Insurance Scheme (Krushi Bima Yojana) would be brought as the present scheme is not proving much beneficial to the farmers while facing wrath of natural calamities. Addressing mediapersons in Patna today, the Agriculture Minister reiterated that betterment of agriculture, villages and farmers are on the priority of the union government. He further added that health of soil is necessary for the agricultural production and productivity and therefore ‘Soil Health card’ is being provided to the farmers. Besides these, government is undertaking all adequate measures to provide irrigation to every field, marketing of agri-produce and enhancement of livestock quality. He told that by the budget time, details of such schemes will be brought forward.

The minister assured of no discrimination or politics with states while making efforts for the overall development of agricultural sector as it is a state subject. However, he expressed concern over non-utilisation of full allocation by states in respect of central schemes like the National Food Security Mission, National Agriculture Development Scheme, National Micro-Irrigation Scheme and National Bamboo Mission.

Underlining the importance of agricultural Universities in the agricultural development, he lamented that four ranges of Bihar- Munger, Gaya, Saran and Champaran- are not having Agriculture University and the state must take the appropriate steps to establish it. He informed that despite in principle approval of the Planning Commission and allocation of about rupees 1,000 crore in the year 2009, the Rajendra Agriculture University, Pusa, Bihar is yet to get the status of central university. He confided that state government would soon take steps in this regard and the Centre is ready to provide all possible assistance. He also added that if land is provided, a Fishery Research Institute will be set up in Muzaffarpur, Bihar.


***


DK/PK
(Release ID :105784)

Harness long-term Benefits by Investing in Biodiversity Conservation: Shri Javadekar

$
0
0
Harness long-term Benefits by Investing in Biodiversity Conservation: Shri Javadekar
Shri Prakash Javadekar addresses Convention on Biological Diversity (CBD) through Video-Message

Shri Prakash Javadekar, Minister of State Environment, Forests & Climate Change, and President of the Eleventh Conference of Parties (CoP-11) to the Convention on Biological Diversity (CBD), addressed CBD’s Fifth Meeting of the Working Group on Review Of Implementation (WGRI-5) held in Montreal, Canada from 16-20 June 2014, through a video message highlighting key issues related to biodiversity conservation. In his address, the Minister urged the parties to decide on final targets for resource mobilisation for implementation of the Strategic Plan, as delaying action would not only limit our choices for cost-effective action, but also jeopardise the ability of ecosystems to continually provide vital services.

In his address, Shri Javadekar also highlighted the importance of addressing poverty reduction as a cross-cutting issue of the Strategic Plan. He expressed confidence that these initiatives would help to harness long-term benefits by investing in biodiversity conservation. The meeting assumes significance in the context of preparing for the mid-term review of implementation of the Strategic Plan for Biodiversity 2011-2020, and its 20 Aichi targets. The ten-year framework for action by all countries and stakeholders to save biodiversity and enhance its benefits for people, had been welcomed by the United Nations General Assembly, as an overarching global framework to conserve and sustainable use of biodiversity. Its importance has also been reaffirmed in the Rio+20 outcomes.

Further, realising that the mission of the Strategic Plan was central to achieving sustainable development, the United Nations General Assembly had encouraged Parties to consider it in the elaboration of the post-2015 UN development agenda. The review came just before the midpoint of the UN Decade on Biodiversity, and presented an opportunity to redirect efforts to achieve the Aichi Biodiversity Targets.

WGRI-5 looked at progress made by Parties to implement the Strategic Plan for Biodiversity 2011-2020. Delegations also discussed technical and scientific cooperation under the Convention, the role of local and sub-national governments, and efforts to effectively engage stakeholders including the private sector. The meeting considered the mobilization of resources in support of the Strategic Plan for Biodiversity 2011-2020. Further, delegations also looked at the relationship between biodiversity and sustainable development and poverty eradication, including the linkages between biodiversity and the ongoing discussions in the United Nations General Assembly on Sustainable Development Goals.

The Indian delegation led by Shri Hem Pande, Additional Secretary, Ministry of Environment, Forests & Climate Change and India’s National Focal point to the CBD, participated at WGRI-5 meeting. Shri Pande also chaired this meeting as representative of CoP President.

Having successfully hosted the CoP-11 to the CBD in Hyderabad in October 2012, India is currently the President of CoP, till the next CoP to be held in Pyeongchang, Republic of Korea.

CP/GV
(Release ID :105793)

Storage Status of 85 Important Reservoirs in the Country as on June 19, 2014

$
0
0
Storage Status of 85 Important Reservoirs in the Country as on June 19, 2014


                              Live storage available in 85 important reservoirs of the country as on June 19, 2014 was 37.677 BCM which is 24% of total live storage capacity of these reservoirs. This storage is 103% of the storage of corresponding period of last year and 152% of storage of average of last ten years. The present storage position during current year is better than storage position of last year and average storage of last ten years.
                          Central Water Commission monitors live storage status of 85 important reservoirs of the country on weekly basis. These reservoirs include 37 reservoirs having hydropower benefit with installed capacity of more than 60 MW. The total live storage capacity of these reservoirs is 155.046 BCM which is about 61% of the live storage capacity of 253.388 BCM which is estimated to have been created in the country.

REGION WISE STORAGE STATUS:

a)      NORTHERN REGION
          The northern region includes States of Himachal Pradesh, Punjab and Rajasthan. There are 6 reservoirs in this region having total live storage capacity of 18.01 BCM. The total live storage available in these reservoirs is 7.19BCM which is 40% of total live storage capacity of these reservoirs. The storage during corresponding period of last year was 38% and average storage of last ten years during corresponding period was 26% of live storage capacity of these reservoirs. Thus, storage during current year is better than the corresponding period of last year and average storage of last ten years during the corresponding period.

b)     EASTERN REGION
        The Eastern region includes States of Jharkhand, Odisha, West Bengal and Tripura. There are 15 reservoirs in this region having total live storage capacity of 18.83 BCM. The total live storage available in these reservoirs is 4.72BCM which is 25% of total live storage capacity of these reservoirs. The storage during corresponding period of last year was 21% and average storage of last ten years during corresponding period was 13% of live storage capacity of these reservoirs. Thus, storage during current year is better than the corresponding period of last year and average storage of last ten years during the corresponding period.


c)      WESTERN REGION
      The Western region includes States of Gujarat and Maharashtra. There are 22 reservoirs in this region having total live storage capacity of 24.54 BCM. The total live storage available in these reservoirs is 6.10 BCM which is 25% of total live storage capacity of these reservoirs. The storage during corresponding period of last year was 27% and average storage of last ten years during corresponding period was also 20% of live storage capacity of these reservoirs. Thus, storage during current year is better than storage of last year and average storage of last ten years.

d)     CENTRAL REGION
      The Central region includes States of Uttar Pradesh, Uttarakhand, Madhya Pradesh and Chhattisgarh. There are 12 reservoirs in this region having total live storage capacity of 42.30BCM. The total live storage available in these reservoirs is 13.46 BCM which is 32% of total live storage capacity of these reservoirs. The storage during corresponding period of last year was 29% and average storage of last ten years during corresponding period was 11% of live storage capacity of these reservoirs. Thus, storage during current year is better than storage of last year and average storage of last ten years.

e)      SOUTHERN REGION
       The Southern region includes States of Andhra Pradesh, Karnataka, Kerala and Tamil Nadu. There are 30 reservoirs in this region having total live storage capacity of 51.37 BCM. The total live storage available in these reservoirs is 6.20 BCM which is 12% of total live storage capacity of these reservoirs. The storage during corresponding period of last year was 13% and average storage of last ten years during corresponding period was 19% of live storage capacity of these reservoirs. Thus, storage during current year is better than the corresponding period of last year and less than the average storage of last ten years during the corresponding period.

 The States of Punjab,Rajasthan,Odisha,Maharashtra, Uttar Pradesh,Madhya Pradesh, Chhattisgarh and Tamil Nadu are having better storage than last year for the corresponding period. On the other hand the States of Himachal Pradesh, Jharkhand, West Bengal and Tipura, Gujarat,Uttarakhand,Karnataka, Kerala are having lesser storage than last year for the corresponding period. The State of Andhra Pradesh is having equal storage to last year for the corresponding period.

Samir/jk


(Release ID :105757)

Cabinet Likely to Discuss Gas Price Hike Today

$
0
0

Energy Conversion

Unit Conversion
1 normal cubic metre (m³(n)) =1.054915 standard cubic metre (m³(st))
1 standard cubic metre (m³(st))=35.31 standard cubic foot (scf)
1 standard cubic foot (scf) =0.0283 standard cubic metres (m³(st))
100 standard cubic feet (scf)=2.83 standard cubic metres (m³(st))
1 kilowatt hour =3.6 megajoules (MJ)
1 kilowatt hour =3,412 Btu/hr
1 therm=29.3071 kilowatt hours (kWh)
1 therm =105.06 megajoules (MJ)
1,000,000 therms=29.3071 gigawatt hours (GWh)
1 bar=14.5 pounds/square inch (psi)
1000 mbar =1 bar
68.9 mbar=1 pound/square inch (psi)
m³ (st) - standard cubic metre natural gas: cubic metre natural gas at 101,325 Pa and 15°C, dry m³(n) - normal cubic metre natural gas: cubic metre natural gas at 101,325 Pa and 0°C, dry
scf - standard cubic foot natural gas: cubic foot natural gas at 14.73 psi (abs) and 60°F (15.5556°C), dry

Cabinet Likely to Discuss Gas Price Hike Today


Cabinet Likely to Discuss Gas Price Hike Today

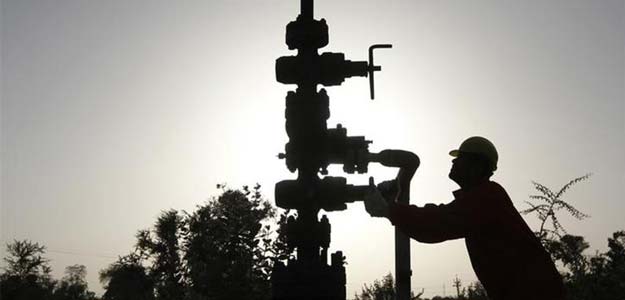
Oil minister Dharmendra Pradhan is likely to attend a Cabinet meeting on Wednesday, amid speculation that the government India could soon raise gas prices. Mr Pradhan is not a member of the cabinet committee, but can attend the meeting as a special invitee.
The previous UPA government did not raise prices of domestically produced natural gas from April 1 as planned, following the Election Commission's request to defer the move until the conclusion of elections in May. The UPA government had notified the Rangarajan panel formula which would have increased the gas prices to $8.4 per unit from $4.2 currently.
According to estimates, every dollar increase in gas price will lead to a 45 paise per unit increase in electricity tariff. CNG prices would increase by a minimum Rs. 2.81 per kg, while PNG prices will go up by Rs. 1.89 per unit for every dollar rise in gas prices. Urea prices will go up by Rs. 1,370 per ton.
Besides gas price hike, the Cabinet is also likely to discuss hikes in LPG and kerosene prices, sources said. There is speculation that the government may allow small monthly hike in LPG and kerosene prices, similar to the current pricing mechanism in diesel.
Currently, oil marketing companies are losing Rs. 33/litre on kerosene and Rs. 433 per LPG cylinder by selling them below market prices.
ONGC and Reliance Industries, both of which could be beneficiaries of gas price hike, traded weak today, down 1.2 per cent and 0.7 per cent. (With Agency Inputs)

Narendra Modi govt orders status quo on natural gas prices; $4.2 rate to continue till Sept-end

$
0
0

Narendra Modi govt orders status quo on natural gas prices; $4.2 rate to continue till Sept-end


The various options before the government included applying the Rangarajan formula unconditionally from July 1. (Reuters)The various options before the government included applying the Rangarajan formula unconditionally from July 1. (Reuters)
SummaryGovt orders status quo on natural gas prices for 3 months
The Narendra Modi government today postponed revision in natural gas prices by three months pending a comprehensive review.
Oil Minister Dharmendra Pradhan said the current rate of USD 4.2 per million thermal units will continue till September end.
The Centre was expected to decide on implementation of new gas pricing regime in the next two days. A series of discussions have been held between the Prime Minister's office, petroleum minister Dharmendra Pradhan and finance minister Arun Jaitley since Friday.
The government was tight-lipped on the likely proposals it was contemplating to implement. A senior petroleum ministry official, when asked on when the decision is expected, said, “Wait for 48 hours.”
The petroleum ministry is of the opinion that the issue of pricing of gas would need to be seen in the context of achieving the multiple objectives of incentivising domestic gas exploration and production on the supply side and meeting the higher subsidy outgo in successive budgets for the fertiliser and power sectors.
Therefore, the gas pricing need to strike a balance between the requirements of the exploration and production sector and the burden on the government exchequer.
India's natural gas output went down to 35.4 billion cubic metres (bcm) in FY14 from 47.56 bcm in FY12.
The various options before the government included applying the Rangarajan formula unconditionally from July 1, tweak the formula, allow higher price only for incremental production over and above the current levels or completely scrap the decision of UPA government.
There are several other issues surrounding implementation of the Rangarajan formula such as whether Reliance Industries' foreign partners – BP and Niko Resources – should be allowed to charge the higher gas price for output from once prolific KG-D6 basin; whether the pricing should be on gross calorific value or net calorific value, among others.

India's Population 2014

$
0
0

India's Population 2014


Current Population of India in 20141,270,272,105 (1.27 billion)
Total Male Population in India655,875,026 (655.8 million)
Total Female Population in India614,397,079 (614.4 million)
Sex Ratio940 females per 1,000 males
Age structure
0 to 25 years 50% of India's current population
Currently, there are about 51 births in India in a minute.
India's Population in 20121.22 billion
India's Population in 20111.21 billion

Current Population of India - India, with 1,270,272,105 (1.27 billion) people is the second most populous country in the world, while China is on the top with over 1,360,044,605 (1.36 billion) people. The figures show that India represents almost 17.31% of the world's population, which means one out of six people on this planet live in India. Although, the crown of the world's most populous country is on China's head for decades, India is all set to take the numero uno position by 2030. With the population growth rate at 1.58%, India is predicted to have more than 1.53 billion people by the end of 2030.

More than 50% of India's current population is below the age of 25 and over 65% below the age of 35. About 72.2% of the population lives in some 638,000 villages and the rest 27.8% in about 5,480 towns and urban agglomerations. The birth rate (child births per 1,000 people per year) is 22.22 births/1,000 population (2009 est.) while death rate (deaths per 1000 individuals per year) is 6.4 deaths/1,000 population. Fertility rate is 2.72 children born/woman (NFHS-3, 2008) and Infant mortality rate is 30.15 deaths/1,000 live births (2009 estimated). India has the largest illiterate population in the world. The literacy rate of India as per 2011 Population Census is 74.04%, with male literacy rate at 82.14% and female at 65.46%. Kerala has the highest literacy rate at 93.9%, Lakshadweep (92.3%) is on the second position and Mizoram (91.6%) is on third.

Present Population of IndiaEvery year, India adds more people than any other nation in the world, and in fact the individual population of some of its states is equal to the total population of many countries. For example, Population of Uttar Pradesh (state in India) almost equals to the population of Brazil. It, as per 2001 Population Census of India, has 190 million people and the growth rate is 16.16%. The population of the second most populous state Maharashtra, which has a growth rate of 9.42%, is equal to that of Mexico's population. Bihar, with 8.07%, is the third most populous state in India and its population is more than Germany's. West Bengal with 7.79% growth rate, Andhra Pradesh (7.41%) and Tamil Nadu (6.07%) are at fourth, fifth and sixth positions respectively. The sex ratio of India stands at 940. Kerala with 1058 females per 1000 males is the state with the highest female sex ratio. Pondicherry (1001) is second, while Chhatisgarh (990) and Tamil Nadu (986) are at third and fourth places respectively. Haryana with 861 has the lowest female sex ratio.

Some of the reasons for India's rapidly growing population are poverty, illiteracy, high fertility rate, rapid decline in death rates or mortality rates and immigration from Bangladesh and Nepal. Alarmed by its swelling population, India started taking measures to stem the growth rate quite early. In fact India by launching the National Family Planning program in 1952 became the first country in the world to have a population policy. The family planning program yielded some noticeable results, bringing down significantly the country's fertility rate. In 1965-2009, the contraceptive usage more than tripled and the fertility rate more than halved. The efforts did produce positive results, however, failed to achieve the ultimate goal and the population of India since getting independence from Britain in 1947 increased almost three times. Whereas India has missed almost all its targets to bring the rate of population growth under control, China's 'One Child Policy' in 1978, has brought tremendous results for the latter. The policy claims to have prevented between 250 and 300 million births from 1978 to 2000 and 400 million births from 1979 to 2010.

What is the Population of India 2014
According to recent estimates, Population of India in 2014 is 1.27 billion.

Current Population of India 2014

Rank State or union territory Population (2011 Census) Density (per km²) Sex ratio
01Uttar Pradesh199,581,477828908
02Maharashtra112,372,972365946
03Bihar103,804,6371102916
04West Bengal91,347,7361029947
05Andhra Pradesh84,665,533308992
06Madhya Pradesh72,597,565236930
07Tamil Nadu72,138,958555995
08Rajasthan68,621,012201926
09Karnataka61,130,704319968
10Gujarat60,383,628308918
11Odisha41,947,358269978
12Kerala33,387,6778591,084
13Jharkhand32,966,238414947
14Assam31,169,272397954
15Punjab27,704,236550893
16Haryana25,353,081573877
17Chhattisgarh25,540,196189991
18Jammu and Kashmir12,548,92656883
19Uttarakhand10,116,752189963
20Himachal Pradesh6,856,509123974
21Tripura3,671,032350961
22Meghalaya2,964,007132986
23Manipur2,721,756122987
24Nagaland1,980,602119931
25Goa1,457,723394968
26Arunachal Pradesh1,382,61117920
27Mizoram1,091,01452975
28Sikkim607,68886889
UT1Delhi16,753,2359,340866
UT2Puducherry1,244,4642,5981,038
UT3Chandigarh1,054,6869,252818
UT4Andaman and Nicobar Islands379,94446878
UT5Dadra and Nagar Haveli342,853698775
UT6Daman and Diu242,9112,169618
UT7Lakshadweep64,4292,013946
TotalIndia1,210,193,422382940

Quality Audit Checklist

$
0
0

Quality Audit Checklist

A quality audit checklist is a quality record that tracks the questions and responses during a quality audit. The quality audit is a valuable tool for continuous improvement. Audits ensure your quality assurance system is sound. Audits are also necessary for ISO 9001 registration.

To create an audit checklist, first reflect on the reason behind the audit. What kind of audit will it be? What audit category are you examining.

Types of Audits

  • 3rd Party Audits
  • 2nd Party Audits
  • 1st Party Audits
3rd Party Audit are done by an outside independent audit organization. In case of an ISO 9001 audit the independent organization is the registrar. They normally do not have an interest in the final outcome. The 3rd party could be a registrar, government employee, or a firm hired by the company. The result of the audit could be a certification, license, acceptance, or an award.
2nd Party Audit are Audits from those who have a deep interest in the final outcome. This could be you auditing your suppliers, or your customers auditing you. The audit could be called a survey or an assessment.
1st Party Audits are audits done internally. They are a management tool with the emphasis on continuous improvement. The auditor(s) must be independent of the audit area. The audit should be aligned with the company goals and metrics.

Audit Categories

  • System Audit
  • Conformance Audit
  • Compliance Audit
  • Process Audit
  • Product Audit
  • Department Audit
System Audits are looking at a particular system which includes multiple processes and can spread across several employees and departments. The audit of your calibration system can be consider a system audit. Your interaction chart lists your systems.
Conformance Audits are audits to define system requirements. These are global in nature. For example a 3rd party audit of your ISO 9001 system is a conformance audit.
Compliance Audit is an audit to regulatory requirements. This includes government agency audits.
Process Audit is a focused audit on a set of processes within your organization. It examines adherence to procedures and specifications during production or service activities.
Product Audit is a focus audit on the product itself. This may be an inspection activity or an out of the box audit.
Department Audit is a focus audit on one department that looks at the processes, specifications, and systems in one department only. It will look at the different operations with in that department. It will also examine department organization and training.

Audit Stages

  • Determine the audit focus
  • Prepare for the audit
  • Perform the audit
  • Report the findings in the initial findings report
  • Determine the corrective action
  • Update the findings report with the corrective action
  • Conduct the corrective action
  • Update the findings report when actions are completed
  • Follow Up
  • Closure
The audit focus is dependent on the organization needs. If it is a system audit, use your interaction chart to determine the system focus. If there are many problems with a particular process then conduct a process audit on that process. If there is a department with many issues then conduct a department audit.
You may want to issue an internal audit engagement letter to the auditee.
During the audit preparation, determine the quality audit checklist. This checklist is the audit plan. During preparation, review the procedures, standards, specifications and / or work instructions. These documents help you determine the quality audit checklist. Record audit questions on the checklist.
During the audit performance follow these guidelines
  • Do not be biased
  • Keep an open mind
  • Do not be argumentive
  • Be patient
  • Remind the participant that the audit is for continuous improvement
  • Always state the facts
  • Do not correct the person on the spot.
  • Report accurately and clearly
  • Be familiar with the procedure
During the initial finding report, document the issues found. State the facts and provide evidence. Use names and demonstrate the findings. Show quality records for evidence. Apply the quality audit checklist as the basis for the findings report.
After the initial findings report, provide a copy to the corrective action team. Have a corrective action team meeting to issue the corrective actions. Document the corrective actions on the findings report. Be sure responsibilities and due dates are assign for the actions.
The team will then complete the corrective actions. Document the completion of the corrective actions on the findings report.
When all actions are completed, close out the report.

Audit Schedule

For ISO 9001 certification, predetermine the management systems audit schedule. Use your interaction chart to establish the necessary systems to schedule. I recommend not scheduling out all of the system audits. Instead keep a 3 to 6 month schedule and update this every month. This will allow you to audit the concerned areas.
I also recommend using a software application to track your audits. The software can track audit questions, schedule, results, and corrective action.

Quality Audit Benefits

  • It drives continuous improvement
  • Lets management know problems or potential problems
  • Provides input into management decisions
  • Accesses training and effectiveness
  • Shows management support of the quality program
  • Verifies compliance

Quality Audit Mistakes

These mistakes prevent an effective audit.
  • Auditing with the “gotcha” attitude
  • Finding faults and not facts
  • Not recognizing that the audit is people focused
  • Not properly defining the purpose and scope
  • Not using a quality audit checklist
  • Not issuing corrective action
  • Not conducting follow up on the corrective action
  • Not using a team approach to issuing corrective actions

Internal Audit Plan

$
0
0
The internal audit plan consist of particular questions that you ask during the audit. These questions provide insight into your QA systems.


The audit plan could cover a system, process or department audit. The plan references your organization systems, or the ISO 9001 element for each question. The plan could cover an element from your interaction chart. The audit plan is a document that list the planned questions. A final report references the internal audit plan and provides the answers to those questions.
Here are some questions that I like to quiz employees during an departmental ISO 9001 audit.

Yes / No Questions

Do employees know the quality policy?

Do employees know the quality objectives and understand them with regards to their function?

Do employees know where their procedures are located?

Are all procedures and specifications controlled?

Are all forms current in the department?

Do employees know what is the most current revision of the document?

Can employee identify which documents cover inspection?

Can employee identify which documents contain the specifications?

Does employee know the specifications for the critical parameters?

Do employees know when changes are made to the process?

Do employees follow the inspection procedures?

Are the inspections documented?

Are inspection records completely filled in?

Do inspection records results agree with specification requirements?

Can employees locate the procedure for the equipment or process they are conducting?

Does the procedure for the equipment or process actually reflect employee’s methods?

Do employees send parts to MRB when inspection does not meet specifications?

Can the parts be tracked to all raw materials?

Can employee describe how to select next work item?

Does employee know the process on ordering goods?

Does employee know the approval process for a purchase order?

Is the equipment in the PM (Preventive Maintenance) system? Are there records for PM?

Are all critical raw materials labeled with accept stamps or traceable to an accept stamp?

Have all critical raw material been inspected and approved?

Are all measuring equipment labeled with measurement status?

Are all calibrations within due date?

Do employee know if testing equipment is OK to use?

Do calibration records reflect findings for the equipment?

Do employees know what to do with non conforming parts?

Are production status labels properly used?

Are storage containers properly labeled?

Are there training records for each employee?

Is the training effective?

Are employee training needs determined?

Are training needs being addressed by the supervisor?

Are employees involved in continuous improvement teams?

Do employees know what to do when an out of control condition exists?

Is department clean?

Does operator maintain cleanliness?

Are employees following safety procedures?

Do employees know where the MSDS are located?

Are employees properly storing tooling?

These are yes / no questions for the internal audit plan


Open End Questions

Tell me about the quality policy.

What quality objective do you affect?

How do you know these procedures are OK to follow?

Tell me about your work process.

Show me this process in your procedure.

What is the specification for this inspection?

What do you do when you find a defective part?

What is the traceability for this product?

Show me how you record the inspection.

How do you know this product is good?

What do you do when you see an out of control point?

How do you order supplies?

What do you do when you encounter a production problem?

What type of training have you received?

How do you know if this measuring equipment is ok to use?

What do you do when a piece of equipment breaks down?

These are open end questions for the internal audit plan


A gas leakage and blast in the GAIL pipeline in East Godavari district’s Nagaram village killed 14 people

$
0
0

14 killed in blast at GAIL pipeline in Andhra Pradesh

Hindustan Times Prasad Nichenametla, June 27, 2014
First Published: 08:06 IST(27/6/2014) | Last Updated: 10:38 IST(27/6/2014)
A gas leakage and blast in the GAIL pipeline in East Godavari district’s Nagaram village killed 14 people and injured several others on Friday morning.
The incident occurred around 6 am when many of the villagers were still sleeping. The dead were mostly people living in the huts in the coconut groves through which the gas pipeline passes. The bodies are charred beyond recognition.
The impact of the blast could be seen in the flames that leapt over 200 metres in the air. Most of the village took the impact and people ran to safety in horror. Half a dozen fire engines were rushed to the spot to control the fire.

GAIL explosion in AP, 15 feared dead

GAIL explosion in AP, 15 feared dead
    15 persons were feared dead and 32 others injured after an exposion in a gas pipeline belonging to GAIL in East Godavari district in Andhra Pradesh on Friday. The death toll is likely to increase.

    The injured have been moved to the local hospitals in Razole, Amalapuram and Kakinada for medical support. The incident took place around 6 AM today at Nagaram Village in Amalapuram mandal.

    Speaking on the incident, GAIL Chairman BC Tripathi said that a fire broke our in 18-inch pipeline at a refinery complex. He added that exact reasons for the incident are not known yet. More efforts are going on to rescue the people from the arena.


    "My thoughts with the families of those who lost their lives in the GAIL Pipeline fire in AP. Prayers with the injured.", Prime Minster Narendra Modi Tweeted.

    AP CM Chandrababu Naidu tweeted,"Asked Dy CM Chinarajappa to go to the ONGC pipeline blast site and provide required support. We need a preventive"
The injured were rushed to the hospitals in Kakinada, the district headquarters.
Prime Minister Narendra Modi has expressed grief over the incident.
"My thoughts with the families of those who lost their lives in the GAIL Pipeline fire in AP. Prayers with the injured," he tweeted.
 Narendra Modi        @narendramodi Follow
I have spoken to the Petroleum Minister, Cabinet Secretary & GAIL Chairman and asked them to ensure immediate relief at the accident site.
 Andhra Pradesh home minister N Chinarajappa rushed to the spot. Naidu who is in Delhi expressed shock over the incident. Naidu along with the union petroleum minister are leaving from Delhi to visit the site.
The incident lead to angry reactions from the villagers, who blamed the GAIL authorities as not taking enough precautions to avoid such incidents.

The cause of gas leakage from the pipe are not known yet.

Fourteen Killed In India Gas Pipeline Blast - 27 June 2014

SOIL TESTING - Introduction

$
0
0
 The farmers find it extremely difficult to know the proper type of fertilizer, which would match his soil. In using a fertilizer he must take into account the requirement of his crops and the characteristics of the soil.
            The basic objective of the soil-testing programme is to give farmers a service leading to better and more economic use of fertilizers and better soil management practices for increasing agricultural production. High crop yields cannot be obtained without applying sufficient fertilizers to overcome existing deficiencies. 
            Efficient use of fertilizers is a major factor in any programme designed to bring about an economic increase in agricultural production. The farmers involved in such a programme will have to use increasing quantities of fertilizers to achieve the desired yield levels. However the amounts and kinds of fertilizers required for the same crop vary from soil to soil, even field to field on the same soil. The use of fertilizers without first testing the soil is like taking medicine without first consulting a physician to find out what is needed. It is observed that the fertilizers increase yields and the farmers are aware of this. But are they applying right quantities of the right kind of fertilizers at the right time at the right place to ensure maximum profit? Without a fertilizer recommendation based upon a soil test, a farmer may be applying too much of a little needed plant food element and too little of another element which is actually the principal factor limiting plant growth. This not only means an uneconomical use of fertilizers, but in some cases crop yields actually may be reduced because of use of the wrong kinds or amounts, or improper use of fertilizers. 
            A fertilizers recommendation from a soil testing laboratory is based on carefully conducted soil analyses and the results of up-to-date agronomic research on the crop, and it therefore is most scientific information available for fertilizing that crop in that field.
             Each recommendation based on a soil test takes into account the values obtained by these accurate analysis, the research work so far conducted on the crop in the particular soil areas, and the management practices of the concerned farmer. The soil test with the resulting fertilizer recommendation is therefore the actual connecting link between agronomic research and its practical application to the farmers’ fields. However, soil testing is not an end in itself. It is a means to an end. A farmer who follows only the soil test recommendations is  not assured of a good crop. Good crop yields are the result of the application also of other good management practices, such as proper tillage, efficient water management, good seed, and adequate plant protection measures. Soil testing is essential and is the first step in obtaining high yields and maximum returns from the money invested in fertilizers. 

How to collect a soil sample

  1. Sample each field separately. However, where the areas within a field differ distinctly in crop growth, appearance of the soils, or in elevation, or are known to have been cropped or fertilized and manured differently, divided the filed and sample each area separately.
  2. Take a composite sample from each area. Scrape away surface litter, then take a small sample from the surface to plough depth from a number of spots in the field (10 to 15 per acre). Collect these samples in a clean bucket or some such wide container.
  3. Where crops have been planted in lines (rows), sample between the lines.
  4. Do not sample unusual area. Avoid areas recently fertilized, old bunds, marshy spots, near tress, compost piles, other non-representative locations.
  5. Take a uniform thick sample from the surface to plough depth. If a spade or a trowel is used, dig a v-shaped hole, then cut out a uniform thick slice of soil from bottom to op of the exposed soil face, collect the sample on the baled or in your hand and place it in the bucket.
  6. Pour the soil from the bucket on a piece of clean cloth or paper and mix thoroughly, discard, by quartering, all but 1 to 2 lbs. of soil. Quarterly may be done by mixing sample well, dividing it into four equal parts, then rejecting two opposite quarters, mixing the remaining two portions, again dividing into four parts and rejecting two opposite quarters, and so on. The sample should be dried in the shade for an hour or two before it goes into the cloth bag container.
  7. Each cloth bag should be large enough to hold a pound or two of soil, and should be properly marked to identify the sample.
  8. Fill out the soil sample information sheet for each sample. These forms may be sent separately to the laboratory or enclosed with the soil sample.
  9. Address the samples to the Soil Chemist, Soil Testing Laboratory, Goal Ghar, Port Blair.
  10. Keep a record of the areas sampled and a simple sketch map for reference when you get the soil test and fertilizers recommendation report from the soil testing laboratory.

  ROLE OF THE EXTENSION SERVICE IN SOIL TESTING 
The actual analysis of the sample and the making out of fertilizer recommendation is only part of the soil testing service. To a large measure, the efficiency of this service depends upon the care and effort put froth by extension workers and farmers in the collection and dispatch of samples to the laboratory. Its effectiveness also depends upon the proper follow-through of the fertilizer recommendations, including the establishment of result demonstrations on farmer’s fields to induce the farmers to follow the fertilizer recommendations. In this work the staff of the extension service play the most important role, since they are the people directly in contact with the farmers or this reason, the soil chemist in charge of the laboratory must give periodic and through training to the extension staff on these subjects.
COLLECTION OF SAMPLES 
             A useful soil testing service starts with the collection of representative soil samples. A fertilizer recommendation made after analyzing the soil can only as good as the sample on which it is based. Actually the one to ten grams of soil used for each chemical analysis should represent as accurately as possible the entire surface six inches of soil, weighing about 2 million pounds per acre. The importance of taking a representative composite sample is, therefore, self-evident. One field can be treated as a single sampling unit only if it is relatively uniform and does not exceed approximately five acres. Variations in slope, colour, texture, management, and cropping pattern should be taken into account and separate composite soil sample adequately representing the field, small portions of surface soil should be collected to depth of six inches from at least ten well-distributed spots in the field, mixed well, and about ½ kg of representative sample sent to laboratory. 
            Proper sampling tools are essential for collection of good soil samples. For a soft. Moist soil, the soil tube, phowda (spade), or khurpi (trowel) are usually quite satisfactory.
For harder soils, a screw type auger, or an adze might be more convenient. Post hole augers are convenient for sampling excessively wet areas like paddy fields. An extension worker whose duties include collection of soil samples should be supplied with at least a few of these tools, and also a plastic bucket. The phowda, khurpi and adze are very common implements available in most hardware shops and so there should be no difficulty in procuring these implements. 
            The farmers should be given help in filling out the soil sample information sheet with an ex-plantation of any items not understood. It should be remembered that the information sheet is very vital part of procedures that go to make a good soil test recommendation. This sheet must supply all of the background information that, in combination with the results of the analysis, makes possible an accurate fertilizer recommendation for a certain crop, for that particular field. Factors such as crop variety, slope of land, irrigation and drainage facilities, and pervious cropping seasons affect the amounts of fertilizer to be applied to particular crop. Any peculiarities noted in the soil or in the vigor or the crop would be very valuable information on the soil sample information sheet as a basis for making an adequate fertilizer recommendation. In the absence of this information, the soil chemist must base his recommendation upon the soil test values alone, and more often than not the farmer will receive an adequate fertilizer recommendation.

Pipeline fire:Toll reaches 17, case of negligence against GAIL

$
0
0

Pipeline fire:Toll reaches 17, case of negligence against GAIL


Blazing fire after an explosion at a gas pipeline of GAIL in Nagaram village in East Godavari district of Andhra Pradesh on Friday. (PTI)Blazing fire after an explosion at a gas pipeline of GAIL in Nagaram village in East Godavari district of Andhra Pradesh on Friday. (PTI)
The toll in the deadly blast and fire, apparently caused by leakage from a GAIL gas pipeline here, today rose to 17, even as Andhra Pradesh police registered a case of negligence against the state-run firm.
Two persons, including a girl, succumbed to injuries today. The condition of five among the 20 injured who have received around 80 per cent burns remains critical, police said.
"A 4-year-old girl and a man died today at a private hospital in Kakinada. With this the toll has risen to 17," East Godavari District Superintendent of Police G Vijay Kumar told PTI.
The massive blaze started early yesterday morning, apparently after leaked gas from the pipeline got ignited when a tea vendor lighted his stove. Gigantic flames scorched houses, coconut palms and everything else in a 1.5 km radius.
A case was today registered against the Gas Authority of India Limited (GAIL), after examining eye-witnesses, recording statements of victims' relatives and based on preliminary investigation, a police officer said.
Several villagers have alleged that they had complained about foul smell of gas emanating from leaks in the pipeline, but no repair was undertaken by the company.
The case was registered under sections 304 A (causing death by negligence), 338 (causing grievous hurt by act endangering life or personal safety of others) and 286 (negligent conduct with respect to explosive substance) of the Indian Penal Code, the senior police officer said.
Meanwhile, a Centre-appointed committee today started a separate probe after inspecting the site of tragedy.
East Godavari district police have formed a special team to carry out their investigation. "We are examining documents related to the pipeline. GAIL officials will also be questioned," the senior police officer said.
The villagers had alleged that the pipeline was over two decades old and was rusting.
The investigators would check if the public sector company had taken necessary safety measures for the gas pipeline which passes through a populated area in the village.
Meanwhile, R K Singh, who heads the high-level probe panel of the Union Government, said it had started collecting samples from the site and in a couple of days it would be able to throw some light on the cause of the mishap.
"Reasons...we are yet to establish...we are looking at different possibilities. But as of now we are not able to come to a specific reason," Singh, Joint Secretary (Refineries) in the Ministry of Petroleum and Natural Gas, said after site inspection.

Reactions of Polyelectrolytes With Other Water Treatment Chemicals

PM Narendra Modi at PSLV-C23 launch at Sriharikota

$
0
0

PM witnesses successful launch of PSLV-C23 in Sriharikota
Calls for maximizing use of space science in governance and development
“India’s space programme driven by a vision of service to humanity”
“Develop a SAARC satellite as a gift from India”


The Prime Minister, Shri Narendra Modi, today witnessed the successful launch of the Polar Satellite Launch Vehicle – PSLV-C23 from Sriharikota. In his congratulatory address at the Mission Control Centre after the landmark launch, the Prime Minister called upon the space community to proactively engage with all stakeholders to maximize the use of space science in governance and development. India must fully harness this expertise in space technology in the developmental process for social change, economic development and resource conservation, he added.

Speaking of India’s age-old ethos of the whole world being one family, the Prime Minister said India’s space programme is driven by a vision of service to humanity, not a desire of power. He said India has a rich heritage of science and technology, including space. Shri Modi said the works of our ancestors, who included visionaries like Bhaskaracharya and Aryabhata, still continue to inspire generations of scientists. He added that India must share the fruits of its advancement in space technology with the developing world, and neighbours in particular. He called upon the space community to take up the challenge of developing a SAARC satellite that can be dedicated to our neighbourhood as a gift from India.

Shri Modi said we can be proud of the Indian space programme, which is fully indigenous, developed in the face of great international pressure and hurdles. He described it as a domain where “we have pushed beyond mediocrity to achieve excellence.” He said the moon mission was inspired by the vision of former Prime Minister, Shri Atal Bihari Vajpayee. Among ongoing projects, Shri Modi referred to the Mars Mission, and the satellite-based navigation system.

Referring to the benefits of space technology for the common man, the Prime Minister said it drives modern communication, empowers children in remote villages with quality education, and ensures quality healthcare to all, through telemedicine. He said it has a critical role in realizing the vision of a Digital India – the power of 125 crore connected Indians.

The Prime Minister said continued progress in space must remain a mission of high priority. He called for developing more advanced satellites and expanding our satellite footprint. He said India has the potential to be the launch service provider of the world and must work towards this goal.

The Prime Minister called for involving India’s youth with space. Shri Modi said he was pleased to have met the young scientists as Sriharikota, and admired their work and their achievements. He commended Dr. K. Radhakrishnan for his leadership, and said India’s space programme is the best example of his vision of scale, speed and skill. He wished the team of scientists the best as they prepare to insert our spacecraft into the orbit of Mars in a few months.

In a speech made in a combination of English and Hindi, Shri Modi spoke of the Tapasya made by generations of scientists, in a long journey from Upanishad to Upagrah. He remarked that he had met four generations of scientists during his visit to ISRO.

Andhra Pradesh Governor Shri Narasimhan, Andhra Pradesh Chief Minister Shri Chandrababu Naidu, Minister of Parliamentary Affairs Shri Venkaiah Naidu, MoS, PMO Dr. Jitendra Singh, Secretary Space Dr. Radhakrishnan, and eminent scientists Prof U R Rao, Dr. Kasturirangan were present on the occasion.


***
PM Narendra Modi at PSLV-C23 launch at Sriharikota


June 30, 2014 Author: admin
The following is the text speech of the Prime Minister at the launch of PSLV-C23 on the morning of 30th June 2014
My congratulations to our brilliant space scientists, and the Department of Space; for yet another successful launch of the Polar Satellite Launch Vehicle! We have perfectly placed 5 satellites into their orbits 660 km above the Earth.
This fills every Indian’s heart with pride. And I can see it reflected in the joy and satisfaction on your faces.
Fascinated by Space Technology, I feel specially privileged to witness this event in person.
India’s advanced Space Program, puts her in an elite global group of 5-6 countries today. This is one domain, in which we are at the international cutting edge. A domain in which we have pushed beyond mediocrity to achieve excellence.
We have launched satellites of advanced nations. PSLV itself has launched 67 satellites; of which 40 have been foreign satellites, coming from 19 countries. Even today’s satellites, are all from developed nations – France, Canada, Germany and Singapore. Truly, this is a global endorsement of India’s space capabilities.
Inspired by Atal ji’s vision, we have sent a mission to the Moon. Another is on its way to Mars as we speak. I personally follow it with great interest. We have also developed our own satellite-based navigation system. I am told this will be fully deployed by 2015.
Moreover, we can be proud that our space program is Indigenous. We have developed it despite international hurdles.
Generations of our space scientists have worked to make India a self-reliant space power. We owe them a big thank you.
Our journey into Space has come a long way from its humble beginnings. It has been a journey of many constraints and resource limitations. I have seen photographs of rocket cones being transported on bicycles. Our first satellite, Aryabhatta, was made in industrial sheds in Bangalore.
Even today, our program stands out as the most cost effective in the world. The story of our Mars Mission costing less than the Hollywood movie Gravity, had gone viral on social media recently. Our scientists have shown the world, a new paradigm of Frugal Engineering, and the power of Imagination. Friends, this success of ours has deep historical roots.
India has a rich heritage of science and technology, including in the field of space. An understanding of the cosmos, and its relationship to Life and Science; is deeply rooted in our ancient thought and knowledge. Our ancestors had conceived of ideas like ‘Shunya’ and ‘flying objects’, long before others. The works of visionaries like Bhaskaracharya and Aryabhata, continue to inspire scientists.
Many misunderstand space technology to be for the elite. That it has nothing to do with the common man. I however believe, such technology is fundamentally connected with the common man. As a change agent, it can empower and connect, to transform his life. Technology opens up new opportunities of development. And gives us new ways of addressing our challenges.
Space may seem distant, but is an integral part of our daily life today. It drives our modern communication, connecting even the remotest family to the mainstream. It empowers the child in the farthest village with quality education, through Long-distance Learning. It ensures quality healthcare to the most distant person, through Tele-medicine. It enables the youth in a small town, with various new job opportunities. Satellite technology has made distance irrelevant. It effectively enables us to reach the unreached. It helps us connect virtually, where physical connections are difficult.
It has a critical role, in realizing the vision of a Digital India – the power of 125 crore connected Indians.
GIS technology has transformed policy planning, and implementation. Space imaging enables modern management, and conservation of water resources – through GIS-driven watershed development. It has been deployed in our urban planning, to scientifically manage our growing towns and cities. It has also become an important tool, in better managing, and conserving our natural resources. Whether it be the Himalayan glaciers, oceans and forests, coastal resources or our mineral wealth. Space imagery is improving our land management systems, bringing wasteland into productive use. Our next frontier, should be to extend the same to land records, bringing in accuracy and transparency for the common man.
Space technology has also evolved into an invaluable asset in disaster management. Satellite communication channels, often end up being the only mode of communication. Accurate advanced warning, and tracking of Cyclone Phailin, saved countless lives recently.
We must as a nation, fully harness this expertise in space technology, in our developmental process. For social change, economic development, and resource conservation. The possibilities are limitless. The benefits enormous. I urge the Department of Space, to proactively engage with all stakeholders, to maximize the use of space science in Governance and Development. Deepening of State involvement will be critical for the same.
Friends, India is rooted in our age-old ethos of Vasudeiva Kutumbakam. Of the whole world being one family. India’s Space program, is thus driven by a vision of service to humanity. Not by a desire of power. For us, it is an important instrument of our human progress.
We must therefore, share the fruits of our technological advancement, with those who do not enjoy the same. The developing world, and our neighbours in particular. We already share Disaster Management data with over 30 countries. We provide benefits of Tele medicine to Afghanistan and African countries. But we must do more!
Today, I ask our Space community, to take up the challenge, of developing a SAARC Satellite – that we can dedicated to our neighbourhood, as a gift from India. A satellite, that provides a full range of applications and services, to all our neighbours. I also ask you, to enlarge the footprint of our satellite-based navigation system, to cover all of South Asia.
Friends, continued progress in space must remain a national mission. We must keep enhancing our space capabilities. We must develop more advanced satellites; with higher computing, imaging and transmitting power. We must expand our satellite footprint, in terms of frequency and quality. We must also strengthen our international partnerships in all areas of Space technology.
India has the potential, to be the launch service provider of the world. We must work towards this goal. Construct the required new launch infrastructure. And extend our launching capabilities to heavier satellites.
Development of human resources, will be critical for our future success. I was very pleased to meet our young scientists here. I admire their work and their achievements. Let us link up with more universities and colleges, to develop our future leaders in this area. We must also involve our youth at large, with Space.
You have already started putting a lot of space-related data online, through your Bhuvan space portal. What steps can we take to further increase access to data, by students and researchers? Let us use Social Media to further engage with our youth. Let us invite school and college children, to witness launches and visit Space centres. Could we also think of developing, a state-of-the-art, interactive, digital Space Museum?
In conclusion, I want to emphasize how Technology is central to Development. It touches one and all, and is an important instrument of our national progress.
India’s Space program is a perfect example of my vision of Scale, Speed and Skill. Our Space scientists have made us global leaders, in one of the most complex areas of modern technology. This shows that we can be the best. If we apply ourselves, we can meet the aspirations of our people.
Let us take inspiration from today’s mission. Dedicate ourselves to accelerate our nation’s progress. I am confident We Can!
I thank the Department of Space, for this opportunity to witness the launch. I commend Dr. K. Radhakrishnan for his leadership. I wish the team the very best, as you prepare to put our spacecraft into the Mars Orbit, in a few months from now. I wish you every success, as you strive to master new technologies, and conquer new frontiers of Space. May all your endeavours meet with success!
Thank you!
The Polar Satellite Launch Vehicles

$
0
0

The Polar Satellite Launch Vehicles

,usually known by their abbreviation PSLV would be the first in business launch automobile of ISRO. PSLV is able to launching 1600 kg satellites within 620 km sun-synchronous polar orbit along with 1050 kg satellite in Geo-synchronous transfer orbit. From the standard setting, it steps 44.4 m tall, with a lift off weight of 295 tonnes. PSLV possesses four phases using sound and liquefied propulsion programs alternately. The 1st stage is among the largest sound propellant boosters on this planet and carries 139 tonnes of propellant. A cluster of six to eight strap-ons attached to the 1st stage generator, four that are ignited on the ground and a couple are air-lit.
 The reliability rate of PSLV have been superb. There had been 24 continually successful flight of PSLV, until eventually November 2013. Which consists of variant layouts, PSLV possesses proved their multi-payload, multi-mission capability in a single launch and Geo-synchronous start capability. From the Chandrayaan-mission, another alternative of PSLV by having an extended version of strap-on generators, PSOM-XL, the actual payload haul was superior to 1750 kg within 620 km SSPO. PSLV possesses rightfully attained the status of workhorse start vehicle of ISRO
 http://encryptechno.com/wp-content/uploads/2013/11/PSLV-subsystems.jpg46240414

WISHING A BELATED VERY HAPPY BIRTH DAY TO THE KING OF NAGARJUNA GROUP SHRI K.S. RAJU GARU INNOVATIVE LEADER IN INDUSTRIAL SECTOR

$
0
0

Water in industry: an environmental and economic challenge


SCIP Sinofrench Water Plant. Picture: ROBIN BASILE
Combating pollution, increasing scarcity and protection of water resources, tightening of environmental regulations, drought… Protecting the environment and improving the competitiveness of major challenges that are central to industrial companies’ concerns regarding securing their water supplies and ensuring the long-term future of their business activities. Go to the eMag for an overview of the challenges that these companies must meet today.

Dealing with increasingly scarce resources: a crucial challenge

The continual rise in the world’s population is invariably accompanied by an increase in demand for manufactured products, which implies an increase in the amounts of water used. These industrial companies, for which water plays a major role in their industrial processes, are naturally in search of sustainable water treatment solutions in order to protect the environment and limit pollution – by treating water before discharging it into the natural environment – and to save water resources – primarily by re-using waste water. For the industrial sector, the sustainable management of water resources involves a triple challenge: it is a question of responsibility, image and obligation, given that the regulations governing the sector are so stringent. It is also an economic necessity in order to guarantee ongoing production – there is no production without water – and to therefore ensure the long-term future of their business activities in an increasingly competitive environment.

Water: a strategic resource for the industrial sector

Water is a fundamental resource for the industrial sector, which is the second largest consumer of water after agriculture, and uses 22% of the water volumes drawn in the world (Source: French Development Agency, or AFD) which represents over 800 billion m³ of water per year. According to the McKinsey report entitled “Charting our water future”, which was published in November 2009, this figure is expected to exceed 1,500 billion m3 by 2030. In this environment, we will invariably have to make choices between different users over the coming years, and plan to use water in a more sensible and efficient way. In line with this approach, SUEZ Environnement is offering a wide range of innovative solutions for managing water resources, process water production, the treatment of waste water, its re-use, and the recovery of sludge and by-products, via Degrémont Industry.

Meeting industry’s requirements throughout the water cycle

Process water, injection water, boiler fuel water, cooling water, purified water, polluted ground water, waste water, recycled water, etc. SUEZ Environnement is involved at every level of the water management process for the industrial sector, upstream and downstream of industrial production, and is industrial companies’ preferred partner for meeting new challenges relating to the water cycle.

Government to Bring a new Agriculture Insurance Scheme soon, Says Agriculture Minister

$
0
0
Government to Bring a new Agriculture Insurance Scheme soon, Says Agriculture Minister
Union Agriculture Minister Shri Radha Mohan Singh has said that a new Agriculture Insurance Scheme (Krushi Bima Yojana) would be brought as the present scheme is not proving much beneficial to the farmers while facing wrath of natural calamities. Addressing mediapersons in Patna today, the Agriculture Minister reiterated that betterment of agriculture, villages and farmers are on the priority of the union government. He further added that health of soil is necessary for the agricultural production and productivity and therefore ‘Soil Health card’ is being provided to the farmers. Besides these, government is undertaking all adequate measures to provide irrigation to every field, marketing of agri-produce and enhancement of livestock quality. He told that by the budget time, details of such schemes will be brought forward.

The minister assured of no discrimination or politics with states while making efforts for the overall development of agricultural sector as it is a state subject. However, he expressed concern over non-utilisation of full allocation by states in respect of central schemes like the National Food Security Mission, National Agriculture Development Scheme, National Micro-Irrigation Scheme and National Bamboo Mission.

Underlining the importance of agricultural Universities in the agricultural development, he lamented that four ranges of Bihar- Munger, Gaya, Saran and Champaran- are not having Agriculture University and the state must take the appropriate steps to establish it. He informed that despite in principle approval of the Planning Commission and allocation of about rupees 1,000 crore in the year 2009, the Rajendra Agriculture University, Pusa, Bihar is yet to get the status of central university. He confided that state government would soon take steps in this regard and the Centre is ready to provide all possible assistance. He also added that if land is provided, a Fishery Research Institute will be set up in Muzaffarpur, Bihar.


***


DK/PK
(Release ID :105784)

Humans, animals and plants all need nutrients to survive.

$
0
0
Humans, animals and plants all need nutrients to survive. Nutrients can be 'macronutrients' – because these are needed in greater quantities – such as nitrogen (N), phosphorus (P), potassium (K), calcium (Ca), sulphur (S) and magnesium (Mg) or 'micronutrients' such as zinc (Zn), copper (Cu), iron (Fe), boron (B), and molybdenum (Mo) because they are needed in lesser quantities.

Humans consume crop and animal products for nourishment while crops get most of their nutrient requirements from the soil. However, many soils do not provide all the nutrients in quantities needed by the crops. Soil nutrients removed by continuous cropping must be replaced through the addition of nutrient sources, such as fertilizers.
Fertilizers are any solid, liquid or gaseous substances containing one or more plant nutrients in known amount, that is applied to the soil, directly on the plant (foliage) or added to aqueous solutions (as in fertigation) to maintain soil fertility, improve crop development, yield and/or crop quality.

The purpose of fertilizer use, especially for higher yields, is identical in temperate and tropical climates:
  • to supplement the natural soil nutrient supply and build up soil fertility in order to satisfy the demand of crops with a high yield potential;
  • to compensate for the nutrients exported by the harvested products or lost by unavoidable leakages to the environment in order to maintain good soil conditions for cropping.
λ
to supplement the natural soil nutrient supply and build up soil fertility in order to satisfy the demand of crops with a high yield potential;
λ
to compensate for the nutrients exported by the harvested products or lost by unavoidable leakages to the environment in order to maintain good soil conditions for cropping.
Fertilizers are classified into two major forms:
  • organic, 
  • mineral/manufactured. 
λ
organic, 
λ
mineral/manufactured. 
Manufactured fertilizers are classified according to different criteria as follows:
  • Number of nutrients
    • single-nutrient or straight fertilizers (whether for macro or micronutrients)
      examples: urea (46-0-0), triple superphosphate (0-46-0),muriate of potash (0-0-60), zinc/iron chelates, boric acid, etc.
    • multi-nutrient/compound (multiple nutrients) fertilizers, with 2, 3 or more nutrients
      examples: compound fertilizers (15-15-15), diammonium phosphate (18-46-0), monopotassium phosphate (0-47-31), etc.
  • Type of combination
    • mixed fertilizers or ‘bulk-blends’ are physical mixtures of two or more single-nutrient or multi-nutrient fertilizers;
    • complex fertilizers are products in which two or more of the nutrients are chemically combined (e.g. nitrophosphates, ammonium phosphates). 
  • Physical condition
    • solid (crystalline, powdered, prilled or granular) of various size ranges;
    • liquid (solutions and suspensions);
    • gaseous (liquid under pressure, e.g. ammonia).
  • Nutrient release
    • quick-acting (water-soluble and immediately available);
    • slow-acting (transformation into soluble form required, e.g. direct application of phosphate rock); 
    • controlled-release by coating;
    • stabilized by inhibitors.
The principles of the right use of nutrient source, rate, time and place form the minimum basis of any local nutrient stewardship system. Best management practices must be applied to all of these areas to achieve local economic, social and environmental goals.

World nitrogen fertilizer consumption

$
0
0
World nitrogen fertilizer consumption

Nitrogen is the most consumed nutrient, due to its important role in crop production (N is an important component of many structural, genetic and metabolic compounds in plant cells). World demand for high-analysis, easy to transport fertilizer products is steadily increasing. Urea (46-0-0) is currently the most popular N fertilizer source with about 56 percent of the world market and represents the major sectoral growth in the nitrogen industry. The growth in demand has stimulated a growth in production.

World phosphate fertilizer consumption

The trend in phosphate consumption by product shows that the single superphosphate (SSP) share in the P market has dropped over the years. This is due to the continuous increase in the use of high-analysis P fertilizers, such as ammonium phosphates, mainly diammonium phosphate (DAP), the share of which increased to more than 50 percent of the global P market. DAP is the most consumed P fertilizer worldwide, due to its high P and N concentration.

World potash consumption

Potassium chloride or muriate of potash (MOP) is the most used K fertilizer product worldwide, accounting for almost 70 percent of all demand for K fertilizers. In some countries, such as the United States, Brazil or India, it accounts for more than 90 percent of all K fertilizer sold.

Modi Seen Slowing Singh’s Decade of Subsidies: Chart of the Day

$
0
0


As Indian Prime Minister Narendra Modi prepares his first budget, investors are watching to see how he’ll curb a subsidy bill that rose fivefold under his predecessor, stoking Asia’s fastest inflation.
The CHART OF THE DAY shows the budget for subsidies rose at almost twice the pace of so-called planned spending the past decade, with funds to ease the burden for food, fuel and fertilizer increasing 472 percent compared with the allocation at March 2004. The lower panel shows India’s government expenditure as a percentage of gross domestic product was second-lowest after Indonesia among members of the so-called fragile five, which also comprises Brazil, Turkey and South Africa.
“Subsidies are easy to implement and very tough to get rid of,” said Vishnu Varathan, an economist at Mizuho Bank Ltd. in Singapore. “It’s essential to get subsidies down in the long term, but we’re likely to see a gradual cutting rather than an amputation. The poor still need to eat.”
Subsidies rose to 16 percent of India’s total budget in the year ended March 2014 from 9 percent in 2004, while plan spending climbed to 30 percent from 26 percent, according to budget documents.
Modi last month said he’s ready to take unpopular steps to restore India’s finances, while Finance Minister Arun Jaitleydenounced “mindless populism” this week as he prepares to present the budget on July 10. Reserve Bank of India Governor Raghuram Rajan said in April that a reduction in subsidies would help him achieve a goal of reducing consumer-price inflation to 6 percent by 2016 from more than 8 percent.

Plan, Subsidies

Former prime minister Manmohan Singh earlier this year said his government could’ve done better controlling prices while defending policies to buy farm produce at guaranteed prices, boost rural wages and distribute cheap food. His Congress party, which has ruled India for most of its history, suffered its worst-ever defeat at the hands of Modi.
Plan spending includes funds for roads, schools and power plants, while subsidies are part of so-called non-plan expenditure, which is obligatory in nature and also includes interest and pension payments. Modi will probably continue to increase diesel prices while maintaining subsidies on kerosene, which is considered the poor person’s fuel, Varathan said.
To contact the reporter on this story: Jeanette Rodrigues in New Delhi at jrodrigues26@bloomberg.net
To contact the editors responsible for this story: Daniel Ten Kate at dtenkate@bloomberg.netDick Schumacher
Viewing all 8115 articles
Browse latest View live