Quantcast
Channel: EHSQL(Environment-Energy ,Health,Safety, Security and Social Ac. ,Quality-Lab) Technical services
Viewing all 8088 articles
Browse latest View live

60 Interesting Facts About .

$
0
0

60 Interesting Facts About . . .

  1. Most fish reproduce by laying eggs, though some fish, such as great white sharks, give birth to live babies called pups.d
  2. Starfish are not fish. Neither are jellyfish.a
  3. Although the fangtooth fish is only a few inches long, it has teeth about the size of a human’s.f
  4. The mudskipper is a fish that spends most of its time out of water and can “walk” on its fins. It carries a portable water supply in its gill chambers when it leaves the water. It can also breathe through the pores of its wet skin.f
  5. Catfish have over 27,000 taste buds. Humans have around 7,000.c
  6. lipstick fish scales To achieve shimmering effects, most lipsticks contain fish scales
  7. Most brands of lipstick contain fish scales.f
  8. Lungfish can live out of water for several years. It secretes a mucus cocoon and burrows itself under the unbaked earth. It takes in air with its lung through a built-in breathing tube that leads to the surface. A lungfish has both gills and a lung.d
  9. Seahorses are the only fish that swim upright.a
  10. Some fish, such as the great white shark, can raise their body temperature. This helps them hunt for prey in cold water.f
  11. The oldest known age for a fish was an Australian lungfish. In 2003, it was still alive and well at 65 years old.f
  12. Fish use a variety of low-pitched sounds to convey messages to each other. They moan, grunt, croak, boom, hiss, whistle, creak, shriek, and wail. They rattle their bones and gnash their teeth. However, fish do not have vocal chords. They use other parts of their bodies to make noises, such as vibrating muscles against their swim bladder.a
  13. Fish can form schools containing millions of fish. They use their eyes and something called a lateral line to hold their places in the school. The lateral line is a row of pores running along the fish’s sides from head to tail. Special hairs in the pores sense changes in water pressure from the movements of other fish or predators.f
  14. Since a fish’s jaw is not attached to its skull, many fishes can shoot their mouths forward like a spring to catch startled prey.a
  15. Electric eels and electric rays have enough electricity to kill a horse.c
  16. Sharks are the only fish that have eyelids.c
  17. Fish have sleep-like periods where they have lowered response to stimuli, slowed physical activity, and reduced metabolism but they do not share the same changes in brain waves as humans do when they sleep.d
  18. Some fish, such as the herbivorous fish (grazers), often lack jaw teeth but have tooth-like grinding mills in their throats called pharyngeal teeth.e
  19. Most fish have taste buds all over their body.e
  20. British Waters Pollution in water changes the sex of fish
  21. An estimated one third of male fish in British waters are changing sex due to pollution in human sewage.g
  22. Saltwater fish need to drink more water than freshwater fish. Since seawater is saltier than the liquids in a fish’s body, water inside the fish is constantly flowing out. If they didn’t drink to replace the lost water, saltwater fish would dry up like prunes.a
  23. The oldest fishhook ever found dates back to about 42,000 years ago.b
  24. Most fish have little salt in them. Sharks, however, have meat as salty as the ocean they live in.f
  25. Most fish can see in color and use colors to camouflage themselves or defend themselves and their territory. Most fish have the best possible eyesight for their habitat and can most certainly see you peering at them in a fish tank. Some fish can see polarized and ultraviolet light.d
  26. fish scale A fish's age can be determined by growth rings in its scales
  27. A fish does not add new scales as it grows, but the scales it has increase in size. In this way, growth rings are formed and the rings reveal the age of a fish.d
  28. Fish that have thin fins with a split tail indicate that they move very quickly or may need them to cover great distances. On the other had, fish that live among rocks and reefs near the ocean floor have broad lateral fin and large tails.f
  29. A ship has a heavy keel in the lower part to keep it from capsizing. Fish, on the other hand, have the keel on top. If the paired fins stop functioning to keep the fish balanced, the fish turns over because its heaviest part tends to sink, which happens when it dies.f
  30. On average, flying fish can glide 160 feet (50m), but have been known to glide as far as 660 feet (200 m). And they can reach heights up to 19 feet (6m).f
  31. An inflated porcupine fish can reach a diameter of up to 35 inches (90 cm). It puffs up by swallowing water and then storing it in its stomach. The stomach increases in size with more water. If the fish is taken out of water, it can inflate in a similar way by swallowing air.e
  32. A fish can drown in water. Like humans, fish need oxygen, so if there isn’t enough oxygen in the water, they will suffocate.f
  33. The fish in the middle of a school control the school. The fish on the outside are guided by those in the middle. Only bony fish can swim in highly coordinated groups.f
  34. fish swim Most fish cannot swim backwards
  35. Most fish cannot swim backwards. Those that can are mainly members of one of the eel families.a
  36. Fish would suffocate if they tried to chew because chewing would interfere with water passing over their gills.a
  37. The biggest fish in the world is the giant whale shark, which can grow to nearly 60 feet, or the length of two school buses. It weighs over 25 tons and eats mainly plankton. It has over 4,000 teeth, though they are only 3 mm long.d
  38. The most poisonous fish in the world is the stone fish. Its sting can cause shock, paralysis, and even death if not treated within a few hours.e
  39. The word “piranha” is from the Tupi (Brazil) pira nya and means “scissors.” Found in freshwater rivers in South America, piranhas have razor-sharp teeth. They typically eat fish, insects, seeds, fruit, and even larger animals such as horses. While there are no proven reports of piranhas killing a person, they do eat human carcasses.f
  40. The fastest fish is the sailfish. It can swim as fast as a car travels on the highway.d
  41. The slowest fish is a seahorse. It swims so slowly that a person can barely tell it is moving. The slowest is the Dwarf Seahorse, which takes about one hour to travel five feet. It even looks like it is simply standing up, not swimming.d
  42. Some fish do not have scales. Sharks, for example, have rough sandpapery skin instead of scales.d
  43. Fish have multiple Christian and pre-Christian overtones. For example, the Greek word for fish is Ichthys, which is an acronym for “Jesus Christ, God’s Son, Savior” and was used to mark early Christian tombs and meeting places. Because of their association with fertility, fish have also been linked to Isis and Aphrodite.f
  44. fugu fish In Japanese, "fugu" literally means "river pig"
  45. In Japan, the fugu, or puffer fish, is a succulent but lethal delicacy. It contains tetrodotoxin, a deadly poison. However, it is so delicious that Japanese gourmets risk their lives to prepare it. To make this high-risk dish, chefs must have a certificate from a special school that teaches preparation of this toxic fish.e
  46. Hammerhead sharks can live in schools of more than 500 sharks. The strongest female swims in the middle. When she is ready to mate, she shakes her head from side to side to signal the other female sharks to move away so she is the center of attention.a
  47. Some desert pupfish can live in hot springs that reach temperatures greater than 113° F.f
  48. A male emperor angelfish lives together with up to five female mates. If the emperor angelfish dies, one of the females turns into a male fish and becomes the leader of the group.f
  49. There are approximately 32,000 different kinds of fish in the world today, which is more than all the other kinds of vertebrates combined. Scientists are discovering new species all the time.d
  50. The batfish plays dead when danger is near. It floats motionless on its side when scared, making it look like a dead leaf floating on the surface of the water.d
  51. Anableps, four-eyed fish, can see above and below water at the same time.d
  52. Sometimes tornadoes pick up fish while traveling over water and carry them over land, where the fish rain down. These “fish showers” have been happening for thousands of years. Roman writer Pliny the Younger describes this phenomenon in the 1st century A.D.f
  53. Lampreys and hagfish are the most primitive form of fish still living today.c
  54. Male anglerfish are much smaller than the female. While the female can reach up to 24 inches long, the males barely reach 1.6 inches long and live as parasites on their mates. They stay together for life. As the male ages, he gets smaller and smaller. The female anglerfish’s light is always “on.”c
  55. fish sea Close to 99% of the ocean remains unexplored
  56. Scientists have explored only 1% of the ocean depths. They believe millions of new kinds of animals and fish are down there, waiting to be discovered.c
  57. Empty dogfish egg cases sometimes wash up onto the beach. Some people call them mermaid purses.f
  58. Humans have been amazed for centuries that salmon, after journeying across the ocean, can find the river where they were born. In the Yukon River in Alaska and in Canada, certain tagged Chinook salmon covered nearly 2,000 miles in 60 days. Salmon also have adapted to live in a variety of aquatic environments, including rivers, lakes, estuaries, coal reefs, and the open sea.c
  59. Fish were the first vertebrates with bony skeletons to appear on Earth. Unlike today’s fish, early fish had no scales, fins, or jawbone, but they did have a dorsal fin.f
  60. Hagfish are some of the slimiest animals on earth. An Atlantic hagfish can make enough slime in one minute to fill a bucket.d
  61. Unlike bony fish, sharks and rays do not have swim bladders. They have to swim all the time, even when they are sleeping. Otherwise, they will sink to the bottom of the ocean.f
  62. A seahorse can move each of its eyes separately. One eye can look forward while the other looks backward. Seahorses can also change their color to match their surroundings.f
  63. Most types of seahorses pair for life. Female seahorses lay their eggs inside a pouch on the male seahorse’s belly. When the babies are ready to hatch, the male holds onto a piece of seaweed with his tail and rocks back and forth until the babies pop out of his pouch.f
  64. Unlike most other fish, the ocean sunfish does not have a tail. A female sunfish can lay 300 million eggs each year. Each egg is smaller than the period at the end of a sentence.f
  65. The term “fish” is used when referring to one species of fish (e.g., 10 salmon are 10 fish). The term “fishes” is used when referring to more than one species (e.g., 10 salmon, 3 trout, and 1 angel fish are 14 fishes).e
  66. The freshwater Pygmy and Luzon gobies of the Philippines, the saltwater Marshal Islands goby, and the tiny rice fish from Thailand all reach a maximum length of 1/2", roughly the size of a grain of rice. They are typically considered the world’s smallest fishes.c
-- Posted April 9, 2012
References
a Britannica Illustrated Science Library. 2008. Fish and Amphibians. Chicago, IL: Encyclopedia Britannica, Inc.
b Choi, Charles. “World’s Oldest Fish Hook Show Early Humans Fished Deep Sea.” Live Science. November 24, 2011. Accessed: March 27, 2012.
c “Fish.”  2009. World Book Encyclopedia. Chicago, IL: World Book.
d Head, Honor. 2008. Amazing Fish (Amazing Life Cycles). Pleasantville, NY: Gareth Stevens Publishing.
e Parker, Steve. 2005. Angelfish, Megamouth Sharks, & Other Fish (Animal Kingdom Classification). Minneapolis, MN: David West Children’s Book.
f ----. 2005. Fish (Eyewitness Books). New York, NY: Dorling Kindersley Limited.
g “Pollution ‘Changes Sex of Fish.’” BBC. July 10, 2004. Accessed: March 27, 2012.

The Montreal Protocol on Substances that Deplete the Ozone Layer

$
0
0


Annex A: Controlled substances

GroupSubstanceOzone-Depleting Potential*
Group I
CFCl3(CFC‑11)1.0
CF2Cl2(CFC‑12)1.0
C2F3Cl3(CFC‑113)0.8
C2F4Cl2(CFC‑114)1.0
C2F5Cl(CFC‑115)0.6
Group II
CF2BrCl(halon‑1211)3.0
CF3Br(halon‑1301)10.0
C2F4Br2(halon‑2402)6.0
* These ozone depleting potentials are estimates based on existing knowledge and will be reviewed and revised periodically.

Annex B: Controlled substances

GroupSubstanceOzone-Depleting Potential
Group I
CF3Cl(CFC‑13)1.0
C2FCl5(CFC‑111)1.0
C2F2Cl4(CFC‑112)1.0
C3FCl7(CFC‑211)1.0
C3F2Cl6(CFC‑212)1.0
C3F3Cl5(CFC‑213)1.0
C3F4Cl4(CFC‑214)1.0
C3F5Cl3(CFC‑215)1.0
C3F6Cl2(CFC‑216)1.0
C3F7Cl(CFC‑217)1.0
Group II
CCl4carbon tetrachloride1.1
Group III
C2H3Cl3*1,1,1-trichloroethane* (methyl chloroform)0.1
* This formula does not refer to 1,1,2-trichloroethane.

Annex C: Controlled substances

GroupSubstanceNumber of isomersOzone-Depleting Potential*
Group I
CHFCl2(HCFC‑21)**10.04
CHF2Cl(HCFC‑22)**10.055
CH2FCl(HCFC‑31)10.02
C2HFCl4(HCFC‑121)20.01-0.04
C2HF2Cl3(HCFC‑122)30.02-0.08
C2HF3Cl2(HCFC‑123)30.02-0.06
CHCl2CF3(HCFC‑123)**-0.02
C2HF4Cl(HCFC‑124)20.02-0.04
CHFClCF3(HCFC‑124)**-0.022
C2H2FCl3(HCFC‑131)30.007-0.05
C2H2F2Cl2(HCFC‑132)40.008-0.05
C2H2F3Cl(HCFC‑133)30.02-0.06
C2H3FCl2(HCFC‑141)30.005-0.07
CH3CFCl2(HCFC‑141b)**-0.11
C2H3F2Cl(HCFC‑142)30.008-0.07
CH3CF2Cl(HCFC‑142b)**-0.065
C2H4FCl(HCFC‑151)20.003-0.005
C3HFCl6(HCFC‑221)50.015-0.07
C3HF2Cl5(HCFC‑222)90.01-0.09
C3HF3Cl4(HCFC‑223)120.01-0.08
C3HF4Cl3(HCFC‑224)120.01-0.09
C3HF5Cl2(HCFC‑225)90.02-0.07
CF3CF2CHCl2(HCFC‑225ca)**-0.025
CF2ClCF2CHClF(HCFC‑225cb)**-0.033
C3HF6Cl(HCFC‑226)50.02-0.10
C3H2FCl5(HCFC‑231)90.05-0.09
C3H2F2Cl4(HCFC‑232)160.008-0.10
C3H2F3Cl3(HCFC‑233)180.007-0.23
C3H2F4Cl2(HCFC‑234)160.01-0.28
C3H2F5Cl(HCFC‑235)90.03-0.52
C3H3FCl4(HCFC‑241)120.004-0.09
C3H3F2Cl3(HCFC‑242)180.005-0.13
C3H3F3Cl2(HCFC‑243)180.007-0.12
C3H3F4Cl(HCFC‑244)120.009-0.14
C3H4FCl3(HCFC‑251)120.001-0.01
C3H4F2Cl2(HCFC‑252)160.005-0.04
C3H4F3Cl(HCFC‑253)120.003-0.03
C3H5FCl2(HCFC‑261)90.002-0.02
C3H5F2Cl(HCFC‑262)90.002-0.02
C3H6FCl(HCFC‑271)50.001-0.03
GroupSubstanceNumber of isomersOzone-Depleting Potential*
Group II
CHFBr211.00
CHF2Br(HBFC-22B1)10.74
CH2FBr10.73
C2HFBr420.3-0.8
C2HF2Br330.5-1.8
C2HF3Br230.4-1.6
C2HF4Br20.7-1.2
C2H2FBr330.1-1.1
C2H2F2Br240.2-1.5
C2H2F3Br30.7-1.6
C2H3FBr230.1-1.7
C2H3F2Br30.2-1.1
C2H4FBr20.07-0.1
C3HFBr650.3-1.5
C3HF2Br590.2-1.9
C3HF3Br4120.3-1.8
C3HF4Br3120.5-2.2
C3HF5Br290.9-2.0
C3HF6Br50.7-3.3
C3H2FBr590.1-1.9
C3H2F2Br4160.2-2.1
C3H2F3Br3180.2-5.6
C3H2F4Br2160.3-7.5
C3H2F5Br80.9-1.4
C3H3FBr4120.08-1.9
C3H3F2Br3180.1-3.1
C3H3F3Br2180.1-2.5
C3H3F4Br120.3-4.4
C3H4FBr3120.03-0.3
C3H4F2Br2160.1-1.0
C3H4F3Br120.07-0.8
C3H5FBr290.04-0.4
C3H5F2Br90.07-0.8
C3H6FBr50.02-0.7
Group III
CH2BrClbromochloromethane10.12
* Where a range of ODPs is indicated, the highest value in that range shall be used for the purposes of the Protocol. The ODPs listed as a single value have been determined from calculations based on laboratory measurements. Those listed as a range are based on estimates and are less certain. The range pertains to an isomeric group. The upper value is the estimate of the ODP of the isomer with the highest ODP, and the lower value is the estimate of the ODP of the isomer with the lowest ODP.
** Identifies the most commercially viable substances with ODP values listed against them to be used for the purposes of the Protocol.

Annex D:* A list of products** containing controlled substances specified in Annex A

ProductsCustoms code number
1.Automobile and truck air conditioning units (whether incorporated in vehicles or not)...................
2.Domestic and commercial refrigeration and air conditioning/heat pump equipment***...................
e.g.Refrigerators...................
Freezers...................
Dehumidifiers...................
Water coolers...................
Ice machines...................
Air conditioning and heat pump units...................
3.Aerosol products, except medical aerosols...................
4.Portable fire extinguisher...................
5.Insulation boards, panels and pipe covers...................
6.Pre-polymers...................
* This Annex was adopted by the Third Meeting of the Parties in Nairobi, 21 June 1991 as required by paragraph 3 of Article 4 of the Protocol.
** Though not when transported in consignments of personal or household effects or in similar non-commercial situations normally exempted from customs attention.
*** When containing controlled substances in Annex A as a refrigerant and/or in insulating material of the product.

Annex E: Controlled substance

GroupSubstanceOzone-Depleting Potential
Group I
CH3Brmethyl bromide0.6

The Montreal Protocol Summary of control measures under the Montreal Protocol

$
0
0


This summary of control measures takes into account all the Amendments including the Beijing Amendment.
It may be noted that an Article 5(1) Party is a Party classified at a meeting of the Parties as a developing country and whose annual per capita consumption of Annex A and Annex B substances are below the limits set in Article 5 of the Montreal Protocol.

Annex A – Group I: Chlorofluorocarbons (CFC-11, CFC-12, CFC-113, CFC-114 and CFC-115)

Applicable to production and consumption
Non-Article 5(1) PartiesArticle 5(1) Parties
Base level:1986.Base level:Average of 1995–97.
Freeze:July 1, 1989.Freeze:July 1, 1999.
75 per cent: reductionJanuary 1, 1994. 50 per cent: reductionJanuary 1, 2005.
100 per cent: reductionJanuary 1, 1996 (with possible essential use exemptions).85 per cent: reductionJanuary 1, 2007.
100 per cent: reductionJanuary 1, 2010 (with possible essential use exemptions).
Anx A/I

Annex A – Group II: Halons (halon 1211, halon 1301 and halon 2402)

Applicable to production and consumption
Non-Article 5(1) PartiesArticle 5(1) Parties
Base level:1986.Base level:Average of 1995–97.
Freeze:January 1, 1992. Freeze:January 1, 2002.
100 per cent: reductionJanuary 1, 1994 (with possible essential use exemptions).50 per cent: reductionJanuary 1, 2005.
100 per cent: reductionJanuary 1, 2010 (with possible essential use exemptions).
Anx A/II

Annex B – Group I: Other fully halogenated CFCs (CFC-13, CFC-111, CFC-112, CFC-211, CFC-212, CFC-213, CFC-214, CFC-215, CFC-216, CFC-217)

Applicable to production and consumption
Non-Article 5(1) PartiesArticle 5(1) Parties
Base level:1989.Base level:Average of 1998–2000.
20 per cent: reductionJanuary 1, 1993. 20 per cent: reductionJanuary 1, 2003.
75 per cent: reductionJanuary 1, 1994. 85 per cent: reductionJanuary 1, 2007.
100 per cent: reductionJanuary 1, 1996 (with possible essential use exemptions).100 per cent: reductionJanuary 1, 2010 (with possible essential use exemptions).
Anx B/I

Annex B – Group II: Carbon tetrachloride

Applicable to production and consumption
Non-Article 5(1) PartiesArticle 5(1) Parties
Base level:1989.Base level:Average of 1998–2000.
85 per cent: reductionJanuary 1, 1995.85 per cent: reductionJanuary 1, 2005.
100 per cent: reductionJanuary 1, 1996 (with possible essential use exemptions).100 per cent: reductionJanuary 1, 2010 (with possible essential use exemptions).
Anx B/II

Annex B – Group III: 1,1,1-trichloroethane (methyl chloroform)

Applicable to production and consumption
Non-Article 5(1) PartiesArticle 5(1) Parties
Base level:1989.Base level:Average of 1998–2000.
Freeze:January 1, 1993.Freeze:January 1, 2003.
50 per cent: reductionJanuary 1, 1994.30 per cent: reductionJanuary 1, 2005.
100 per cent: reductionJanuary 1, 1996 (with possible essential use exemptions).70 per cent: reductionJanuary 1, 2010.
100 per cent: reductionJanuary 1, 2015 (with possible essential use exemptions).
Anx B/III

Annex C – Group I: HCFCs (consumption)

Non-Article 5(1) Parties: ConsumptionArticle 5(1) Parties: Consumption
Base level:1989 HCFC consumption + 2.8 per cent of 1989 CFC consumption.Base level:Average 2009–10.
Freeze:1996.Freeze:January 1, 2013.
35 per cent: reductionJanuary 1, 2004.10 per cent: reductionJanuary 1, 2015.
75 per cent: reductionJanuary 1, 2010.35 per cent: reductionJanuary 1, 2020.
90 per cent: reductionJanuary 1, 2015.67.5 per cent reductionJanuary 1, 2025.
99.5 per cent: reductionJanuary 1, 2020, and thereafter, consumption restricted to the servicing of refrigeration and air-conditioning equipment existing at that date.97.5 per cent: reduction (averaged over ten years 2030–40)January 1, 2030, and thereafter, consumption restricted to the servicing of refrigeration and air-conditioning equipment existing at that date.
100 per cent: reductionJanuary 1, 2030.100 per cent: reductionJanuary 1, 2040.
Anx C/I Consumption

Annex C – Group I: HCFCs (production)

Non-Article 5(1) Parties: ProductionArticle 5(1) Parties: Production
Base level:Average of 1989 HCFC production + 2.8 per cent of 1989 CFC production and 1989 HCFC consumption + 2.8 per cent of 1989 CFC consumption.Base level:Average 2009–10.
Freeze:January 1, 2004, at the base level for production.Freeze:January 1, 2013.
75 per cent: reductionJanuary 1, 2010.10 per cent: reductionJanuary 1, 2015.
90 per cent: reductionJanuary 1, 2015.35 per cent: reductionJanuary 1, 2020.
99.5 per cent: reductionJanuary 1, 2020, and thereafter, production restricted to the servicing of refrigeration and air-conditioning equipment existing at that date.67.5 per cent reductionJanuary 1, 2025.
100 per cent: reductionJanuary 1, 2030.97.5 per cent: reduction (averaged over ten years 2030–40)January 1, 2030, and thereafter, consumption restricted to the servicing of refrigeration and air-conditioning equipment existing at that date.
100 per cent: reductionJanuary 1, 2040.
Anx C/I Production

Annex C – Group II: HBFCs

Applicable to production and consumption
Non-Article 5(1) PartiesArticle 5(1) Parties
100 per cent: reductionJanuary 1, 1996 (with possible essential use exemptions).100 per cent: reductionJanuary 1, 1996 (with possible essential use exemptions).

Annex C – Group III: Bromochloromethane

Applicable to production and consumption
Non-Article 5(1) PartiesArticle 5(1) Parties
100 per cent: reductionJanuary 1, 2002 (with possible essential use exemptions).100 per cent: reductionJanuary 1, 2002 (with possible essential use exemptions).

Annex E – Group I: Methyl bromide

Applicable to production and consumption, amounts used for quarantine and preshipment applications exempted.
Non-Article 5(1) PartiesArticle 5(1) Parties
Base level:1991Base level:Average of 1995–98
Freeze:January 1, 1995. Freeze:January 1, 2002.
25 per cent: reductionJanuary 1, 1999. 20 per cent: reductionJanuary 1, 2005.
50 per cent: reductionJanuary 1, 2001. 100 per cent: reductionJanuary 1, 2015 (with possible critical use exemptions).
70 per cent: reductionJanuary 1, 2003.
100 per cent: reductionJanuary 1, 2005 (with possible critical use exemptions).
Anx E/I

Allowance for production to meet the basic domestic needs of Article 5(1) Parties following the Beijing Adjustments

Note: With regard to the summary below, it appears as though the allowance for production to meet the basic domestic needs of Article 5(1) Parties continues indefinitely after the date of the phase out (e.g. for Article 5(1) Parties in the case of Annex A substances; for both Article 5(1) and non-Article 5(1) Parties in the case of Annex B Group II and III substances). However, no Party can consume controlled substances, except for permitted essential (or critical) uses, after the dates of phase-out for both Article 5(1) and non-Article 5(1) Parties. Hence, no Party can produce controlled substances after such dates, except for essential uses.

Annex A – Group I: CFCs

Non-Article 5(1) PartiesArticle 5(1) Parties
Base level:Production in 1986.Base level:Average of production for 1995–1997
January 1, 199210 per cent of base level.July 1, 199910 per cent of base level.
January 1, 199615 per cent of base level until 28 July 2000 (date of entry into force of the Beijing Adjustments).January 1, 201015 per cent of base level.
New base level for basic domestic needs Effective July 28, 2000Annual average production for satisfying basic domestic needs of Article 5(1) Parties for the period 1995 to 1997 inclusive.
July 28, 2000100 per cent of new base level for satisfying basic domestic needs until end of 2002.
January 1, 200380 per cent of new base level.
January 1, 200550 per cent of new base level.
January 1, 200715 per cent of new base level.
January 1, 2010Zero.

Annex A – Group II: Halons

Non-Article 5(1) PartiesArticle 5(1) Parties
Base Level:Production in 1986.Base level:Average of production for 1995-1997.
January 1, 199210 per cent of base level.January 1, 200210 per cent of base level.
January 1, 199415 per cent of base level until January 1, 2002.January 1, 201015 per cent of base level.
New base level for basic domestic needs (Effective July 28, 2000)Annual average production for satisfying basic domestic needs of Article 5(1) Parties for the period 1995 to 1997 inclusive.
January 1, 2002100 per cent of new base level.
January 1, 200550 per cent of new base level.
January 1, 2010Zero.

Annex B – Group I: Other fully halogenated CFCs

Non-Article 5(1) PartiesArticle 5(1) Parties
Base level:Production in 1989.Base level:Average of production for 1998–2000.
January 1, 199310 per cent of base level.January 1, 200310 per cent of base level.
New base level for basic domestic needs (Effective July 28, 2000)Annual average production for basic domestic needs for the period– 1998 to 2000January 1, 201015 per cent of base level.
July 28, 200015 per cent of base level until 1 January 2003.
After January 1, 200380 per cent of the new base level.
January 1, 200715 per cent of the new base level.
January 1, 2010Zero

Annex B – Group II: Carbon tetrachloride

Non-Article 5(1) PartiesArticle 5(1) Parties
Base level:Production in 1989.Base level:Average of production for 1998–2000.
January 1, 199510 per cent of base level production.January 1, 200510 per cent of base level.
January 1, 199615 per cent of base levelJanuary 1, 201015 per cent of base level

Annex B – Group III: 1,1,1-trichloroethane (methyl chloroform)

Non-Article 5(1) PartiesArticle 5(1) Parties
Base level:Production in 1989.Base level:Average of production for 1998–2000.
January 1, 199310 per cent of base level.January 1, 200310 per cent of base level.
January 1, 199615 per cent of base level.January 1, 201515 per cent of base level.

Annex C – Group I: HCFCs

Non-Article 5(1) PartiesArticle 5(1) Parties
Base Level: Average of 1989 HCFC production + 2.8 per cent of 1989 CFC production and 1989 HCFC consumption +2.8 per cent of 1989 CFC consumption.Base level:Average of production and consumption in 2015.
January 1, 200415 per cent of base level.January 1, 201615 per cent of base level.

Annex E – Group I: Methyl bromide

Non-Article 5(1) PartiesArticle 5(1) Parties
Base level:Production in 1991.No additional production allowed for basic domestic needs.
January 1, 199510 per cent of base level until July 28, 2000.
New base level for basic domestic needs (effective July 28, 2000)Annual average production for basic domestic needs of Article 5(1) Parties for the period 1995 to 1998 inclusive.
July 28, 200015 per cent of base level until January 1, 2002.
January 1, 2002100 per cent of base level.
January 1, 200580 per cent of new base level.
January 1, 2015Zero.

What is Ozone?

$
0
0

Ozone is a gas made up of three oxygen atoms (O3). It occurs naturally in small (trace) amounts in the upper atmosphere (the stratosphere). Ozone protects life on Earth from the Sun’s ultraviolet (UV) radiation. In the lower atmosphere (the troposphere) near the Earth’s surface, ozone is created by chemical reactions between air pollutants from vehicle exhaust, gasoline vapors, and other emissions. At ground level, high concentrations of ozone are toxic to people and plants.

Stratospheric “good” ozone

Ninety percent of the ozone in the atmosphere sits in the stratosphere, the layer of atmosphere between about 10 and 50 kilometers altitude. The natural level of ozone in the stratosphere is a result of a balance between sunlight that creates ozone and chemical reactions that destroy it. Ozone is created when the kind of oxygen we breathe—O2—is split apart by sunlight into single oxygen atoms. Single oxygen atoms can re-join to make O 2, or they can join with O 2 molecules to make ozone (O 3). Ozone is destroyed when it reacts with molecules containing nitrogen, hydrogen, chlorine, or bromine. Some of the molecules that destroy ozone occur naturally, but people have created others.
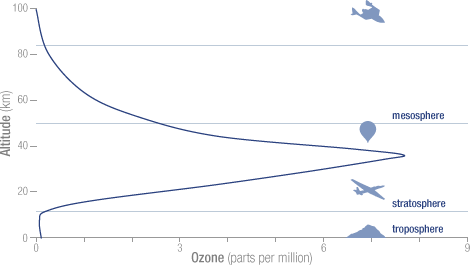
The total mass of ozone in the atmosphere is about 3 billion metric tons. That may seem like a lot, but it is only 0.00006 percent of the atmosphere. The peak concentration of ozone occurs at an altitude of roughly 32 kilometers (20 miles) above the surface of the Earth. At that altitude, ozone concentration can be as high as 15 parts per million (0.0015 percent).
Graph showing vertical distribution of ozone in the atmosphere The concentration of ozone varies with altitude. Peak concentrations, an average of 8 molecules of ozone per million molecules in the atmosphere, occur between an altitude of 30 and 35 kilometers.
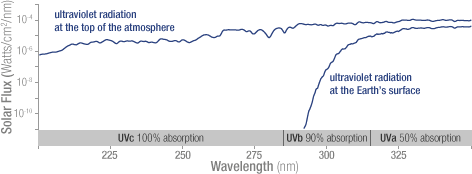
Ozone in the stratosphere absorbs most of the ultraviolet radiation from the Sun. Without ozone, the Sun’s intense UV radiation would sterilize the Earth’s surface. Ozone screens all of the most energetic, UV-c, radiation, and most of the UV-b radiation. Ozone only screens about half of the UV-a radiation. Excessive UV-b and UV-a radiation can cause sunburn and can lead to skin cancer and eye damage.
Graph of ultraviolet flux Solar ultraviolet radiation is largely absorbed by the ozone in the atmosphere—especially the harmful, high-energy UV-a and UV-b. The graph shows the flux (amount of energy flowing through an area) of solar ultraviolet radiation at the top of the atmosphere (top line) and at the Earth’s surface (lower line). The flux is shown on a logarithmic scale, so each tick mark on the y-axis indicates 10 times more energy.
Increased levels of human-produced gases such as CFCs (chlorofluorocarbons) have led to increased rates of ozone destruction, upsetting the natural balance of ozone and leading to reduced stratospheric ozone levels. These reduced ozone levels have increased the amount of harmful ultraviolet radiation reaching the Earth’s surface. When scientists talk about the ozone hole, they are talking about the destruction of stratospheric, “good,” ozone.

Tropospheric “bad” ozone

Although ozone high up in the stratosphere provides a shield to protect life on Earth, direct contact with ozone is harmful to both plants and animals (including humans). Ground-level, “bad,” ozone forms when nitrogen oxide gases from vehicle and industrial emissions react with volatile organic compounds (carbon-containing chemicals that evaporate easily into the air, such as paint thinners). In the troposphere near the Earth’s surface, the natural concentration of ozone is about 10 parts per billion (0.000001 percent). According to the Environmental Protection Agency, exposure to ozone levels of greater than 80 parts per billion for 8 hours or longer is unhealthy. Such concentrations occur in or near cities during periods where the atmosphere is warm and stable. The harmful effects can include throat and lung irritation or aggravation of asthma or emphysema.

The British Scientists Who Discovered the Ozone Hole

$
0
0

The British Scientists Who Discovered the Ozone Hole

Author: Susan Hunt MA - Updated: 17 September 2012 
The British Scientists Who Discovered The Ozone Hole
British Antarctic Survey Scientists Who Discovered The Ozone Hole
For more than half a century, the British Antarctic Survey has been taking measurements at the North Pole.
One of the world’s foremost environmental research organisations, it first began taking atmospheric readings in the Antarctic in the 1950s and in 1985, BAS scientists announced the discovery of the Ozone Hole.

Announcement That Changed The World

The researchers involved, Joe Farman, Brian Gardiner and Jonathan Shanklin, published their earth-shattering discovery in the journal, Nature, and it was instrumental in the introduction of the Montreal Protocol banning CFCs.Measurements at Halley station originally began in a bid to understand more about the way ozone absorbs solar energy and, according to rumour, the scientists believed their instruments were faulty when they first discovered the existence of the Ozone Hole.
Scientists in America say that NASA actually discovered the hole before the British Antarctic Survey but believed that its measurements must be incorrect, until they were confirmed by the Survey scientists.

British Antarctic Survey

Currently, more than 400 people work for BAS. It has three stations in the Antarctic, including Halley, as well as two stations on South Georgia. The present station at Halley is made up of a collection of buildings on steel legs, which have to be jacked up every year to keep them clear of snow. Four previous stations all had to be abandoned within a decade after being crushed by ice.
Despite the atrocious conditions, Halley is in operation all year round and is staffed by around 70 people in the summer and 16 in winter. However, very few of the winter staff are scientists – the main staff housed there are those with the technical skills needed to keep the station, its personnel and its experiments running, such as a doctor, mechanics, a cook and a heating engineer.

Darkness For Months

A major event in the Halley calendar is sundown, which marks the last day that the sun will rise over the horizon until winter ends. The base is then plunged into permanent darkness for more than 100 days until the sun eventually returns. Sundown is marked by various events and parties and, traditionally, the winter staff streak around the outside of the base (although they are allowed to wear a hat, gloves and boots).

Halley’s Excellent Location

The base at Halley is an excellent location for studying the atmosphere and ozone depletion, and it has provided an unbroken record of readings since the first data was gathered there in 1956.Its data is sent to forecasting stations to help with weather predictions, and Halley’s climate database is also used by researchers investigating climate change.

Southern Lights

Its position at the edge of the auroral zone, where the Southern Lights are visible in the winter sky, makes it an excellent location for research into Geospace – the region of space where the solar atmosphere interacts with the magnetic field of the Earth.
Following their discovery of the Ozone Hole, Farman, Gardiner and Shanklin received the Society of Chemical Industry (SCI) Environment Medal, reserved for those who have achieved the highest distinction in environmental science.

The Ozone Layer is a vital component in the history of life on earth.
Without it, mankind and most forms of life that we know today probably wouldn’t exist and the environment of the planet would be extremely different.
Hundreds of millions of years ago, only single cell organisms existed on Earth and at that time, the planet lacked the oxygen that we need to live.
But as these organisms evolved, they began to release tiny amounts of oxygen through photosynthesis and over a period of millions of years, this led to the creation of the Ozone Layer.

Identification of Ozone – 03

Ozone is first thought to have been identified in 1839 by Christian Schonbein, a Swiss chemist who was actually looking at electrical discharges. (Ozone can easily be produced by a high voltage electrical arc such as a spark plug or an arc welder). He named it ozone, from the Greek term “to smell”, because of its strong odour (which has been likened to the smell of burning electrical wires).
Schonbein wasn’t able to describe the molecular structure of ozone but this was achieved by Jean-Luis Soret in the 1860s. However, Schonbein continued his research and was one of the first people to suggest that higher concentrations of ozone at ground level could affect people’s health. As history has shown, he was correct in his assumption – ozone is now known to be a main ingredient of today’s city smog.

Ozone link to UV levels

About 40 years after Schonbein’s naming of ozone, researchers examining the amount of UV radiation that reaches Earth discovered a sharp cut off point in the atmosphere – and correctly deduced that this cut off was because of ozone in the upper atmosphere. However, French scientists Charles Farby and Henri Buisson are credited with actual discovery of the Ozone Layer in 1913. They carried out the first measurements of ozone in Europe and in 1920, GMB Dobson, a lecturer in meteorology at Oxford University decided to follow their example.

Vital Ozone Research Carried out in Britain

Dobson went on to research ozone for the next 40 years and was involved in the setting up of special stations around the globe to measure ozone. Frustrated by the equipment available to measure it, he also designed his own instrument. In the 1930s, British physicist, Sidney Chapman, produced a theory explaining how ozone is created and destroyed in the stratosphere and this process became known as Chapman Reactions.
He established that when oxygen molecules in the stratosphere are hit by radiation from the sun, they can split into two oxygen atoms. When one of these separated atoms becomes attached to a complete oxygen molecule, it becomes ozone (O3 ). In later years, scientists realised that Chapman’s theory was incomplete and further research was undertaken.
At that time, the Ozone Layer was taken for granted. It had existed throughout the history of mankind and it hadn’t occurred to anyone that things might change.
However, in 1970 scientists began to suggest that this vital protection from the sun’s radiation could be affected by the actions of mankind.
And very soon afterwards, they confirmed that we had been unwittingly damaging the Ozone Layer –and putting our whole environment at risk - for at least half-a-century, through the use of man-made chemicals known as ODS – Ozone Depleting Substances.

How Is Ozone Measured?

$
0
0
Ozone is good or bad depending on where it is. We regard the ozone in our higher atmosphere (known as the stratosphere) as good because it protects us from the sun’s radiation.
However, the ozone at ground level is judged to be bad. It is a form of pollution that can affect our health and is a major ingredient in city smog.

The Work Of Dobson

Ozone in the atmosphere is measured in Dobson units, named after the British scientist, Gordon Dobson, who spent most of his working life studying atmospheric ozone.Dobson, who lectured in meteorology at Oxford University, carried out studies into meteor trails with a colleague and their work was very important in the early understanding of the stratosphere.

Dobson’s Discovery

Dobson worked out that the temperature was higher in the stratosphere because of the way in which ozone absorbed ultraviolet radiation from the sun, and he looked for a way in which he could measure it.Following earlier work by French physicists Charles Fabry and Henri Buisson, who discovered the ozone layer in 1913, Dobson decided to attempt to measure ozone by observing how it was absorbed into the solar spectrum.

The First Instrument

His first instrument for measuring ozone used a Fabry prism, which was made up of a wedge of gelatine and carbon black sandwiched between quartz plates, together with a filter which would cut out unwanted solar radiation.

He made a special tank to make sure that the photographic plates were developed consistently, and built a photoelectric instrument with a potassium photocell.

Used Worldwide

The Dobson spectrometer became the standard instrument for measuring ozone and a more modern version of it is still in use today. It measures the intensity of solar UV radiation at four different wavelengths, two of which are absorbed by ozone. His procedure for measuring ozone imagines it as a layer, but in reality there is no “layer” and it’s better to think of it as being so many parts per million in the atmosphere.

Global Ozone Levels

Globally, the average amount of ozone in the stratosphere is around 300 Dobson Units (which is only 3mm at 0 degrees Celsius and 1 atmospheric pressure). However, the levels do vary at different latitudes. Dobson, who was born in 1889, first began observing ozone in the 1920s and his work continued, albeit with a few gaps, until not long before his death in 1976.
And although he died 35 years ago, his work is still regarded as some of the best research yet undertaken into ozone, our atmosphere and the stratosphere.

Network Of Measuring Stations

In the 1950s, Dobson helped to establish a network of ground-based ozone stations, and today there are around 100 sites around the world where ozone is routinely measured using Dobson instruments. Ozone is also measured from high altitude balloons and satellites.For many years, NASA used a total ozone mapping spectrometer (TOMS) aboard satellites to measure ozone. For example, Nimbus 7, as it orbited the earth for many years, provided daily figures for ozone around much of the globe.

Monitoring Goes On

Measurements were gathered in this way between the late 1970s until the early 1990s, but a replacement instrument launched in 1991 aboard a Russian spacecraft failed after three years. Many organisations continue to monitor ozone include NASA and a variety of environmental bodies around the world. This is how we know the current level of ozone depletion

How the Ozone Layer Varies due to Geography and Seasons

$
0
0
Many people think of the ozone layer as a kind of blanket above us but in fact it accounts for just a tiny percentage of the gases in the stratosphere and actual concentrations vary tremendously around the planet.
Ozone levels tend to be higher at mid and higher altitudes because of winds that move air with high ozone content towards the poles. Levels in most parts of the globe can vary on a daily basis and they are also greatly affected by climate and seasons.

Where is There Less Ozone?

The lowest amounts of ozone (apart from at the Antarctic in spring) tend to be found in tropical climates because the troposphere extends to higher altitudes there.Levels are also more affected in hotter regions by a natural planetary feature, the volcano. A major volcanic eruption affects ozone as well as weather in the region.
In 1991, an eruption from Mount Pinatubo in the Philippines coincided with a 20% increase in the earth’s ozone ‘hole’ the following spring and many experts believe that the increased hole occurred as a result of that eruption.

Tropical Winds

Every 26 months, tropical winds in the stratosphere alternate between easterly and westerly. This is known as Quasi-Biennial Oscillation (QBO) and causes changes of around 3% in ozone levels in different areas. Of course, these winds actually shift the ozone, rather than destroy it, so while levels drop in one region, they increase in another.When calculating global ozone levels, it is also important to remember that the 11-year solar cycle means that UV radiation produced by the sun is not constant. It varies by several per cent over the time of the cycle.

The Ozone Project

In 1991, a huge project was launched with support from the European Commission to measure ozone in Europe.The EASOE experiment lasted from November 1991 until March 1992 and involved 250 scientists from 18 different countries. They sent 1000 sounding balloons into the atmosphere and the data collected showed that ozone concentration was at its lowest ever in Europe.
However, researchers suggested that either the Pinatubo eruption or a particularly brutal anti-cyclone which had settled above the Arctic that winter could be responsible for the low levels.

More European Research

From 1993 to 1995, another project, known as SESAME, looked at middle latitudes.This showed that ozone levels in Europe had dropped by around 30% but again, scientists concluded that a particularly cold winter – which brought the lowest recorded temperatures for almost 30 years - was a major factor in this drop.
A third European ozone experiment took place in the winter of 1999 and involved the measurement of ozone and other gases from aircraft, balloons, satellites and instruments on the ground. It also sought to answer some of the questions raised by earlier projects.

Cambridge Research Unit

To better understand the changes in ozone levels in our part of the world, a European Ozone Research Coordinating Unit has been set up. Based at Cambridge University, it co-ordinates research, workshops and conferences related to ozone within Europe.

Science: Ozone Basics

$
0
0
 diagram depicting layers of atmospheric ozone

Ozone is very rare in our atmosphere, averaging about three molecules of ozone for every 10 million air molecules. In spite of this small amount, ozone plays a vital role in the atmosphere. In the information below, we present "the basics" about this important component of the Earth's atmosphere.


Where is ozone found in the atmosphere?
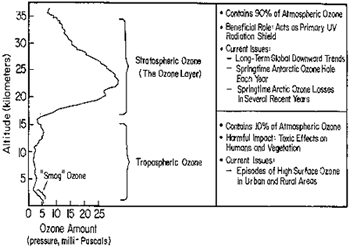
Ozone is mainly found in two regions of the Earth's atmosphere. Most ozone (about 90%) resides in a layer that begins between 6 and 10 miles (10 and 17 kilometers) above the Earth's surface and extends up to about 30 miles (50 kilometers). This region of the atmosphere is called the stratosphere. The ozone in this region is commonly known as the ozone layer. The remaining ozone is in the lower region of the atmosphere, which is commonly called the troposphere. The figure (above) shows an example of how ozone is distributed in the atmosphere.
What roles does ozone play in the atmosphere and how are humans affected?
The ozone molecules in the upper atmosphere (stratosphere) and the lower atmosphere (troposphere) are chemically identical, because they all consist of three oxygen atoms and have the chemical formula O3. However, they have very different roles in the atmosphere and very different effects on humans and other living beings. Stratospheric ozone (sometimes referred to as "good ozone") plays a beneficial role by absorbing most of the biologically damaging ultraviolet sunlight (called UV-B), allowing only a small amount to reach the Earth's surface. The absorption of ultraviolet radiation by ozone creates a source of heat, which actually forms the stratosphere itself (a region in which the temperature rises as one goes to higher altitudes). Ozone thus plays a key role in the temperature structure of the Earth's atmosphere. Without the filtering action of the ozone layer, more of the Sun's UV-B radiation would penetrate the atmosphere and would reach the Earth's surface. Many experimental studies of plants and animals and clinical studies of humans have shown the harmful effects of excessive exposure to UV-B radiation.
At the Earth's surface, ozone comes into direct contact with life-forms and displays its destructive side (hence, it is often called "bad ozone"). Because ozone reacts strongly with other molecules, high levels of ozone are toxic to living systems. Several studies have documented the harmful effects of ozone on crop production, forest growth, and human health. The substantial negative effects of surface-level tropospheric ozone from this direct toxicity contrast with the benefits of the additional filtering of UV-B radiation that it provides.

What are the environmental issues associated with ozone?
The dual role of ozone leads to two separate environmental issues. There is concern about increases in ozone in the troposphere. Near-surface ozone is a key component of photochemical "smog," a familiar problem in the atmosphere of many cities around the world. Higher amounts of surface-level ozone are increasingly being observed in rural areas as well.
There is also widespread scientific and public interest and concern about losses of ozone in the stratosphere. Ground-based and satellite instruments have measured decreases in the amount of stratospheric ozone in our atmosphere. Over some parts of Antarctica, up to 60% of the total overhead amount of ozone (known as the column ozone) is depleted during Antarctic spring (September-November). This phenomenon is known as the Antarctic ozone hole. In the Arctic polar regions, similar processes occur that have also led to significant chemical depletion of the column ozone during late winter and spring in 7 out of the last 11 years. The ozone loss from January through late March has been typically 20-25%, and shorter-period losses have been higher, depending on the meteorological conditions encountered in the Arctic stratosphere. Smaller, but still significant, stratospheric decreases have been seen at other, more-populated regions of the Earth. Increases in surface UV-B radiation have been observed in association with local decreases in stratospheric ozone, from both ground-based and satellite-borne instruments.
What human activities affect upper-atmospheric ozone (the stratospheric ozone layer)?
The scientific evidence, accumulated over more than two decades of study by the international research community, has shown that human-produced chemicals are responsible for the observed depletions of the ozone layer. The ozone-depleting compounds contain various combinations of the chemical elements chlorine, fluorine, bromine, carbon, and hydrogen and are often described by the general term halocarbons. The compounds that contain only chlorine, fluorine, and carbon are called chlorofluorocarbons, usually abbreviated as CFCs. CFCs, carbon tetrachloride, and methyl chloroform are important human-produced ozone-depleting gases that have been used in many applications including refrigeration, air conditioning, foam blowing, cleaning of electronics components, and as solvents. Another important group of human-produced halocarbons is the halons, which contain carbon, bromine, fluorine, and (in some cases) chlorine and have been mainly used as fire extinguishants.
What actions have been taken to protect the ozone layer?
Through an international agreement known as the Montreal Protocol on Substances that Deplete the Ozone Layer, governments have decided to eventually discontinue production of CFCs, halons, carbon tetrachloride, and methyl chloroform (except for a few special uses), and industry has developed more "ozone-friendly" substitutes. All other things being equal, and with adherence to the international agreements, the ozone layer is expected to recover over the next 50 years or so.


Science: Ozone Depletion

$
0
0

 http://www.ozonelayer.noaa.gov/science/StratO3.jpeg
In the stratosphere, the region of the atmosphere between about 6 and 30 miles (10 and 50 kilometers) above the Earth's surface, ozone (O3) plays a vital role by absorbing harmful ultraviolet radiation from the sun. Stratospheric ozone is threatened by some of the human-made gases that have been released into the atmosphere, including those known as chlorofluorocarbons (CFCs). Once widely used as propellants in spray cans, refrigerants, electronics cleaning agents, and in foam and
insulating products, the CFCs had been hailed as the "wonder chemicals." But the very properties that make them useful - chemical inertness, non-toxicity, insolubility in water - also make them resistant to removal in the lower atmosphere.
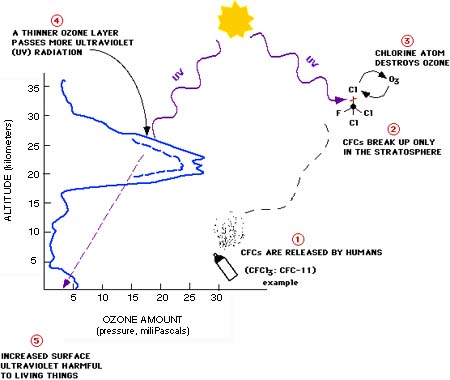
CFCs are mixed worldwide by the large-scale motions of the atmosphere and survive until, after 1-2 years, they reach the stratosphere and are broken down by ultraviolet radiation. The chlorine atoms within them are released and directly attack ozone. In the process of destroying ozone, the chlorine atoms are regenerated and begin to attack other ozone molecules... and so on, for thousands of cycles before the chlorine atoms are removed from the stratosphere by other processes.
The profile above shows how the amount of ozone (O3) varies with height in the atmosphere. Note that most of the ozone is in the lower stratosphere. The "ozone layer" resides at an altitude of about 12 to 15 miles (20 to 25 kilometers) above sea level. It acts as a shield by absorbing biologically active ultraviolet light (called UV-B) from the sun. If the ozone layer is depleted, more of this UV-B radiation reaches the surface of the earth. Increased exposure to UV-B has harmful effects on plants and animals, including humans. The chlorine and bromine in human-produced chemicals such as the ones known as chlorofluorocarbons (CFCs) and halons are depleting ozone in the stratosphere. The figure shows a simplified cycle of reactions in which chlorine (Cl) destroys ozone (O3).

Project Management Training Workshops (All India)

$
0
0

Project Management Training Workshops (All India)
Project Management is the key focus area nowadays because Managing Projects is one of the difficult task. A project isn't something that's part of normal business operations. A project consumes resources whether people, funds, materials, or time, and it has funding & resource limits. No matter what the type of project, project management typically follows the same pattern – Initiation, Planning, Execution, Monitoring & Control, and Closure.
 
In an order to understand, acquire & implement the above we have come up with following workshops on Project Management which are Extensively Designed for people who have anything to do with Projects or Project Management, irrespective of their Industry Type, Domain, Age or Geography.
 
Effective Project Management (PMP)
2 Days – 9.30 am to 5.00 pm
MS Project (2007/2010)
2 Days – 9.30 am to 5.00 pm
Project & Project Management Overview– Understand what is Project and difference between operations & project management.  What is Program & Portfolio Management & how it’s associated with Projects.
Project Life Cycle & Process Groups – Understand Project Life Cycle, from begin of a Project to End of the Project. Understand five phases of the Project, and learn how they are integrated.
Project Initiation & Planning – How a project is initiated with Project Charter. Defining assumptions, risks, broader time lines & budget. Plan a Project with Scope, Time, Cost, HR, Procurement, Risks and Quality Management.
Project Execution & Project Monitoring & Controlling – Understand how to execute the Projects. Understand how to control timelines, cost and scope of the project alongwith managing stakeholders expectations.
Project Closing– How to close a project with performance appraisals, contracts closure etc. Understand how to integrate the entire project to meet the end objective.
Project Scope & Time Management – Gathering requirements, defining scope. Learn how to create WBS, Network diagrams, develop schedules.
Project Cost Management– Understand how to determine costs with Project cost, Management cost, contingency costs etc. Learn earned value techniques to manage the project cost. Techniques for monitoring & controlling costs.
Project Quality Management– What is Quality control and Quality assurance. How this is applicable to the projects. What are the tools and methods to define and implement Quality Control & Quality Assurance.
Project Human Resource & Communication Management– How to acquire, develop and manage project teams. How to manage stakeholders, meeting project reporting requirements etc. How to meet stakeholder expectations by setting right expectations for communications management.
Project Risk & Procurement Management– Understand what are known unknown and what are unknown unknowns. How to manage them, How to mitigate, accept or transfer risks. How to determine what is to be purchased, how to be purchased, when to be purchased, and other associated procurement things to be managed.
Introduction to MS Project - Introduction to MS Project application & it’s usage in current industry scenario’s, Introduction to Project & Project Management
Creating a Project Plan–Learn the steps involved in creating project plan. The more you have understanding on the concepts, more it will easy for you to plan a project.  Understanding Project plans, How to create a New Project Plan, Assigning a specific Project Calendar as per our requirements, Adding Tasks to the Project Plan, Entering the Task Duration Estimates, Adding Resources in the Project Plan
Managing Tasks in a Project Plan - Understanding tasks, Outlining Tasks in a project plan, Adding a Recurring Task, Linking Dependent Tasks, Setting a Constraint to a Task, Setting a Task Deadline, Adding Notes to a Task
Managing Resources in a Project Plan - Understanding resources, Creating a Resource Calendar, Assigning Resources to Tasks, Assigning Additional Resources to a Task, Entering Costs for Resources, Entering Values for Budget Resources, Resolving Resource Conflicts
Finalizing the Project Plan - Understanding Critical path, Displaying the Critical Path, Shortening the Project Duration, Setting a Baseline, Printing a Project Summary Report. Understand all these features from practical and conceptual point of view.
Exchanging Project Plan Data with Other Applications - Overview of importing Project Information, Exporting Project Plan Data into Excel, Copying a Picture of the Project Plan Information
Updating a Project Plan - Entering Task Progress, Entering Overtime Work, Splitting a Task, Rescheduling a Task, Filtering Tasks, Setting an Interim Plan, Creating a Custom Table, Creating a Custom Report
Managing Project Costs– Managing project cost is one of the most important thing to manage on the project and isn’t easy too. But with MS Project, understand managing and updating project costs, Updating Cost Rate Tables, Grouping Costs, Linking Documents to a Project Plan
Project Reporting– MS Project gives you ready made & customized project reporting. Understand, create & define Project Reporting as per stakeholder’s, team, management requirements. Project reporting is important aspect of entire Project Management. You can’t take timely decision until & unless you have facts available in terms of reporting.
Program Schedule - Timings 9.30 am to 5.00 pm
Effective Project Management (PMP)
2 Days – 9.30 am to 5.00 pm
MS Project (2007/2010)
2 Days – 9.30 am to 5.00 pm
New Delhi 21 & 22 Dec’13 (Sat & Sun)
Paharpur Business Center, Nehru Place, New Delhi
.
New Delhi 19 & 20 Dec’13 (Thu & Fri)
Paharpur Business Center, Nehru Place, New Delhi
.
Mumbai 14 & 15 Dec’13  (Sat & Sun)
Hotel Residency, Andheri – Kurla Rd, Andheri (East), Mumbai
.
Mumbai 12 & 13 Dec’13 (Thu & Fri)
Hotel Residency, Andheri – Kurla Rd, Andheri (East), Mumbai
.
Bangalore 07 & 08 Dec’13 (Sat & Sun)
Hotel Golden Landmark, Seshadri Road, Near Anand Rao Circle, Bangalore
.
Bangalore 05 & 06 Dec’13 (Thu & Fri)
Hotel Golden Landmark, Seshadri Road, Near Anand Rao Circle, Bangalore
.
Chennai 30 Nov & 01 Dec’13 (Sat & Sun)
Hotel Vijay Park , Jawaharlal Nehru Salai, Arumbakkam, Chennai
.
Chennai 28 & 29 Nov’13 (Thu & Fri)
Hotel Vijay Park , Jawaharlal Nehru Salai, Arumbakkam, Chennai
.
Hyderabad 23 & 24 Nov’13 (Sat & Sun)
The Square Hyderabad Hotel, Greenland, APTDC, Begumpet, Hyderabad
.
Hyderabad 21 & 22 Nov’13 (Thu & Fri)
The Square Hyderabad Hotel, Greenland, APTDC, Begumpet, Hyderabad
.
Pune 16 & 17 Nov’13 (Sat & Sun)
Hotel Shree Panchratna, Tadiwala Road, Pune
.
Pune 14 & 15 Nov’13 (Thu & Fri)
Hotel Shree Panchratna, Tadiwala Road, Pune
.
Ahmedabad 09 & 10 Nov’13 (Sat & Sun)
Lemon Tree Hotel, Mithakali Six Cross Roads, Navrangpura, Ahmedabad
.
Ahmedabad 07 & 08 Nov’13 (Thu & Fri)
Lemon Tree Hotel, Mithakali Six Cross Roads, Navrangpura, Ahmedabad
.
Cost – Effective Project Management (PMP)
.
Cost - MS Project
Rs. 12,000/- Per Person
.
Rs. 10,000/- Per Person
Service Tax is included in the cost. Lunch, Tea/Coffee, Snacks & Training Material will be provided to all participants. Please bring your laptop for MS Project Training Program preloaded with MS Project 2007 or 2010..
.
Registration Procedure (Attached Below) – Registrations on First Come First Serve Basis
Contact Us : Contact Us for any query on : 09818415819, 0120-4543425

 
cid:image001.png@01CE882A.B21AAE20

INDUSTRIAL HYGIENE

$
0
0
INDUSTRIAL HYGIENE
Industrial hygiene is defined as the recognition, evaluation, and control of workplace hazards. Its origins are based on limiting personal exposures to chemicals, and have evolved to address the control of most other workplace hazards including over-exposure to noise, heat, vibration, and repetitive motion.
Occupational exposure to chemicals is still considered one of the most wide spread hazards in industry. The use of engineering controls is the preferred method of limiting these exposures. Dilution and capture ventilation are two important methods to control occupational exposure. The design and position of hoods and vents, and amount of air infiltration can substantially change exposure conditions. Material Safety Data Sheets and other documentation provide a basis for predicting adverse effects, disposal needs, and fire and ignition concerns.
Sampling and monitoring equipment is available to quantify exposures to contaminants, noise, radiation, and heat. Correct sampling strategy and interpretation are essential elements of an industrial hygiene survey. Confined spaces, ventilation changes, the performance of collection systems, and pressure relief valves are all items of concern for exposure evaluation.
The selection of appropriate personal protective equipment for exposure control often requires both an understanding of the limitations of the equipment, and the expected exposure parameters as determined by an industrial hygiene evaluation. Engineering controls are considered the preferred method of control, but personal protective equipment plays an important role for health, safety, and rescue, especially when using confined space entry procedures. The potential for misuse or misapplication of these devices should be evaluated.
The Occupational Safety and Health Administration, the American Conference of Governmental Industrial Hygienists, and the National Institute of Occupational Safety and Health are three organizations which establish many of the rules governing allowable workplace exposures. Permissible exposure limits for noise, chemicals, heat, and other workplace stressors have been established and often include safety factors.


LABORATORY SAFETY RULES

$
0
0

LABORATORY SAFETY RULES
·         Do Not Pipette By Mouth - Ever
You say, "But it's only water." Even if it is, how clean do you think that glassware reallyis? Using disposable pipettes? I know lots of people who rinse them and put them back! Learn to use the pipette bulb or automated pipetter. Don't pipette by mouth at home either. Gasoline and kerosene should be obvious, but people get hospitalized or die every year, right? I know someone who used his mouth to start the suction on a waterbed to drain it. Do you know what they put in some waterbed additives? Carbon-14. Mmmm...radiation. He couldn't retch fast enough! The lesson is that even seemingly harmless substances may be dangerous!
·         Read the Chemical Safety Information
A  (MSDS) should be available for every chemical you use in lab. Read these and follow the recommendations for safe use and disposal of the material.
·         Dress Appropriately (for chemistry lab, not fashion or the weather)
No sandals, no clothes you love more than life, no contact lenses, and long pants are preferable to shorts or short skirts. Tie long hair back. Wear safety goggles and a lab coat. Even if you aren't clumsy, someone else in the lab probably is. If you take even a few chemistry courses you will probably see people set themselves on fire, spill acid on themselves, others, or notes, splash themselves in the eye, etc. Don't be the bad example to others, remembered for all time for something stupid!
·         Identify the Safety Equipment
And know how to use it! Given that some people (possibly you) will need them, know the locations of the fire blanket, extinguishers, eyewash, and shower. Ask for demonstrations! If the eyewash hasn't been used in a while the discoloration of the water is usually sufficient to inspire use of safety glasses.
·         Don't Taste or Sniff Chemicals
For many chemicals, if you can smell them then you are exposing yourself to a dose that can harm you! If the safety information says that a chemical should only be used inside a fume hood, then don't use it anywhere else. This isn't cooking class - don't taste your experiments!
·         Don't Casually Dispose of Chemicals Down the Drain
Some chemicals can be washed down the drain, while others require a different method of disposal. If a chemical can go in the sink, be sure to wash it away rather than risk an unexpected reaction between chemical 'leftovers' later.
·         Don't Eat or Drink in Lab
It's tempting, but oh so dangerous... just don't do it!
·         Don't Play
Don't haphazardly mix chemicals! Pay attention to the order in which chemicals are to be added to each other and do not deviate from the instructions. Even chemicals that mix to produce seemingly safe products should be handled carefully. For example, hydrochloric acid and sodium hydroxide will give you salt water, but the reaction could break your glassware or splash the reactants onto you if you aren't careful!
·         Take Data During Lab
Not after lab, on the assumption that it will be neater. Put data directly in your lab book rather than transcribing from another source (e.g., notebook or lab partner). There are lots of reasons for this, but the practical one is that it is much harder for the data to get lost in your lab book. For some experiments, it may be helpful to take data beforelab. No, I'm not telling you to dry-lab or cheat, but being able to project likely data will help you catch bad lab procedure before you are three hours or so into a project. Know what to expect. You should always read the experiment in advance.

Original IDLH Value

$
0
0
Substance
Original IDLH
Value
Revised IDLH
Value
Acetaldehyde 10,000 ppm2,000 ppm
Acetic acid1,000 ppm50 ppm
1,000 ppm200 ppm
Acetone20,000 ppm2,500 ppm [LEL]
Acetonitrile4,000 ppm500 ppm
10 ppm8 ppm
Acrolein5 ppm2 ppm
AcrylamideUnknown60 mg/m3
Acrylonitrile500 ppm85 ppm
Aldrin100 mg/m325 mg/m3
Allyl alcohol150 ppm20 ppm
Allyl chloride300 ppm250 ppm
270 ppm50 ppm
2 Aminopyridine5 ppm5 ppm [Unch]
Ammonia500 ppm300 ppm
5,000 mg/m31,500 mg/m3
n-Amyl acetate4,000 ppm1,000 ppm
9,000 ppm1,000 ppm
Aniline100 ppm100 ppm [Unch]
o-Anisidine50 mg/m350 mg/m3 [Unch]
p-Anisidine50 mg/m350 mg/m3 [Unch]
80 mg Sb/m350 mg Sb/m3
ANTU100 mg/m3
100 mg/m3 [Unch]
100 mg As/m35 mg As/m3
Arsine6 ppm3 ppm
Azinphosmethyl20 mg/m310 mg/m3
1,100 mg Ba/m350 mg Ba/m3
Benzene3,000 ppm500 ppm
7,000 mg/m31,500 mg/m3
Benzyl chloride10 ppm10 ppm [Unch]
10 mg Be/m34 mg Be/m3
Boron oxideN.E.2,000 mg/m3
100 ppm25 ppm
Bromine10 ppm3 ppm
BromoformUnknown850 ppm
1,3-Butadiene
20,000 ppm [LEL]
2,000 ppm [LEL]
2-Butanone3,000 ppm
3,000 ppm [Unch]
2-Butoxyethanol700 ppm700 ppm [Unch]
n-Butyl acetate10,000 ppm1,700 ppm [LEL]
10,000 ppm1,700 ppm [LEL]
10,000 ppm1,500 ppm [LEL]
n-Butyl alcohol8,000 ppm1,400 ppm [LEL]
10,000 ppm2,000 ppm
8,000 ppm1,600 ppm
n-Butylamine2,000 ppm300 ppm
30 mg/m3 (as CrO3)
15 mg Cr(VI)/m3
3,500 ppm250 ppm
2,500 ppm500 ppm
1,000 ppm100 ppm
50 mg Cd/m39 mg Cd/m3
9 mg Cd/m3
9 mg Cd/m3[Unc h]
100 mg As/m35 mg As/m3
Calcium oxideUnknown25 mg/m3
200 mg/m3
200 mg/m3 [Unch]
Carbaryl600 mg/m3100 mg/m3
Carbon blackN.E.1,750 mg/m3
Carbon dioxide50,000 ppm40,000 ppm
500 ppm500 ppm [Unch]
Carbon monoxide1,500 ppm1,200 ppm
300 ppm200 ppm
Chlordane500 mg/m3100 mg/m3
200 mg/m3
200 mg/m3 [Unch]
Unknown5 mg/m3
Chlorine30 ppm10 ppm
10 ppm5 ppm
20 ppm20 ppm [Unch]
100 ppm45 ppm
100 mg/m315 mg/m3
Chlorobenzene2,400 ppm1,000 ppm
2 mg/m32 mg/m3 [Unch]
5,000 ppm2,000 ppm
10 mg/m35 mg/m3
5 mg/m35 mg/m3 [Unch]
Chloroform1,000 ppm500 ppm
2,000 ppm100 ppm
Chloropicrin4 ppm2 ppm
400 ppm300 ppm
30 mg/m3 (as CrO3)
15 mg Cr(VI)/m3
N.E.
250 mg Cr(II)/m3
N.E.
25 mg Cr(III)/m3
N.E.250 mg Cr/m3
700 mg/m380 mg/m3
20 mg Co/m3
20 mg Co/m3 [Unch]
N.E.100 mg Cu/m3
N.E.100 mg Cu/m3
N.E.100 mg/m3
5,000 mg/m3500 mg/m3
250 ppm250 ppm [Unch]
Crotonaldehyde400 ppm50 ppm
Cumene8,000 ppm900 ppm [LEL]
50 mg/m3 (as CN)
25 mg/m3 (as CN)
Cyclohexane10,000 ppm1,300 ppm [LEL]
Cyclohexanol3,500 ppm400 ppm
Cyclohexanone5,000 ppm700 ppm
Cyclohexene10,000 ppm2,000 ppm
Cyclopentadiene2,000 ppm750 ppm
2,4-D500 mg/m3100 mg/m3
DDTN.E.500 mg/m3
Decaborane100 mg/m315 mg/m3
Demeton20 mg/m310 mg/m3
2,100 ppm1,800 ppm [LEL]
Diazomethane2 ppm2 ppm [Unch]
Diborane40 ppm15 ppm
125 ppm30 ppm
9,300 mg/m34,000 mg/m3
1,000 ppm200 ppm
1,000 ppm150 ppm
50,000 ppm15,000 ppm
Unknown5 mg/m3
4,000 ppm3,000 ppm
4,000 ppm1,000 ppm
250 ppm100 ppm
50,000 ppm5,000 ppm
150 ppm25 ppm
50,000 ppm15,000 ppm
Dichlorvos200 mg/m3100 mg/m3
Dieldrin450 mg/m350 mg/m3
Diethylamine2,000 ppm200 ppm
500 ppm100 ppm
2,500 ppm2,000 ppm
25 ppm10 ppm
2,000 ppm500 ppm
1,000 ppm200 ppm
400 ppm300 ppm
Dimethylamine2,000 ppm500 ppm
100 ppm100 ppm [Unch]
1,800 mg/m3200 mg/m3
3,500 ppm500 ppm
50 ppm15 ppm
9,300 mg/m32,000 mg/m3
10 ppm7 ppm
200 mg/m350 mg/m3
Dinitroocresol5 mg/m35 mg/m3 [Unch]
Dinitrotoluene200 mg/m350 mg/m3
Unknown5,000 mg/m3
Dioxane2,000 ppm500 ppm
Diphenyl300 mg/m3100 mg/m3
Unknown600 ppm
Endrin2,000 mg/m32 mg/m3
Epichlorohydrin250 ppm75 ppm
EPN50 mg/m35 mg/m3
Ethanolamine1,000 ppm30 ppm
2-Ethoxyethanol6,000 ppm500 ppm
2,500 ppm500 ppm
Ethyl acetate10,000 ppm2,000 ppm [LEL]
Ethyl acrylate2,000 ppm300 ppm
Ethyl alcohol15,000 ppm3,300 ppm [LEL]
Ethylamine4,000 ppm600 ppm
Ethyl benzene2,000 ppm800 ppm [LEL]
Ethyl bromide3,500 ppm2,000 ppm
3,000 ppm1,000 ppm
Ethyl chloride20,000 ppm3,800 ppm [LEL]
10 ppm7 ppm
Ethylenediamine2,000 ppm1,000 ppm
400 ppm100 ppm
1,000 ppm50 ppm
500 mg/m375 mg/m3
Ethyleneimine100 ppm100 ppm [Unch]
Ethylene oxide800 ppm800 ppm [Unch]
Ethyl ether
19,000 ppm [LEL]
1,900 ppm [LEL]
Ethyl formate8,000 ppm1,500 ppm
Ethyl mercaptan2,500 ppm500 ppm
2,000 ppm100 ppm
Ethyl silicate1,000 ppm700 ppm
FerbamN.E.800 mg/m3
N.E.500 mg/m3
500 mg F/m3250 mg F/m3
Fluorine25 ppm25 ppm [Unch]
10,000 ppm2,000 ppm
Formaldehyde30 ppm20 ppm
Formic acid30 ppm30 ppm [Unch]
Furfural250 ppm100 ppm
250 ppm75 ppm
Glycidol500 ppm150 ppm
N.E.1,250 mg/m3
Unknown50 mg Hf/m3
Heptachlor700 mg/m335 mg/m3
n-Heptane5,000 ppm750 ppm
300 ppm300 ppm [Unch]
2 mg/m32 mg/m3 [Unch]
n-Hexane5,000 ppm1,100 ppm [LEL]
2-Hexanone5,000 ppm1,600 ppm
Hexone3,000 ppm500 ppm
4,000 ppm500 ppm
Hydrazine80 ppm50 ppm
50 ppm30 ppm
100 ppm50 ppm
50 ppm50 ppm [Unch]
30 ppm30 ppm [Unch]
75 ppm75 ppm [Unch]
2 ppm1 ppm
300 ppm100 ppm
HydroquinoneUnknown50 mg/m3
Iodine10 ppm2 ppm
N.E.2,500 mg Fe/m3
Isoamyl acetate3,000 ppm1,000 ppm
10,000 ppm500 ppm
7,500 ppm1,300 ppm [LEL]
8,000 ppm1,600 ppm
Isophorone800 ppm200 ppm
16,000 ppm1,800 ppm
12,000 ppm2,000 ppm [LEL]
Isopropylamine4,000 ppm750 ppm
Isopropyl ether10,000 ppm1,400 ppm [LEL]
1,000 ppm400 ppm
KeteneUnknown5 ppm
700 mg Pb/m3100 mg Pb/m3
Lindane1,000 mg/m350 mg/m3
Lithium hydride55 mg/m30.5 mg/m3
L.P.G.
19,000 ppm [LEL]
2,000 ppm [LEL]
N.E.750 mg/m3
Malathion5,000 mg/m3250 mg/m3
Unknown10 mg/m3
N.E.500 mg Mn/m3
28 mg Hg/m310 mg Hg/m3
10 mg Hg/m32 mg Hg/m3
Mesityl oxide5,000 ppm1,400 ppm [LEL]
MethoxychlorN.E.5,000 mg/m3
Methyl acetate10,000 ppm3,100 ppm [LEL]
15,000 ppm [LEL]
1,700 ppm [LEL]
15,000 ppm3,400 ppm [LEL]
Methyl acrylate1,000 ppm250 ppm
Methylal
15,000 ppm [LEL]
2,200 ppm [LEL]
Methyl alcohol25,000 ppm6,000 ppm
Methylamine100 ppm100 ppm [Unch]
4,000 ppm800 ppm
Methyl bromide2,000 ppm250 ppm
2,000 ppm200 ppm
4,000 ppm200 ppm
Methyl chloride10,000 ppm2,000 ppm
1,000 ppm700 ppm
10,000 ppm1,200 ppm [LEL]
10,000 ppm500 ppm
2,500 ppm600 ppm
100 mg/m375 mg/m3
5,000 ppm2,300 ppm
Methyl formate5,000 ppm4,500 ppm
3,000 ppm100 ppm
50 ppm20 ppm
Methyl iodide800 ppm100 ppm
2,000 ppm400 ppm
20 ppm3 ppm
400 ppm150 ppm
4,000 ppm1,000 ppm
Methyl styrene5,000 ppm700 ppm
MicaN.E.1,500 mg/m3
N.E.5,000 mg Mo/m3
N.E.1,000 mg Mo/m3
100 ppm100 ppm [Unch]
Morpholine8,000 ppm1,400 ppm [LEL]
10,000 ppm [LEL]
1,000 ppm [LEL]
Naphthalene500 ppm250 ppm
7 ppm2 ppm
N.E.10 mg Ni/m3
Nicotine35 mg/m35 mg/m3
Nitric acid100 ppm25 ppm
Nitric oxide100 ppm100 ppm [Unch]
p-Nitroaniline300 mg/m3
300 mg/m3 [Unch]
Nitrobenzene200 ppm200 ppm [Unch]
1,000 mg/m3100 mg/m3
Nitroethane1,000 ppm
1,000 ppm [Unch]
50 ppm20 ppm
2,000 ppm1,000 ppm
Nitroglycerine500 mg/m375 mg/m3
Nitromethane1,000 ppm750 ppm
1-Nitropropane2,300 ppm1,000 ppm
2-Nitropropane2,300 ppm100 ppm
200 ppm200 ppm [Unch]
UnknownUnknown [Unch]
Octane5,000 ppm1,000 ppm [LEL]
N.E.2,500 mg/m3
1 mg Os/m3
1 mg Os/m3 [Unch]
Oxalic acid500 mg/m3
500 mg/m3 [Unch]
0.5 ppm0.5 ppm [Unch]
Ozone10 ppm5 ppm
Paraquat1.5 mg/m31 mg/m3
Parathion20 mg/m310 mg/m3
Pentaborane3 ppm1 ppm
UnknownUnknown [Unch]
150 mg/m32.5 mg/m3
n-Pentane
15,000 ppm [LEL]
1,500 ppm [LEL]
2-Pentanone5,000 ppm1,500 ppm
10 ppm10 ppm [Unch]
385 ppm100 ppm
10,000 ppm1,100 ppm [LEL]
Phenol250 ppm250 ppm [Unch]
Unknown25 mg/m3
N.E.100 ppm
N.E.10 ppm
Unknown100 ppm
Phenylhydrazine295 ppm15 ppm
Phosdrin4 ppm4 ppm [Unch]
Phosgene2 ppm2 ppm [Unch]
Phosphine200 ppm50 ppm
Phosphoric acid10,000 mg/m31,000 mg/m3
N.E.5 mg/m3
200 mg/m370 mg/m3
750 mg/m3250 mg/m3
50 ppm25 ppm
10,000 mg/m360 mg/m3
Picric acid100 mg/m375 mg/m3
Pindone200 mg/m3100 mg/m3
N.E.4 mg Pt/m3
Portland cementN.E.5,000 mg/m3
Propane
20,000 ppm [LEL]
2,100 ppm [LEL]
8,000 ppm1,700 ppm
4,000 ppm800 ppm
2,000 ppm400 ppm
Propylene imine500 ppm100 ppm
Propylene oxide2,000 ppm400 ppm
2,000 ppm500 ppm
Pyrethrum5,000 mg/m3
5,000 mg/m3 [Unch]
Pyridine3,600 ppm1,000 ppm
Quinone300 mg/m3100 mg/m3
N.E.100 mg Rh/m3
N.E.2 mg Rh/m3
Ronnel5,000 mg/m3300 mg/m3
RotenoneUnknown2,500 mg/m3
Unknown1 mg Se/m3
5 ppm2 ppm
N.E.3,000 mg/m3
Silica, crystalline (respirable dust)
N.E.
cristobalite/tridymite:
25 mg/m3
quartz/tripoli:
50 mg/m3
N.E.10 mg Ag/m3
SoapstoneN.E.3,000 mg/m3
5 mg/m32.5 mg/m3
250 mg/m310 mg/m3
Stibine40 ppm5 ppm
29,500 mg/m320,000 mg/m3
Strychnine3 mg/m33 mg/m3 [Unch]
Styrene5,000 ppm700 ppm
Sulfur dioxide100 ppm100 ppm [Unch]
Sulfuric acid80 mg/m315 mg/m3
10 ppm5 ppm
1 ppm1 ppm [Unch]
1,000 ppm200 ppm
2,4,5-TUnknown250 mg/m3
TalcN.E.1,000 mg/m3
N.E.2,500 mg Ta/m3
TEDP35 mg/m310 mg/m3
N.E.25 mg Te/m3
1 ppm1 ppm [Unch]
TEPP10 mg/m35 mg/m3
Unknown500 mg/m3
15,000 ppm2,000 ppm
15,000 ppm2,000 ppm
150 ppm100 ppm
500 ppm150 ppm
UnknownUnknown [Unch]
40 mg Pb/m3
40 mg Pb/m3 [Unch]
Tetrahydrofuran
20,000 ppm [LEL]
2,000 ppm [LEL]
40 mg Pb/m3
40 mg Pb/m3 [Unch]
5 ppm5 ppm [Unch]
5 ppm4 ppm
TetrylN.E.750 mg/m3
20 mg Tl/m315 mg Tl/m3
Thiram1,500 mg/m3100 mg/m3
400 mg Sn/m3100 mg Sn/m3
Unknown25 mg Sn/m3
N.E.5,000 mg/m3
Toluene2,000 ppm500 ppm
10 ppm2.5 ppm
o-Toluidine100 ppm50 ppm
125 ppm30 ppm
500 ppm100 ppm
1,000 ppm
1,000 ppm [Unch]
UnknownUnknown [Unch]
1,000 ppm100 ppm
4,500 ppm2,000 ppm
Triethylamine1,000 ppm200 ppm
50,000 ppm40,000 ppm
1,000 mg/m3500 mg/m3
40 mg/m340 mg/m3 [Unch]
N.E.1,000 mg/m3
Turpentine1,500 ppm800 ppm
30 mg U/m310 mg U/m3
20 mg U/m310 mg U/m3
Vanadium dust
70 mg/m3 (as V2O5)
35 mg V/m3
Vanadium fume
70 mg/m3 (as V2O5)
35 mg V/m3
Vinyl toluene5,000 ppm400 ppm
Warfarin350 mg/m3100 mg/m3
1,000 ppm900 ppm
Xylidine150 ppm50 ppm
N.E.500 mg Y/m3
4,800 mg/m350 mg/m3
Zinc oxide2,500 mg/m3500 mg/m3
500 mg Zr/m325 mg Zr/m3

World Ozone Day Spcl: Substances To Avoid

$
0
0
In order to protect Mother Earth's blanket on this World Ozone Day, you can do many little things which might save our Earth. When we join hands, there is nothing which is impossible, when it comes to saving our green and blue Earth. Today as we celebrate World Ozone Day, there are some of the substances which need to be avoided. These substances are the main cause of the depletion of the Ozone layer. According to scientific evidence, it indicates that stratospheric ozone is being destroyed by a group of manufactured chemicals, which contain chlorine or bromine. These harmful chemicals are called ozone-depleting substances or ODS. The chlorine and bromine destroy the layer at an alarming rate, by stripping an atom from the ozone molecule. A single molecule of this harmful chemical, chlorine can break apart thousands of molecules in the ozone layer. In order to save our earth, we should take measures in reducing the substances which have been given below. If we take the first step in reducing or cutting down in these substances, we will surely save our earth before time. Lets take a look at some of the substances which harm the ozone layer and help stop the use of these substances gradually on World Ozone day.

Deodorants Our favourite deodorants contain a gas called aerosols which is harmful to the ozone layer. When you inhale a large amount of these chemicals from deodorant aerosols, it is proved to be fatal. Therefore, try to use deodorants which do not consist of this harmful chemical.

Fire Extinguishers The most important object which can save you during a fire outbreak is that of a fire extinguisher. However, experts say that water or sand is the best way to put out a fire as these extinguishers contain Halon, a chemical which is harmful to the ozone layer.

Adhesives When your shoe rips out, the most basic thing you turn to is an instant adhesive which will help stick your shoe together. But, did you know that these adhesives are harmful to the ozone layer in multiple ways. Adhesives contain Methyl Chloroform which is not good for the earth's blanket.

Air conditioners In every second home, you will find an air conditioner which aids in providing cool air during the summer season. But, this very same cooler is not good for the ozone layer as it consists of Chlorofluorocarbons which damage the ozone layer gradually.

Refrigerators Home products like our refrigerator too consists of Chlorofluorocarbons which is harmful and can damage to the ozone layer. In order to protect our Mother Earth, do not make a refrigerator a necessity in your home. You can consume food on the same day and avoid storing it in the fridge.

Cleaning agents To keep our homes clean and shining always, one of the things we turn to is cleaning agents from the market. Switch to natural ways to clean your home and make it sparkle.

Vehicles The smoke which is emitted from thousands of vehicles plying on the street in every second of the day is one of the main substances which deplete the ozone layer. You can switch to electrical/ battery operated vehicles to save our earth.

Combustions When you gather a set of dry leaves and all ready to see the beautiful flame which comes out after you have lit it, you will also get to see the thick smoke rising. This thick smoke forms a blanket in the ozone layer which causes huge amounts of damage. To save our earth, we should use other forms of combustion, like smoldering.

Pesticides We are sure that the only way to get rid of those pests in our garden is by using pesticides which contain Methyl bromide. This substance is harmful to the ozone layer as it tears down the layer into a million pieces with just one spray. So, it is best for you to go in for natural ways to keep pesticides away from your garden.

Laboratories The chemical called Carbon tetrachloride which is a limited solvent used in laboratories and chemical and pharmaceutical industry, is harmful to the ozone layer. The chemical makes the layer thinner which therefore will not save our earth.

Ten deadliest natural disasters ever in India

$
0
0

Ten deadliest natural disasters ever in India

These disasters have had proved to be overwhelmingly intimidating for the country, and also pointed at its incompetence to tackle such catastrophes on a massive scale.

The recent floods and landslides in Uttarakhand have been a rude reminder for India of its historical disasters. These disasters have had proved to be overwhelmingly intimidating for the country, and also pointed at its incompetence to tackle such catastrophes on a massive scale. India has been at the receiving end of the nature's fury and has been plagued by many calamities of massive proportions in the past. Here are the ten worst natural disasters that have affected millions of lives in the country since the 17th century:


The great famine of 1876-1878
: The great famine of 1876-78, statistically, was the worst ever disaster in the Indian history. The famine took a toll on millions of lives in south India, affecting at least 5.8 crore people for a period of two years. Covering a total area of 670,000 square km, the famine caused distress to people mainly in south, south western India and later spread to the then central provinces (now Madhya Pradesh, Chhattisgarh and Maharashtra states) and also united provinces (now  Uttar Pradesh and Uttarakhand). Historians estimate that at least 3 crore people were killed in the great famine.


The third plague pandemic: The third and the last plague pandemic that the world witnessed originated in China's Yunnan province in the 1850s. The outbreak in the neighbouring country didn't have an immediate impact on India until it reached Hong Kong and Guangzhou. The world was better connected by the late nineteenth century which saw the disease making its way to India from Hong Kong through Bombay (now Mumbai). The country then saw another natural disaster under the British raj as about 1.2 crore succumbed to the plague pandemic over a period of three decades.


Bengal famine of 1770: The state of Bengal was struck by a major catastrophe in the 18th century as a famine caused deaths of about 1 crore people (approximately one-third of the then state's population) in the state. Bengal, a territory under the British East India Company, comprised of modern West Bengal, Bangladesh, and parts of Assam, Orissa, Bihar and Jharkhand. The famine caused distress in the territory between 1769 and 1773.


Bengal famine of 1943: In 1943, a massive famine struck the state of Bengal, India's rice-belt, killing at least 40 lakh people. Historians argue that though the disaster was caused by natural causes, there were man-made factors which played a bigger role. On January 9, 1943, a devastating cyclone hit the rice fields in the state, killing thousands. The subsequent outbreak of Helminthosporium oryzae fungus took further toll on the rice cultivation. The looming threat from the imperialist Japanese army that had captured the neighbouring Burmese state propelled the British raj to destroy all boats and rice stocks in coastal Bengal. This further led to mass scale starvation in the state.


Deccan famine of 1632-33: A total of 20 lakh Indians died in the Deccan famine of 1632-33. One of the most severe famines to have affected the country in the Mughal era, the famine, according to the historians, was caused by the result of the three successive staple crop failures which led to starvation and diseases that were incurable then.


1839 Coringa cyclone: The ancient city of Coringa in the present day Andhra Pradesh was famous for ship building and repairing. A disastrous cyclone, on November 25, 1839, destroyed the entire city, killing at least 3.2 lakh people. According to statistics, at least 25,000 ships and vessels in the harbour city were ruined by the monstrous storm.


1737 Calcutta cyclone: A natural disaster that struck Calcutta on October 7, 1737 left 3 lakh people dead. The nature of the disaster and the number of dead in the city has been debated since then. Though popular belief in Europe at that time was that the tragedy happened due to an earthquake, Thomas Joshua Moore, the then duties collector of the city for the East India Company claimed that only 3,000 of the city's people were killed by a storm and flood.


AFP photos


2001 Gujarat earthquake: A powerful earthquake, measuring 7.9 on the Richter scale hit the Gujarat state on January 26, 2001 killing at least 30,000 people. According to statistics, 6,356 houses in Bhuj alone - the epicentre of the quake - were destroyed by the disaster.


AFP photos

 
2004 Indian Ocean Tsunami
: A destructive Tsunami in the Indian Ocean in 2004, triggered by a powerful earthquake - measuring 9.0 on the Richter scale - caught the attention of the world as it killed more than 10,000 people in India alone. Perhaps the most powerful Tsunami in history, the disaster severely affected 150,000 people in 11 countries. Experts say the Tsunami was so powerful that its impact can be equated to the energy of 23,000 Hiroshima-type atomic bombs.


Getty Images


1993 Latur earthquake: The Latur earthquake in 1993 was one of the most devastating ones in modern India. Measuring 6.4 on Richter scale, the disaster killed more than 20,000 people. The Latur district was brutally hit by three aftershocks on the same day which damaged more than 2 lakh houses in 13 neighbouring districts. Nearly 1, 27,000 families were affected by the tragedy in Maharashtra.
 http://in.news.yahoo.com/ten-deadliest-natural-disasters-ever-in-india-101520120.html?page=all

List of Indian state trees

$
0
0

This is a list of state flowers of the states and union territories of India:

$
0
0

This is a list of Indian state (and union territory) birds:

$
0
0

Principle of Hygrometer and Its Use

$
0
0


  •  


Sep 17, 2013

Know how hygrometer works in determination of relative humidity in pharmaceutical manufacturing and its use in humidity control.


Hygrometers are essential device for industries  because moisture in environment causes great effect on industrial  products during manufacturing. Relative humidity of atmosphere is measured by the hygrometer in percentage.

Hygrometer contains two thermometers one is called dry bulb and second as wet bulb. According to their names dry bulb remains dry in the air and wet bulb is surrounded by a cotton wick that is dipped in the water. Wet bulb plays main role in the measurement of the humidity.


Hygrometer works on the phenomenon called evaporative cooling. When water evaporates from any surface, it becomes cool because water molecules take heat energy from the surface during the evaporation. Due to this cooling effect wet bulb always shows low temperature than the dry bulb. You can understand this with the conditions when you are felling very hot and you take bath with water. Water evaporates from our body taking some heat and you feel cool for some time.

Evaporation of water from the surface of wet bulb is inversely proportional to the humidity in the atmosphere. In dry atmosphere when humidity is low, the evaporation of water will high resulting the more decrease in wet blub temperature. But when atmosphere is humid having higher humidity, the evaporation of water from wet bulb remains low resulting the less decrease in the wet bulb temperature. At 100 percent humidity the temperature of dry and wet bulb will be same due to no water evaporation from the wet bulb hence no cooling effect occurs.

Relative humidity is determined by the difference of the temperatures of dry bulb thermometer and wet bulb thermometer. Always water is used in hygrometers. When we use alcohol in wet bulb, temperature drops very rapidly and gives more difference between dry and wet bulbs because water evaporates more rapidly from the wet bulb’s surface than water giving more cooling effect. But when we use oil in wet bulb having no evaporation, the temperature of both bulbs remain same due to no cooling effect.


Relative humidity is determined using the following table. 


Indian scientist Veerabhadran Ramanathan to be awarded UN's highest environmental award

$
0
0

Indian scientist Veerabhadran Ramanathan to be awarded UN's highest environmental award

Tuesday, Sep 17, 2013, 22:56 IST | Place: Mumbai | Agency: DNA Web Team
 
The atmospheric scientist of Indian origin is nominated along with other leaders from government, civil society and the private sector.
- http://www-ramanathan.ucsd.edu/index.php
The name Veerabhadran Ramanathan may not sound familiar, but this atmospheric scientist of Indian origin has been doing wonders around the globe for many years and has recently been nominated to receive 'Champions of the Earth award', the UN's highest environmental award, United Nations Environment Programme (UNEP) announced on Tuesday.

Ramanathan, who hails from Madurai, India received his bachelors degree in engineering from Annamalai University, India in 1965 and his masters degree from Indian Institute of Science, India in 1970. Later he completed his Ph.D. from State University of New York at Stony Brook on Planetary Atmospheres in 1974.

Dr. Ramanathan is a Distinguished Professor of Atmospheric and Climate Sciences at the Scripps Institution of Oceanography, University of California, San Diego. He currently chairs an international science team from Asia, Africa and Latin America under the Atmospheric Brown Clouds Program sponsored by the United Nations Environmental Programme.

For over 30 years, he has been conducting original research in Climate and Atmospheric Science.

As Director of the Center for Clouds, Chemistry, and Climate at Scripps Institution of Oceanography, he conducts International field campaigns, develops unmanned aircraft platforms for tracking atmospheric brown cloud (ABC) pollution worldwide, and educates and trains the next generation of scientists.

His major focus now is on developing practical solutions for mitigating global climate change and slowing down the retreat of the Himalayan glaciers.

Project Surya, a cook-stove project which attempts to eliminate climate warming pollutants from traditional bio-mass cooking, is his first climate mitigation project.

His landmark research showed that cutting emissions of ‘black carbon’ or soot can significantly lessen the impacts of climate change, improve the health of millions of rural poor, and avoid crop losses.

Ramanathan has been among the most prominent scientific voices calling for collective action to cut emissions of short-lived climate pollutants to slow the pace of global warming, and achieve multi-billion dollar health benefits.

A major UNEP study in 2011, on which Ramanathan acted as vice-chair and senior contributor, presented 16 actions to cut black carbon and methane emissions, which, if implemented, would save close to 2.5 million lives a year through reduced respiratory illnesses, avoid crop losses amounting to 32 million tonnes annually, and deliver near-term climate protection of about 0.5 °C by 2050.

The prize is awarded annually to leaders from government, civil society and the private sector, whose actions have had a significant and positive impact on the environment. Other winners to receive Champions of the Earth award are Google Earth; Carlo Petrini, the founder of the Slow Food Movement; Izabella Teixeira, Minister of Environment, Brazil; Jack Dangermond, founder of the Environmental Systems Research Institute (ESRI), and Martha Isabel Ruiz Corzo from the Sierra Gorda Biosphere Reserve in Mexico.
Viewing all 8088 articles
Browse latest View live