Quantcast
Channel: EHSQL(Environment-Energy ,Health,Safety, Security and Social Ac. ,Quality-Lab) Technical services
Viewing all 8140 articles
Browse latest View live

Methane Hydrates Reserves

$
0
0
Methane Hydrates Reserves
The Minister of State (I/C) for Petroleum & Natural Gas Shri Dharamendra Pradhan informed the Lok Sabha in a written reply that based on available geological and geophysical data, the prognosticated reserves of gas hydrates / methane hydrates is 1894 Trillion Cubic Meters for India.

Currently, there is no proposal for framing a national policy on methane hydrates as it is at a research and development stage.

The Ministry of Petroleum and Natural Gas (MOP&NG), Government of India formulated the National Gas Hydrates Programme (NGHP) in 2000. The program is aimed at facilitating research, sharing knowledge and scientific data besides keeping the Indian scientists abreast with international developments. MOP&NG / Directorate General of Hydrocarbons (have signed a number Memoranda of Understanding (MoU) with various agencies over the years.

NGHP Expedition-01 was launched in 2006 to gather information on the presence of Gas Hydrates in Indian offshore areas of western, eastern and Andaman Sea. 21 cores were collected and 39 holes/ wells drilled which established presence of Gas Hydrates in KG and Mahanadi basins and Andaman deep waters in numerous complex geological settings. Under NGHP Expedition-02, 20 sand prone sites have been identified for logging while drilling; wire line logging; coring and drilling of 40 wells.

Production Performance of Oil & Natural Gas Sector for the month of October, 2014

$
0
0
Production Performance of Oil & Natural Gas Sector for the month of October, 2014


I.       
A. CRUDE OIL PRODUCTION  – PERFORMANCE


Month / Period
Planned Target (TMT)
Actual Production (TMT)
%age achievement
Surplus(+) Shortfall(-) Vis-à-vis target (%age)
Surplus(+) Shortfall(-) over last year   (%age)


October, 2014*
3287.936
3217.659
97.9
-2.1
1.0


April,2014-October, 2014*
22685.338
21819.586
96.2
-3.8
-0.9


April,2013-October, 2013

22021.222


TMT: Thousand Metric Tonnes.                                                               *: Provisional.


B. COMPANY-WISE ACHIEVEMENT


Company / State
Planned Target (TMT)
Actual Production (TMT)
%age achievement
Surplus(+) Shortfall(-) (%age)


ONGC
2002.298
1903.284
95.1
-4.9


  Gujarat
414.583
386.640
93.3


  Andhra Pradesh
20.920
19.966
95.4


  Tamil Nadu
20.434
18.654
91.3


  Assam
107.858
88.605
82.1


Offshore
1438.503
1389.419
96.6


OIL
306.435
297.166
97.0
-3.0


  Assam
305.622
296.614
97.1


  Arunachal Pradesh
0.813
0.552
67.9


PRIVATE/JVC
979.203
1017.209
103.9
3.9


TOTAL
3287.936
3217.659
97.9
-2.1


C. REASONS FOR SHORTFALL


Company / State
Reasons for shortfall


ONGC (offshore)
Less production from few wells of NBP field / ESP reinstallation in three wells in Mumbai High. Out of three wells requiring workover, one well put on production and rig -deployment planned in remaining two wells in Nov/Dec 2014. Restricted production in Heera-Neelam due to clamping of sub-sea lines


ONGC (Gujarat)
More than envisaged decline of base potential in Kalol, Ahmedabad & Limbodara fields and closure of wells due to less off-take by M/s. GAIL affected production. Natural decline in brown fields, increasing water cut & more than envisaged decline in Gandhar and Nada fields affected production.


ONGC (Assam)
Natural decline in brown fields & frequent power failure affected production.


ONGC (Andhra Pradesh & Tamil Nadu)
Closure of wells due GAIL pipeline incident affected the production.


OIL (Assam & Arunachal Pradesh)
Less production due to consequential effects of Bhands & Blockades. Un-expected rise in water oil ratio/ gas oil ratio in few high productive wells  ( Bazaloni-3, BRK-8, MRN-37, BGN-14). Less contribution from drilling due to  non-availability of drilling Rigs: (a)One rig package has to be transferred from Assam to Mizoram for time bound NELP drilling. (b) Non-mobilisation of Drilling Rig by the contractor despite issue of LOA in advance and repeated follow up.


Pvt/JVCs  (Arunachal Pradesh)
Due to repeated sand ingress in existing wells.


Pvt/JVCs  (Gujarat)
Well ceased due to high water cut and SRP failure in two wells.


Pvt/JVCs  (Off-shore)
MA-6H Well underperforming, MA field was shutdown due to cyclone from 11-13 Oct 2014. 4 Wells in MA field are closed due to water loading in Eastern Off-shore.


A statement showing Crude Oil Production during October, 2014 and cumulatively for the period April,2014- October, 2014 vis-à-vis 2013-14 is at Annexure-I.


1


II.        A.  NATURAL GAS PRODUCTION PERFORMANCE


Month / Period
Planned Target (MCM)
Actual Production (MCM)
%age achieve-ment
Surplus(+) Shortfall(-) Vis-à-vis target    (%age)
Surplus(+) Shortfall(-) over last year     (%age)


October, 2014*
3127.168
2838.269
90.8
-9.2
-4.2


April,2014-October, 2014*
21189.612
19630.437
92.6
-7.4
-5.6


April,2013-October, 2013

20801.379


MCM: Million Cubic Metres.        


*: Provisional.


B.     COMPANY-WISE ACHIEVEMENT


Company / State
Planned Target (MCM)
Actual Production (MCM)
%age achievement
Surplus(+) Shortfall(-) (%age)


ONGC
2036.782
1879.775
92.3
-7.7


  Gujarat
116.956
122.253
104.5


  Rajasthan
1.320
0.359
27.2


  Andhra Pradesh
86.362
6.569
7.6


  Tamil Nadu
116.541
105.737
90.7


  Assam
38.567
40.790
105.8


  Tripura
119.035
96.326
80.9


  Mumbai High Offshore
1558.001
1507.741
96.8


OIL
251.418
222.133
88.4
-11.6


  Assam
227.748
201.989
88.7


  Arunachal Pradesh
1.860
1.033
55.5


  Rajasthan
21.810
19.111
87.6


PRIVATE/JVC
838.969
736.361
87.8
-12.2


  Onshore $
147.748
118.840
80.4


  Offshore
691.221
617.521
89.3


TOTAL
3127.168
2838.269
90.8
-9.2


$: Including Coal Bed Methane production.


C.     REASONS FOR SHORTFALL


Company / State
Reasons for shortfall


ONGC (Rajasthan)
Less offtake by consumers.


ONGC (Andhra Pradesh & Tamil Nadu)
Closure of wells due GAIL pipeline incident affected the production.


ONGC (Tripura)
Less offtake by consumers.


ONGC (Offshore)
Closure of wells (G1-10 & G1-11) as M/s GAIL stopped taking gas due to pipeline issues at their end. Production  resumed from one well from 31-Oct-14 in Eastern Off-shore. Less than envisaged production from Bassein field


OIL (Assam & Arunachal Pradesh)
Low gas withdrawal by gas customers. Due to pending commissioning of Gas Cracker plant by BCPL withdrawal is only @ avg. 0.02 MMSCMD against planned withdrawal rate of 0.535 MMSCMD (shortfall 16.5 MMSCM)


OIL ( Rajasthan)
RRVUNL :  frequent shutdown, operating at low efficiency due to grid problem.


Pvt/JVCs  (West Bengal)
 Delayed forest clearance received and Prolonged dewatering in new wells.


Pvt/JVCs  (Madhya Pradesh & Jharkhand)
Incidental CBM gas being produced in small quantities


Pvt/JVCs  (Off-shore)
Natural Decline of the RAVVA field. Non-associated gas wells are closed from 3-7-2014 after GAIL pipeline accident near Tatipaka and partial off take had begun wef 19.10.2014 by GAIL. 4 wells of MA and 10 wells of D1 D3 fields are closed due to high water cut and sand ingress. Less production due to well integrity issues & water loading of well in Western off-shore.


A statement showing natural gas production during October, 2014  and cumulatively for the period April,2014- October, 2014 vis-à-vis 2013-14 is at Annexure-II.


2


III.  A. REFINERY CRUDE THROUGHPUT


    (IN TERMS OF CRUDE OIL PROCESSED)


Month / Period
Planned Target (TMT)
Actual Production (TMT)
%age achievement
Surplus(+) Shortfall(-) Vis-à-vis target             (in %age)
Surplus(+) Shortfall(-) over last year          (in %age)


October, 2014*
18629.731
19115.370
102.6
2.6
4.2


April,2014-October, 2014*
130204.702
127798.043
98.2
-1.8
-1.7


April,2013-October, 2013

129996.224


*: Provisional.


Note:


The crude throughput in IOC (Gujarat & Bongaigaon ), BPCL (Kochi), HPCL(Mumbai & Visakh), NRL, (Numaligarh),  HMEL (GGSR), BORL (Bina), EOL (Vadinar) and RIL (Jamnagar DTA )  refineries have exceeded their planned target. Crude throughput in BORL (Bina) and IOCL (Gujarat) is higher than the planned production due to deferment of planned shutdown.


The crude throughput in  IOC (Guwahati, Barauni, Haldia, Panipat, Digboi & Mathura),  BPCL (Mumbai), CPCL (Manali & CBR), MRPL (Mangalore), ONGC (Tatipaka) and RIL (SEZ) refineries was less than their planned target.


Company / State
Reasons for shortfall


IOCL, Panipat
Marginally lower crude throughput in line with HSD demand.


IOCL,Guwahati
Throughput is in  line with Assam crude receipt.


IOCL,Barauni
Throughput is restricted due to low demand of HSD.


IOCL, Haldia
Marginally shortfall due to low demand of  HSD.


IOCL, Mathura
Throughput is in  line with black oil demand.


BPCL, Mumbai
DHDS unit was shutdown for 20 days in the month of Oct`2014 for RGC motor repair job. This has resulted in build-up of HS HSD intermediate stock. Increase in intermediate stock. Increase in HS HSD stock has resulted in reduction of crude throughput.


CPCL , Manali
Crude throughput lower than plan due to CDU II shutdown for Atmospheric column tray modification jobs.


CPCL , Narimanam
Throughput is lower than planned due to reduced  availability of Crude (KG-D6 not available after April`14)


A statement showing refinery-wise production during the month of October, 2014 and cumulatively for the period April,2014-October, 2014 vis-à-vis 2013-14 is at Annexure-III.


IV.  REFINERY CAPACITY UTILISATION


Month
Utilisation (%)
Period
Utilisation (%)


October, 2014*
104.7
October, 2013- October, 2014
101.4


October, 2013
100.4
October, 2012- October, 2013
103.1


The refinery-wise details of the capacity utilisation during October, 2014 and cumulatively for the period April, 2014 - October, 2014 vies-a-vies 2013-14 are given in Annexure-IV.

Indian Railways Going Green the Bio-Diesel Way

$
0
0
Indian Railways Going Green the Bio-Diesel Way

Feature
The Bio-Diesel


*Sachinder Mohan Sharma 

With growth in the world economy the demand for energy and transportation has been increasing.  The BRICS nations have been growing and China and India today are consuming higher levels of fuel to sustain their growing economies.  The overall energy requirement in India is likely to increase from 549 Million tonne oil equivalent (mtoe) in 2011-12 to 1433 mtoe by 2031-32, a 2.6 fold increase.  The transport sector which currently consumes 86 mtoe which is about 16% of the energy consumption is likely to increase to 360 mtoe by 2031-32 and would be 25% of the total energy consumption.  The transport sector would grow by 4.2 times.  The transport sector consumed 57% of the oil in 2011-12 and this would go up-to 73% by 2031-32 in the business as usual scenario. About  97% of the fuel basket for transportation is based on petroleum and the balance 3% is equally shared by CNG, bio-fuels and electricity.  As per the current trends this mix would continue even in 2031-32.  If we look at the consumption pattern in the transport sector, the road vehicles consume 93% of the oil, 3% each is consumed by Railways and Airways and the balance 1% by waterways. 

            Indian Railways (IR) today has the largest passenger operation in the world and carries about 23 million passengers every day.  Recently it has also entered the billion tonne club and is expected to carry more than 1100 million tonne of freight traffic in the current year.  For providing transport services Indian Railways consumes 2.7 billion liters of high speed diesel and 13.9 billion units of electricity. Most of the electricity consumed is also produced using fossil fuels like coal, diesel etc. Higher use of fossil fuels means higher carbon foot prints in transpiration.  It is in this context that IR has envisaged in its vision 2020 to ensure that 10% of its energy needs are met through renewable.  Bio-diesel is a substitute for diesel and can be sourced from various raw materials.  It is green and renewable and can be blended with diesel and used without any modification to the locomotives. Use of B5 blend translates into a requirement of about 0.13 billion litres.   However, volatility of the oil market also impacts the demand/supply of bio-diesel since it is a substitute for diesel.

            In this context a bio-fuels 2014 conference which was recently held in Delhi on 5thNovember, 2014 was relevant for the transport sector.  The theme of the conference was “Energize Growth & Business opportunities in Biodiesel Sector in India”. It provided opportunity for policy makers, researchers, consultants, industry professionals, consumers, manufacturers and sellers from both private and public sector to interact and share their views on a common platform.  The inaugural address was delivered by the Hob’ble Union Minister of Railways, The Hon’ble Union Minister for Shipping Road Transport and National Highways, Rural Development and Panchayati Raj the Hon’ble Minister of State for Railways and Dr. Suresh Prabhu, ex. Power Minister, Government Of India. The meeting was also attended by the Chairman, Railway Board, Member Staff/Member Electrical, Ministry of Railways and other senior officials.  They stressed the importance of alternate fuels especially bio-fuels to reduce oil imports and carbon emissions. 

            Indian Railways has already conducted trials with 20% blending on diesel engine test bed at RDSO.  Field trials have also been done with B5/B10 and many units like Shakurbasti, Kharagpur, Perambur etc. have manufactured bio-diesel using small plants of upto 2000 literes per day. Railways also tried to plant Jatropha trees along the tracks but were not very successful.

            Issues of transportation, blending, storage and dispensing were deliberated during the conference.  The manufacturers gave their prospective on raw material, bio-diesel plants and technology for production.  Singapore based manufacturers JOil provided ideas on how to improve the yield and adopt best practices in production of seeds.  Bio cube from Australia show cased their technology for off grid bio diesel production with zero discharge. The socio-economic impact of bio-diesel was also deliberated upon by looking at linking science, living hoods and polices for sustainable bio fuels.  The conference tried to outline the road ahead for proliferation of bio fuel in the transport and Railway sector. 

Railways being the single largest bulk consumer have to set an example in the use of green fuels for sustainable transportation.  These efforts are essential as it is estimated that climate change mitigation and adaptation measures will cost around 5% of the world GDP and the developing countries would be worst affected.  


*Sachinder Mohan Sharma is Director E&R, Railway Board
(PIB Features)
Email: - featuresunit@gmail.com
himalaya@nic.in

WÖSTHOFF MIKROGAS® and ULTRAGAS® Analyzers

$
0
0
WÖSTHOFF MIKROGAS® and ULTRAGAS® Analyzers
Principle of Conductimetric Measurement
The conductimetric measurement principle utilized by H. Wösthoff, GmbH, introduces a previously metered sample gas into a suitable liquid reagent of measured electrical conductivity. The volumetrically proportioned streams of sample gas and liquid reagent combine, changing the conductivity of the reagent solution. The resulting difference in conductivity of the reacted reagent solution is proportional to the concentration of the sample gas being measured.

Gas Analyzer


The above figure shows an apparatus configuration in which liquid reagent conductivity is first measured at Electrode 1 (before introduction of the sample gas) and then again at Electrode 2 after the sample gas and reagent have thoroughly mixed in the reaction run and are again separated.

ULTRAGAS® Series

Gas Analyzers for Laboratory, Research and Ambient Measurements
Methodology and Application
Utilizing the principle of conductivity measurement, ULTRAGAS® instruments provide continuous reading or batch analysis for laboratory and pilot project applications; closed chamber research; environmental; specialty gas production analysis; petroleum, chemical, pharmaceutical and other industrial process laboratories; and ambient air applications involving one or more of the following gases: CO, CO2, CH4, NH3, H2S, SO2, HCl, COCl2, CWK, COS, CS2, HCN; other hydrocarbons. This direct wet-gas measurement principle does not require a dry-gas sample as with other analyzer measurement techniques.

Calibration
The amount and cost of compressed calibration gas standards is significantly reduced, since the required sample gas flow rate is so small (±3.5 l/hr).

ULTRAGAS® General Specifications
Single or Multiple
Measuring Ranges:
As low as 0-10 ppm; User Determined
As high as 0-5000 ppm; User Determined
Detectable limits:As low as 0.1 ppm
Accuracy:Better than 1% full scale
Zero Drift:Less than 0.3% of full scale per 24 hours
90% Time:80/150 seconds
Sampling Flow Rates:Continuous:Sample gas58 ml/min
Reagent0.8-1.6 ml/min
Volume Required:Batch:
150 ml minimum
Temperature:2-35 ºC
Sample Gas Pressure:Atmospheric
Signal/Display:0/4-20 mA / recorded as ppm or % by volume; continuous reading analog or digital display; chart recorder display or other data (PC) interface; pre-set alarm
Maintenance Interval:User Determined
MIKROGAS® Series

Gas Analyzers for Continuous Emissions Monitoring (CEM);
Ambient Monitoring and Process Gas Analysis
Applications and Methodology
MIKROGAS® instruments employ the conductimetric measuring principle and continuously measure concentrations of SO2, HCl, H2S, NH3, Cl2, COCl2, COS CS2, HCN and other gases in stack and incineration emissions (CEMs), before or after cleaning; ambient air; standing tanks; waste treatment plants; petroleum, chemical and other industrial process streams.

This direct wet-gas measurement principle does not require the use of a dry-gas sample; nor is a dilution sampling probe required for CEM applications.
Interferences and Sample Loss
Reactive components or interfering gases contained in a sample gas stream are eliminated by filtration in the sampling probe; condensation; absorption; or chemical washing prior to entering the measuring system. Some measurement applications require use of heated sampling probes and lines to avoid sample loss.

Instrument Configuration
MIKROGAS® analyzers are available as stationary (wall mount, 19" rack, pedestal) or easily-portable units.

Calibration
MIKROGAS® analyzers may be calibrated directly at the instrument or at the CEM sampling probe. The amount and cost of compressed calibration gas standards is significantly reduced, since the required sample gas flow rate is so small.

MIKROGAS® General Specifications
Single or Multiple
Measuring Ranges:
As high as may be required; User Determined
As low as 0-1.0 ppm; User Determined
Detectable limits:Smaller than 2-5% full scale; as low as 0.04 to 0.10 ppm
Accuracy:Better than 2-3% full scale
90% Time:80-160 sec
Sample Gas Flow:As low as 4.0-10.0 l/hr
Temperature:2-45 ºC
Signal/Display:0/4-20 mA; continuous reading analog or digital display; chart recorder display or other data (PC) interface; pre-set alarm
"O" Point Deviation:± 0.73% over 4 week maintenance interval
Weight:30 lbs. (Portable Unit)
Maintenance Interval:4-6 weeks

Bhopal Gas Tragedy

$
0
0

Bhopal Gas Tragedy

INTRODUCTION
The Bhopal disaster was an industrial disaster that occurred in the city of Bhopal, Madhya Pradesh, India, resulting in the immediate deaths of more than 3,000 people, according to the Indian Supreme Court. A more probable figure is that 8,000 died within two weeks, and it is estimated that the same number have since died from gas related diseases.
The incident took place in the early hours of the morning of December 3, 1984, in the heart of the city of Bhopal in the Indian state of Madhya Pradesh. A Union Carbide subsidiary pesticide plant released 42 tonnes of methyl isocyanate (MIC) gas, exposing at least 520,000 people to toxic gases. The Bhopal disaster is frequently cited as the world's worst industrial disaster. The International Medical Commission on Bhopal was established in 1993 to respond to the disasters.
TRAGEDY
In the early hours of December 3, 1984, on what was a bracing winter morning, mixed with the winter breeze, was a highly toxic grey cloud that was emerging from the Union Carbide 'C' factory. This poisonous substance, stored in tank number 610 of the factory was later found to be Methyl Isocynate (MIC), which had got contaminated with water. According to experts, MIC is considered to be an extremely reactive chemical and is used to produce insecticides. When water got mixed with this MIC, an exothermal chemical reaction started which resulted in a lot of heat being produced. As the pressure in the tank built up beyond safe levels, the safety valve burst open violently and the gas leaked. As around forty tons of this gas spread through the city, there was no alarm or any kind to warn the inhabitants of this populous town. Since the gas leaked out from a 30 meter chimney, it was not high enough for the people to escape the effects. Later studies have shown that the effect of this toxic gas was especially harsh because of the high moisture content in the gas, which when exposed, started evaporating and being a heavy gas, the gas started moving downwards. The movement of the wind was also such that the gas spread through the city much faster than it otherwise would have.
BACKGROUND, SUMMARY & CAUSES
The Union Carbide India, Limited (UCIL) plant was established in 1969. 51% was owned by Union Carbide Corporation (UCC) and 49% by Indian authorities. It produced the pesticide carbaryl (trade mark Sevin).
Methyl isocyanate (MIC), an intermediate in carbaryl manufacture, was used instead of less toxic but more expensive materials. UCC was well aware of the substance's properties and how it had to be handled.
In 1979, a plant for producing MIC was added to the UCIL plant. UCC was responsible for all technique and design. The plant was located close to a densely populated area, instead of on the other side of the town where UCIL was offered an area. MIC was stored in a few large tanks instead of several small tanks.
During the night of December 3rd 1984, large amounts of water entered tank 610, containing 42 tonnes of methyl isocyanate. The resulting reaction generated a major increase in the temperature of liquid inside the tank to over 400°F (200°C). The MIC holding tank then gave off a large volume of toxic gas, forcing the emergency release of pressure. The reaction was sped up by the presence of iron from corroding non-stainless steel pipelines.
There have been several theories on the reason for the entry of water into the tank. The workers claim that, because of the bad maintenance with leaking valves etc, it was possible for the water to climb from the point where the pipeline washing was performed to tank 610. UCC maintains that this was not possible, and that it was an act of sabotage by a "disgruntled worker" who introduced water directly into the tank.
The two most important factors leading to the mega-gas leak were plant design (using hazardous chemicals instead of less dangerous, storing in large tanks, possible corroding material in pipelines etc), and the economic pressure and cutting back on expences (reduction of staff, safety systems not functioning etc). Factors deciding the outcome of the leakage were location near a densely populated area, non-existing catastrophe plan, shortcomings in health care and socio-economic rehabilitation etc. Analysis shows that the parties responsible for the magnitude of the disaster are the two owners, Union Carbide Corporation and the Government of India, and to some extent, the Government of Madhya Pradesh.
EFFECTS
Within hours, the streets of Bhopal were littered with human corpses and the carcasses of buffaloes, cows, dogs and birds. An estimated 3,800 people died immediately, mostly in the poor slum colony adjacent to the Union Carbide plant. Local hospitals were soon inundated with patients, a crisis further complicated by a lack of knowledge of exactly what gas was involved, what its effects were and what the possible cure could be. Since the incident took place on a cold night when most of the people where indoors, they woke up with a burning sensation in their eyes. They rushed outdoors only to breathe greater concentrations of the gas and in panic as they ran, breathing even greater volumes of the gas, ultimately choking themselves to death. Eventually the death toll rose to more than 20,000 people with more than 5,00,000 people being affected directly and indirectly and many more thousands of families were permanently affected for generations. Two decades later, more than a few lakhs of people are still suffering from the debilitating effects of the gas which includes respiratory problems, cancer, congenital birth defects, blindness and many other diseases. Every year since then, scores more are still dying in Bhopal from the various after effects. Some of the symptoms of Methyl Isocynate contamination include cough, dyspnea or disorder of the lungs, chest pain leading to acute lung failure, cardiac arrest and death. It has resulted in many children being born with genetic defects and mutations and mental retardation. It has also had a long term impact on the reproductive cycle of affected women and the quality of their breast milk.
Besides the effects on people, according to environmentalists, the impact it has had on the ecology of that area is also far reaching. There are still hundreds of tonnes of toxic waste alone, which could lead to a continuous poisoning of the soil as well as ground water. Some areas in and around that area are still so polluted that someone entering that area is likely to lose consciousness in less than ten minutes.
AFTER - EFFECTS
Investigations into the tragedy showed that there were many shortcomings at all levels. The Union Carbide factory did not have much information about the safe storage of these highly toxic gases. The medical fraternity did not have the requisite know how to deal with such kind of contamination and at this scale. There was a lack of co-ordination between the factory and emergency services. There were not many trained professionals in that factory. Cost cutting had also had its impact on the safety of the plant, its employees and the people living around the plant. The plant was also in a densely populated area of the city which went against most known norms.
The Union Carbide factory closed down their operation in Bhopal following the tragedy, but they did not do a proper clean up of the site due to which it is a bio-hazardous zone even today. This lapse has resulted in, what many environmentalists claim, a slow and sustained pollution of the area within and around the closed factory.
After decades of court cases and arguments and investigations, though compensation has been paid to many of the victims, it is not enough and there is still a strong sense of injustice that lingers in the air. Though a compensation of nearly 470 million USD has been called for, it is undoubtedly a small amount based on the long term health consequences of exposure and the number of people affected. More than twenty years of passiveness has taken its toll. Many are calling it the world's biggest humanitarian disaster. Indirectly it has lead to massive unemployment, destitution and widespread psychological problems in the people.
DISASTER BECAUSE OF DESIGN
Bhopal is not only a disaster, but a corporate crime. It began as a classic instance of corporate double-standards: Union Carbide was obliged to install state-of-the-art technology in Bhopal, but instead used inferior and unproven technology and employed lax operating procedures and maintenance and safety standards compared to those used in its US 'sister-plant'. The motive was not simply profit, but also control: the company saved $8 million, and through this deliberate under-investment managed to retain a majority share of its Indian subsidiary. It should have come as no surprise to Carbide's management when its factory began to pose a chronic threat to its own workers and to the people living nearby.
On December 25, 1981, a leak of phosgene killed one worker, Ashraf Khan, at the plant and severely injured two others. On January 9, 1982, twenty five workers were hospitalized as a result of another leak at the plant. During the "safety week" proposed by management to address worker grievances about the Bhopal facility, repeated incidents of such toxic leakage took place and workers took the opportunity to complain directly to the American management officials present. In the wake of these incidents, workers at the plant demanded hazardous duty pay scales commensurate with the fact that they were required to handle hazardous substances. These requests were denied. Yet another leak on October 5, 1982 affected hundreds of nearby residents requiring hospitalization of large numbers of people residing in the communities surrounding the plant. After the release – which included quantities of MIC, hydrochloric acid and chloroform – the worker's union printed hundreds of posters which they distributed throughout the community, warning:
• "Beware of Fatal Accidents"
• "Lives of thousands of workers and citizens in danger because of poisonous gas"
• "Spurt of accidents in the factory, safety measures deficient."
Opposition legislators raised the issue in the State Assembly and the clamor surrounding these incidents culminated in a 1983 motion that urged the state government to force the company to relocate the plant to a less-populated area. Starting in 1982, a local journalist named Rajkumar Keswani had frantically tried to warn people of the dangers posed by the facility. In September of 1982, he wrote an article entitled "Please Save this City." Other articles, written later, bore grimly prophetic titles such as "Bhopal Sitting on Top of a Volcano" and "If You Do Not Understand This You Will Be Wiped Out." Just five months before the tragedy, he wrote his final article: "Bhopal on the Brink of a Disaster."
In the midst of this clamour, in May 1982, Union Carbide sent a team of U.S. experts to inspect the Bhopal plant as part of its periodic safety audits. This report, which was forwarded to Union Carbide's management in the United States, speaks unequivocally of a "potential for the release of toxic materials" and a consequent "runaway reaction" due to "equipment failure, operating problems, or maintenance problems." In fact, the report goes on to state rather specifically: "Deficiencies in safety valve and instrument maintenance programs.... Filter cleaning operations are performed without slip blinding process. Leaking valves could create serious exposure during this process." In its report, the safety audit team noted a total of 61 hazards, 30 of them major and 11 in the dangerous phosgene/MIC units. It had warned of a "higher potential for a serious incident or more serious consequences if an accident should occur." Though the report was available to senior U.S. officials of the company, nothing was done. In fact, according to Carbide's internal documents, a major cost-cutting effort (including a reduction of 335 men) was undertaken in 1983, saving the company $1.25 million that year.
Although MIC is a particularly reactive and deadly gas, the Union Carbide plant's safety systems were allowed to fall into disrepair. Between 1983 and 1984, the safety manuals were re-written to permit switching off the refrigeration unit and shutting down the vent gas scrubber when the plant was not in operation. Cost-cutting measures directed by the Danbury Headquarters of Union Carbide included reducing the MIC plant crew from 12 to 6. In the control room, there was only 1 operator to monitor 70+ panels. Safety training was cut from 6 months to 15 days. On the night of the deadly MIC leak, none of the safety systems designed to prevent a leak - six in all - were operational, and the plant siren had been turned off.
The process safety system included a design modification installed in May 1984 on the say-so of US engineers. This 'jumper line', a cheap solution to a maintenance problem, connected a relief valve header to a pressure vent header and enabled water from a routine washing operation to pass between the two, on through a pressure valve, and into MIC storage tank 610. Carbide's initial investigation agreed that the pressure valve was leaking but declined to mention the jumper line. Exposure to this water led to an uncontrolled reaction; a deadly cloud of MIC, hydrogen cyanide, mono methyl amine soon settled over much of Bhopal, and people began to die.
A STRUGGLE FOR JUSTICE
In the wake of the disaster, the survivors assembled to fight for justice. In January 1985 a petition was circulated by Mr. Syed Irfan, leader of the Bhopal Gas Peedit Mahila Purush Sangarsh Morcha organization, and other survivors addressing the heads of the Madhya Pradesh government for medical and monetary aid.
Few people were healthy enough after the disaster to do the sort of manual labor they had done beforehand. Many needed to be taught new crafts. The Indian Government initially set up lessons for survivors to learn trades, but did not provide decent jobs. The women at one stationary factory decided to unionize, forming the Bhopal Gas Peedit Mahila Stationary Karamchari Sangh or “Bhopal Gas-Affected Women's Stationary Worker's Union”. Led by future Goldman Award Winners Rashida Bee and Champa Devi Shukla, the union tried for months to negotiate with the government for decent wages. Finally, they marched from Bhopal to Delhi to petition the Prime Minister of India. It took them thirty-three days to reach Delhi, and even after having received some promises of support, little was done. Although the BGPMSKS struggle lasted for more than a decade, it was ultimately successful. Meanwhile, the union became deeply involved in the broader campaign for justice in Bhopal, becoming one of four key survivors organizations to spearhead the International Campaign for Justice in Bhopal.
Today, the International Campaign for Justice in Bhopal is stronger than ever before. Within the past two years the campaign has won several significant victories, improving the lives and the condition of the people of Bhopal.
Despite the horror of the night of December 3, 1984 and the chemical terror that its survivors have endured, the people of Bhopal continue their struggle for justice, for corporate accountability, and for their basic human right to an environment free of chemical poisons. The outcome of their struggle holds vast implications for all of us; if corporations aren't held accountable for their crimes, they're destined to be repeated. We all live in Bhopal.
The only memorial ever built in Bhopal was privately funded, designed by the daughter of Holocaust victims. In bold letters, the inscription reads, “No Hiroshima, No Bhopal, We Want To Live.” With your help and that of others, the justice that has been so long delayed in Bhopal cannot be denied.
CONCLUSION

The disaster did pave the way for much stricter international standards for environmental safety, preventative strategies to avoid similar accidents and a better state of preparedness to meet future industrial disaster. In India, a number of changes were made in the Indian Factories Act and environmental legislation. There is a much better understanding of the fact that industries need to apply good process safety management systems and have efficient and safe handling and storage capacities of individual reactive chemicals. Following the disaster, environmental awareness and activism in India has increased tremendously. It serves as a warning to developing nations to create the right balance between human, environmental and economic status on the path to industrialization.

Cyclone Centres

$
0
0
Cyclone Centres

Under the oversight mechanism of Earth System Science Organization (ESSO), an integrated cyclone and associated storm surge warning system is made functional all along the coastal and island regions. Such an effort has resulted into the considerable demonstrated improvement of cyclone forecast in respect of the Phailin cyclone during 08- 14 October 2013 and the Hudhud cyclone during 06-14 October 2014. For effective operational cyclone activities, an appropriate institutional mechanism comprising cyclone warning division at ESSO - India Meteorological Department (ESSO-IMD) New Delhi and three Area Cyclone Warning Centers (ACWCs) at Kolkata, Chennai, Mumbai and Cyclone Warning Centers (CWCs) at Bhubaneswar, Vishakhapatnam and Ahmadabad are made functional on 24X7 basis.

ESSO-IMD operates 24X7 monitoring of satellite based weather monitoring over the potential cyclogenic zones of the Bay of Bengal and Arabian Sea for detecting the cyclogenesis. Commissioning of the high performance computing (HPC) system has provided opportunity to assimilate satellite radiance, Doppler Weather Radar (DWR), OCEANSAT (scatterometer, total precipitable water content) data etc. of global oceans in to the global (22Km grid scale)/meso-scale (9Km grid scale) forecast systems. The performance evaluation of the updated global/meso-scale forecast systems in continuation with adoption of improved local forecast systems for the past 5-7 years have demonstrated enhanced forecast skill by about 18% quantitatively as far as the track and landfall forecasts of the tropical cyclones are concerned.

As and when the cyclone systems move in to the 500Km surveillance range of DWRs, identification of strong wind zones and pockets of heavy rainfall within the core cyclone area is carried out and their rapid changes are monitored on continuous basis. ESSO-IMD currently operates 5- Doppler Weather Radars (DWR) at Chennai, Machilipatnam, Visakhapatnam, Kolkata, Sriharikota on the east coast, 675 Automatic Weather Stations (AWS) and 1210 Automatic Rain Gauges (ARG) have been commissioned covering all districts of India. With the commissioning of the state-of-the-art observing, monitoring/ early warning and data visualization/information processing and communication technologies, several manual operations have been fully automated.

By leveraging all available modelling and observing systems along with persistent efforts, ESSO- IMD is able to increase the lead time forecast of cyclones upto 5-7 days and to reduce the track and landfall errors of cyclones by about 7% over the last 3-4 years. ESSO continuously guides the expansion, planning and augmentation of land, ocean and satellite based observing systems and implementation of advanced data assimilation forecast systems along with augmentation of high end computing, network, data reception and warning dissemination infrastructure.

This information was given today by Minister of Science and Technology and Earth Sciences Dr. Harsh Vardhan in a written reply to Lok Sabha question.

Forecasting of Natural Calamities

$
0
0
Forecasting of Natural Calamities
India is vulnerable, in varying degrees, to a large number of hazards. More than 58.6 per cent of the landmass is prone to earthquakes of moderate to very high intensity; over 40 million hectares (12%) of its land is prone to floods and river erosion; close to 5,700 km, India’s 7,516 km, long coastline is prone to cyclones and tsunamis; 68% of its cultivable area is vulnerable to droughts; and, its hilly areas are at risk from landslides and avalanches. Moreover, India is also vulnerable to chemical, biological, radiological and nuclear (CBRN) emergencies and other man-made hazards. Disaster risks in India are further compounded by increasing vulnerabilities associated with changing demographics and socio-economic conditions, unregulated urbanization, development within high-risk zones, environmental degradation, climate change, other developmental constrains, epidemics and pandemics.

Earth System Science Organization-India Meteorological Department (ESSO-IMD) is responsible for monitoring, detection and forecasting of Cyclones. ESSO-Indian National Centre for Ocean Information Services (ESSO-INCOIS), Hyderabad is responsible for monitoring, detection and forecasting of Tsunami due to sea-bed earthquakes and storm surges associated with cyclone landfall. ESSO-National centre of Seismology (ESSO-NCS) is responsible for monitoring, detection of Earthquakes along with operational research in pure and applied seismology and earthquake precursory phenomena, earthquake processes and modelling.

ESSO-IMD is also responsible for monitoring, detection and forecasting of other severe weather phenomena like norwesters (severe thunder storms), dust storms, heavy rains and snow, cold and heat waves, etc., which cause destruction of life and property. ESSO-IMD also operates Flood Meteorological Offices (FMOs) at ten locations, viz. Agra, Ahmedabad, Asansol, Bhubaneshwar, Guwahati, Hyderabad, Jalpaiguri, Lucknow, New Delhi and Patna. FMOs provide valuable meteorological support to the Central Water Commission (CWC) for issuing flood warnings in respect of the 43 rivers of India: i)Agra - Lower Yamuna and Betwa ; ii)Ahmedabad - Narmada, Tapi, Mahi, Sabarmati, Banas and Deman Ganga; iii)Asansol - Ajay, Mayurakshi and Kangsabati; iv)Bhubaneshwar - Mahanadi, Brahmani, Baiterini, Bruhaba-lang, Subernarekha, Rushkulya and Vansdhara; v)Guwahati - Brahmaputra and Barak; vi)Hyderabad - Godawari and Krishna; vii)Jalpaiguri – Teesta; viii)Lucknow - Ganga, Ramganga, Gomti, Sai, Rapti Ghagra and Samda; ix)New Delhi - Upper Yamuna, Lower Yamuna, Sahibi; x)Patna - Kosi, Mahananda, Baghmati, Kamla, Gandak, Buri Gandak,North Koel, Kanhar, PunPun and Upper Sone. The floods in plains are forecasted about 6 hours to 30 hours in advance by CWC.

Except for earthquake for which no warning system exists. ESSO-IMD operates 24X7 monitoring of satellite based weather monitoring over the potential cyclogenic zones of the Bay of Bengal and the Arabian Sea for detecting the cyclogenesis. Commissioning of the high performance computing (HPC) system has provided opportunity to assimilate satellite radiance, Doppler Weather Radar (DWR), OCEANSAT (scatterometer, total precipitable water content) data, etc. of global oceans in to the global (22km grid scale)/meso-scale(9Km grid scale) forecast systems.

Data generated from all observing systems viz. surface and upper air observations, satellite observations, aircraft observations, DWRs etc. are fully used by various forecast models to generate most representative initial state 3-D structure of the atmosphere and high resolution (9km grid scale) forecasts over India to predict heavy rainfall occurrences. Further, DWR network is primarily employed to improve the severe weather surveillance capability and for operating now-casting (very short range up to 6h in advance) service (operated for about 147 locations across India).

As and when the cyclone systems move in to the 500 km surveillance range of DWRs, identification of strong wind zones and pockets of heavy rainfall within the core cyclone area is carried out and their rapid changes are monitored on continuous basis. ESSO-IMD currently operates 5- Doppler Weather Radars (DWR) at Chennai, Machilipatnam, Visakhapatnam, Kolkata, Sriharikota on the east coast, 675 Automatic Weather Stations (AWS) and 1210 Automatic Rain Gauges (ARG) have been commissioned covering all districts of India. With the commissioning of the state-of-the-art observing, monitoring/ early warning and data visualization/information processing and communication technologies, several manual operations have been fully automated.

National Disaster Management Authority (NDMA) has formulated various hazard specific guidelines for protection of life and property during natural as well as manmade disasters. Loss of life and damage to property due to various hazards could be considerably reduced through proper planning and implementation of pre and post-disaster preparedness and management strategies by respective State and Central Government agencies in a coordinated manner. NDMA regularly conducts Mock Drills on various disasters taking all stakeholders on board for capacity building and preparedness. Annual Mock Exercise Plan is drawn in advance and Mock Exercises are conducted in State/ UTs in coordination with concerned State Disaster Management Authorities.

Further, as part of pre-disaster preparedness measure, Government of India has also completed seismic microzonation studies of some of the major cities in the country such as, Jabalpur, Guwahati, Bangalore, greater Bharuch in Gujarat, Jammu in J & K, Shillong in Meghalaya, Chennai in Tamilnadu and Sikkim state. These studies demarcate the zones of least to most damage prone areas within the urban clusters so as to help the respective town and country planning agencies to formulate perspective planning within the overall earthquake impact minimization efforts. The Government has implemented various programmes to educate and raise awareness amongst school children and general public on various aspects of hazards, their impacts and measures to mitigate losses.

This information was given today by Minister of Science and Technology and Earth Sciences Dr. Harsh Vardhan in a written reply to Lok Sabha question.

Global Warming

$
0
0
Global Warming The Government has conducted a scientific study on climate change caused by global warming and its impact on monsoon.

Ministry of Environment and Forests (MoEF), Govt of India had undertaken the Indian second National Communication to UNFCCC during 2009-2011(NATCOM-II). The communication had been a national effort which involved many multi-disciplinary scientific groups. Ministry of Earth Sciences carried out scientific studies on projected climate change and variability under Global and Regional Climate Change (GRCC) government programme under which programme a dedicated Centre for Climate Change Research (CCCR) within the Indian Institute of Tropical Meteorology (IITM), Pune, was established.

Monsoon rainfall varies on different spatial and temporal scales. Extreme rainfall events that occur at some isolated places (viz. heavy rainfall over Mumbai or in Rajasthan) are highly localized and are part of the natural variability of the Indian monsoon system itself. Although, some recent studies hint at an increasing frequency and intensity of extremes in rainfall during the past 40-50 years, their attribution to global warming is yet to be established. Moreover, the report of the Inter- governmental Panel on Climate Change and our country`s own assessment using regional climate models indicate that the extremes rainfall events are likely to be more frequent in the later part of the 21st century all over the world including India. As regards other extreme weather phenomena, there are many other reasons for their occurrence, which cannot always be related to climate change.

Although, the monsoon rainfall at all India level does not show any trend but on regional scale, areas of increasing trend is discerned. It is not clear if this increasing trend in the heavy rainfall events is attributable to global warming. Summary of the observed long term changes so far include:

(i) Mean annual surface air temperatures show a significant warming of about 0.5 degree C/100 years during the last century.

(ii) No significant long-term trends are reported in the frequencies of large-scale droughts or floods in the summer monsoon season.

(iii) The average seasonal rainfall over India has shown decline in the last five decades, especially after 1970, that is not found to be statistically significant. Further over core monsoon zone, the contribution from increasing heavy rain events is offset by decreasing moderate events and hence on the long term the change is not appreciable. Many studies have discussed the possible reasons for recent weakening monsoon.

Studies were undertaken in four climate sensitive regions of the country, viz. Himalayan Region, Western Ghats, North Eastern Region, Coastal Areas to assess the possible impacts on the four sectors viz. agriculture, water, forests and health. A Report entitled, Climate Change & India: A 4X4 Assessment – A Sectoral and Regional Assessment of Impact of Climate Change in 2030s, has been released by the Government during November, 2010 under the aegis of the Indian Network of Climate Change Assessment (INCCA).

Global warming has been attributed largely to the increase in concentration of greenhouse gases mainly from anthropogenic activities. The Government has initiated the National Action Plan on Climate Change in specific areas for addressing long term and integrated strategies for achieving key goals of sustainable development in the context of climate change, so as to reduce its adverse impacts.

Government of India is setting up a National Institute for Climate Change Studies and Actions (NICCA) under Climate Change Action Programme (CCAP) of the Ministry of Environment, Forests & Climate Change with an objective to support all scientific, technical and analytical studies relating to climate change policy and implementing strategies. The institute has an outlay of Rs. 25 crores for the 12th Five Year Plan out of an allocated budget of Rs. 290 crores for CCAP.

This information was given today by Minister of Science and Technology and Earth Sciences Dr. Harsh Vardhan in a written reply to Lok Sabha question.

Monitoring of Variability of Weather Phenomena

$
0
0
Monitoring of Variability of Weather Phenomena
The Government continuously monitors the variability of the weather phenomena, extremes and development of abnormal weather pattern potentially leading to drought, flood, flash flood, cyclone, rain induced landslides, heat cold wave, etc. on a continuous basis. Records of past weather events show that extreme values in respect of heavy rainfall, maximum and minimum temperatures, seasonal rainfall etc. remained unsurpassed in many cases.

Heavy rain events (>10 cm/day) over central India are found to have increased in the recent decades while weak and moderate events are decreasing. The extreme rain events which are becoming more intense in recent years are localized and could be part of the natural variability of the monsoon system.


The occurrence of heat wave conditions is found to be more frequent in May than in June, while very few heat waves occur in the months of March and April. The spatial changes in minimum temperature are found to be decreasing in most parts of Western Ghats and increasing in most parts of Himalayan region and certain parts of the north-eastern region and such warming is confined to winter and post-monsoon seasons. No such pattern is discerned in respect of other weather phenomena.

Spatial pattern of trend in mean annual temperature anomalies, for the period 1902-2012, suggests significant positive (increasing) trend (0.5 0C) in general with few pockets of 1.0 0C) over most parts of the country except some parts of Rajasthan, Gujarat and Bihar, where significant negative (decreasing) trend was observed. No significant long-term trends are reported in the frequencies of large-scale droughts or floods in the summer monsoon season. The total frequency of cyclonic storms that form over the Bay of Bengal has remained almost constant. Although, the monsoon rainfall at all India level does not show any trend but on regional scale, areas of increasing trend is discerned. It is not clear if this increasing trend in the heavy rainfall events is attributable to global warming.

This was stated by Union Minister of Science and Technology and Ministry of Earth Sciences Dr. Harsh Vardhan in a written reply in Rajya Sabha today.


*****

Carbon Dioxide Concentration: GEOS-5 Model

$
0
0

Carbon Dioxide Concentration: GEOS-5 Model

Description

Thumbnail
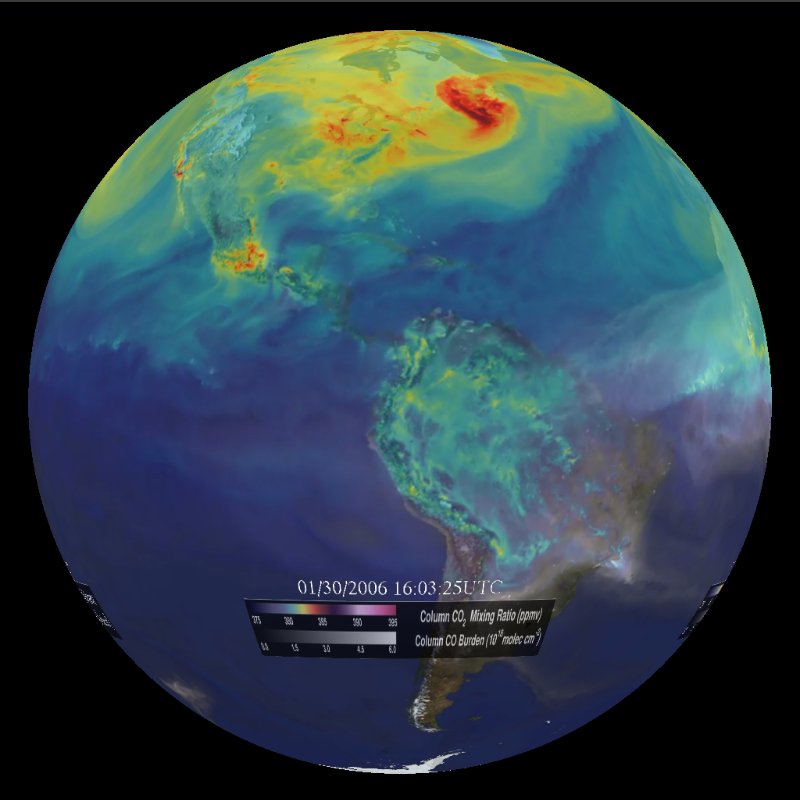
Models create a dynamic portrait of the Earth through numerical experiments that simulate our current knowledge of the dynamical and physical processes governing weather and climate variability. This new simulation of carbon dioxide in Earth's atmosphere provides an ultra-high-resolution look at how the key greenhouse gas moves around the globe and fluctuates in volume throughout the year. These three close-up views show how local geography affects the transport of carbon dioxide in the atmosphere.
The visualization is a product of a NASA computer model called GEOS-5, created by scientists with the Global Modeling and Assimilation Office at NASA's Goddard Space Flight Center, Greenbelt, Maryland. This particular simulation has about 64 times greater resolution than most global climate models. In particular, the simulation is called a Nature Run. In this kind of simulation, real data on emissions and atmospheric conditions is ingested by the model, which is then left to run on its own to simulate the behavior of Earth's atmosphere for a two-year period - in this case, May 2005 to June 2007.
The colors represent a range of carbon dioxide concentrations, from 375 (dark blue) to 395 (light purple) parts per million. The red represents about 385 parts per million. White plumes represent carbon monoxide emissions.
North American Emissions: One of the visually striking things about this animation is how much local weather patterns affect carbon dioxide in the atmosphere. In this close-up view of North America - from Feb. 1, 2006 to Mar. 1, 2006 in the simulation - you can see the major emissions sources in the U.S. Midwest and along the East Coast. As the carbon dioxide is emitted, westerly winds created by the warm currents of the Gulf Stream carry the greenhouse gas eastward over the Atlantic Ocean.
Asia and the Himalayas: In this view of Asia, two things stand out: the major emissions sources of the industrialized Asian countries, and the natural barrier of the Himalayas. As carbon dioxide concentrations swirl and move eastward, the Himalayas - the crescent-shaped mountain range just north of India - redirect winds. This video shows Feb. 1, 2006 to Mar. 1, 2006 from the simulation.
African fires: While the previous movies showed regions of major man-made emissions, this close-up shows the emission of carbon dioxide - and carbon monoxide, the plumes of white - from fires in southern Africa. This video shows Aug. 1, 2006 to Sept. 1, 2006, a period of seasonal burning in this region.

Notable Features

  • In North America, notice how weather patterns affect carbon dioxide distribution in the atmosphere. Emissions in the U.S. Midwest and East Coast are carried east by the westerly winds to the Atlantic Ocean.
  • In Asia, major emissions in industrialized Asian countries are apparent and move eastward.
  • In Africa, plumes of white, carbon monoxide emissions, are seen from fires.

50 Major Railway Stations identified for integrated cleanliness through outsourcing to Professional/Reputed Agencies

$
0
0
50 Major Railway Stations identified for integrated cleanliness through outsourcing to Professional/Reputed Agencies
Detailed guidelines for cleanliness benchmarks and monitoring issued

The Railway Board has issued a set of guidelines to all Zonal Railways for inviting tenders for engaging professional/reputed agencies for the purpose of outsourcing of cleanliness at 50 major railways station of ‘A1’ & ‘A’ categories on Indian Railways. The Minister of Railways Shri Suresh Prabhakar Prabhu has been emphasizing on sustained cleanliness activities on Indian Railways. Some of the general guidelines are;

• The cleanliness contract should be an integrated contract covering the entire station which shall include the whole geographical area of the station covering tracks, platforms, all parts of the building, concourse, approach road, parking area. In case of an enroute station the area between the two home signals and in case of a terminal station, from the entry to the circulating areas of the station to the home signal. Zonal Railways may also include the coaching depots if they are located within the geographical area of the stations.

• The scope of the cleanliness contracts shall include all areas and aspects of cleanliness, i.e., cleaning of the entire station area including tracks, rag/rubbish picking, disinfection, pest and rodent control, garbage collection, segregation of waste, disposal etc.

• The cleaning contract should be given to one single agency and there should be no mixed system of management. Departmental staff should be redeployed to nearby stations which are managed departmentally ending the mixed system prevailing there too.

• Where cleanliness is done through departmental staff, deployment of staff should be rationalized shift-wise and area-wise to ensure that each area is attended to regularly at all times throughout the day.

• The surface of the platform, concourse area including the cladding of the walls should be reviewed and broken Kota/Shahabad stones or granites should be replaced to make the surface amenable to easy cleaning.

• The Medical Officers/Commercial Officers who are in charge of the station cleanliness and chief Health Inspectors (CHIs) should visit well maintained public places like Airports, Five-star Hotels and Corporate Hospitals to observe and learn from their upkeep practices.

• Regular supervision of the contractors of AC waiting halls on Platforms, Vehicle Parking lots, loading and unloading of parcels and catering units in the station should be undertaken.

• Steam cleaners should be used to remove stains from all smooth surfaces such as floors, walls, wash-basins, urinals etc. Use of bio-enzyme products to kill bad odour in the urinals and in the concrete aprons on the tracks.

• Pest and rodent control should be an integral part of the Integrated Cleanliness Contract.

• CCTVs already installed/ those under installation as part of the Integrated Security Scheme should be utilized for monitoring cleanliness activities.

• The Division shall prescribe the details of the uniform and the protective gear which will be have to be provided to the staff by the contractor from the first day of starting of the contract.

• The selection of the agency should be through an open tender under a two packet bid system (technical and financial bid).

Fifty major stations selected for integrated cleanliness contract are; Nasik Road, Solapur, Jalgaon, Howrah, Sealdah, Bhagalpur, Patna, Mughalsarai, Gaya, Vishakapatnam, Bhubaneswar, Puri, New Delhi, Delhi, Varanasi, Lucknow, Ludhiana, Allahabad, Kanpur, Jhansi, Gorakhpur, Lucknow Jn, Kathgodam, Rangiya, New Bongaigaon, Kishanganj, Jaipur, Jodhpur, Ajmer, Chennai Central, Egmore, Trivandrum Central, Secunderabad, Vijayawada, Tirupati, Kharagpur, Tatanagar, Ranchi, Raipur, Bilaspur, Drug, Hospet, Vasco-Da-Gama, Belgaum, Mumbai Central Main, Bandra Terminus, Vadodara, Bhopal, Jabalpur, Kota.

Detailed circular is attached with this press release and also available on www.indianrailways.gov.in

NASA Computer Model Provides a New Portrait of Carbon Dioxide

$
0
0
NASA Computer Model Provides a New Portrait of Carbon Dioxide
An ultra-high-resolution NASA computer model has given scientists a stunning new look at how carbon dioxide in the atmosphere travels around the globe. Plumes of carbon dioxide in the simulation swirl and shift as winds disperse the greenhouse gas away from its sources.
Image Credit: 
NASA's Goddard Space Flight Center/B. Putman
An ultra-high-resolution NASA computer model has given scientists a stunning new look at how carbon dioxide in the atmosphere travels around the globe. Plumes of carbon dioxide in the simulation swirl and shift as winds disperse the greenhouse gas away from its sources. The simulation also illustrates differences in carbon dioxide levels in the northern and southern hemispheres and distinct swings in global carbon dioxide concentrations as the growth cycle of plants and trees changes with the seasons.
Scientists have made ground-based measurements of carbon dioxide for decades and in July NASA launched the Orbiting Carbon Observatory-2 (OCO-2) satellite to make global, space-based carbon observations. But the simulation – the product of a new computer model that is among the highest-resolution ever created – is the first to show in such fine detail how carbon dioxide actually moves through the atmosphere.
“While the presence of carbon dioxide has dramatic global consequences, it’s fascinating to see how local emission sources and weather systems produce gradients of its concentration on a very regional scale,” said Bill Putman, lead scientist on the project from NASA's Goddard Space Flight Center in Greenbelt, Maryland. “Simulations like this, combined with data from observations, will help improve our understanding of both human emissions of carbon dioxide and natural fluxes across the globe.”
The carbon dioxide visualization was produced by a computer model called GEOS-5, created by scientists at NASA Goddard’s Global Modeling and Assimilation Office. In particular, the visualization is part of a simulation called a “Nature Run.” The Nature Run ingests real data on atmospheric conditions and the emission of greenhouse gases and both natural and man-made particulates. The model is then is left to run on its own and simulate the natural behavior of the Earth’s atmosphere. This Nature Run simulates May 2005 to June 2007.
While Goddard scientists have been tweaking a “beta” version of the Nature Run internally for several years, they are now releasing this updated, improved version to the scientific community for the first time. Scientists are presenting a first look at the Nature Run and the carbon dioxide visualization at the SC14 supercomputing conference this week in New Orleans.
“We’re very excited to share this revolutionary dataset with the modeling and data assimilation community,” Putman said, “and we hope the comprehensiveness of this product and its ground-breaking resolution will provide a platform for research and discovery throughout the Earth science community.”
In the spring of 2014, for the first time in modern history, atmospheric carbon dioxide – the key driver of global warming – exceeded 400 parts per million across most of the northern hemisphere. Prior to the Industrial Revolution, carbon dioxide concentrations were about 270 parts per million. Concentrations of the greenhouse gas in the atmosphere continue to increase, driven primarily by the burning of fossil fuels.
Despite carbon dioxide’s significance, much remains unknown about the pathways it takes from emission source to the atmosphere or carbon reservoirs such as oceans and forests. Combined with satellite observations such as those from NASA’s recently launched OCO-2, computer models will help scientists better understand the processes that drive carbon dioxide concentrations.
The Nature Run also simulates winds, clouds, water vapor and airborne particles such as dust, black carbon, sea salt and emissions from industry and volcanoes.
The resolution of the model is approximately 64 times greater than that of typical global climate models. Most other models used for long-term, high-resolution climate simulations resolve climate variables such as temperatures, pressures, and winds on a horizontal grid consisting of boxes about 50 kilometers (31 miles) wide.  The Nature Run resolves these features on a horizontal grid consisting of boxes only 7 kilometers (4.3 miles) wide.
The Nature Run simulation was run on the NASA Center for Climate Simulation’s Discover supercomputer cluster at Goddard Space Flight Center. The simulation produced nearly four petabytes (million billion bytes) of data and required 75 days of dedicated computation to complete.
In addition to providing a striking visual description of the movements of an invisible gas like carbon dioxide, as it is blown by the winds, this kind of high-resolution simulation will help scientists better project future climate. Engineers can also use this model to test new satellite instrument concepts to gauge their usefulness. The model allows engineers to build and operate a “virtual” instrument inside a computer.
Using GEOS-5 in tests known as Observing System Simulation Experiments (OSSE) allows scientists to see how new satellite instruments might aid weather and climate forecasts.
“While researchers working on OSSEs have had to rely on regional models to provide such high-resolution Nature Run simulations in the past, this global simulation now provides a new source of experimentation in a comprehensive global context,” Putman said. “This will provide critical value for the design of Earth-orbiting satellite instruments.”

Hazard Analysis, Risk Assessment and CAPA synchronization summary

$
0
0

Hazard Analysis, Risk Assessment and CAPA synchronization summary by SAAD ABDUL WAHAB


Remember!!
Any unsafe act that may take you at risk is a hazard..


A hazard is any source of potential damage, harm or adverse health effects on something or someone under certain conditions at work.

To overcome the naturally existing hazards, you need to have a code of acts, set of safety instructions and to follow those instructions, u must avail the provisions as SAFETY CONTROLS as a precautionery, proactive or preventive action.

Dont forget ever..

An accident completes when you let the following triangle to complete all sides..
1) - Hazard / Potential Threat (to reduce)
2) - Event (to manage)
3) - Target (to learn from..)


To disconnect the vertex of THREAT from the vertex of EVENT, u must apply some PREVENTIVE CONTROLS like work instructions, process control parameters, safe procedures, standard operating procedures or whatsoever you can add as your work based preventive actions.

Now, to detach the unfortunately occured EVENT from the TARGET, you require DEFENCE like PPEs, Active and Passive Measures, Emergency Palns etc.

If you failed to stop the formation of this triangle, it means the accident has occured, otherwise its an incident.
In both cases you have to take some CORRECTIVE ACTIONS in order to minimize the anticipated degree of reccurence of such near misses, close calls, dangerous occurence, or even accidents.

Just remember, Proactive measures are preferred over Reactive measures, likewise you say, Preventive Measures should be so much complete and influential that you never need to apply Corrective Actions. (CAPA Implimentation)

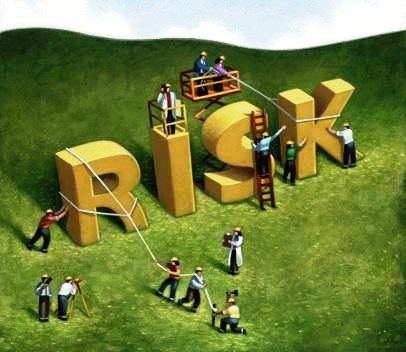
It is pertinent to mention here about the risks,
Risk is the chance or probability that a person will be harmed or experience an adverse health effect if exposed to a hazard. It may also apply to situations with property or equipment loss.

Similarly you can say,

Risk assessment is the process where you:
  1. identify hazards,
  2. analyze or evaluate the risk associated with that hazard, and
  3. determine appropriate ways to eliminate or control the hazard.

Before going to assess the rsik, always calculate the S*L number of work related hazards
S = Severity (Max. Extent of associated hazard)
L = Liklihood (Max. Extent of hazard occupancy)


Remember, the min. & max. limits/range of S & L varies between 1 to 5, i.e, (1<= S & L >=5)

On the basis of S*L number you calculate the extent of CONTROL & DEFECE Parameters you actually need to enforce in order to assess the risk associated with your job, so as to detach the predictible connections b/w the 3 vertices of Accident triangle, i.e, THREAT, EVENT, TARGET.

If You are Experiencing Close Calls, Consider You are at the Second Step...
This pyramid actually shows how an unsafe act, non serious behavior leads to a fatality.

This is actually the Risk Assessment, Preventive Action, and Hazard Analysis scheme.

Remember that, Accidents due to Lack of Awareness is your employers fault, but Accidents dur to Lack of Care is directly your fault, but in both cases the Dangerous occurence/Event directly TARGETs you,
So it depends how much you worth ur life or how much penalty u can afford by loosing ur safety focus.
Like other Management Systems, OHSAS, OH&S also require Continual Improvement by implimenting PDCA Cycle for sustainable approaches.


Who should do Risk Assessment.... operation owner, the supervisor, safety, an expert if required
The simple 5 steps to do the Risk Assessment;
1) Identify the Hazards
2) Decide who might be harmed and how
3) Evaluate the risks and decide on precaution
4) Record your findings and implement them
5) Review your assessment frequently and update if necessary

Members of The Executive Committee / Council for 2014-2015

$
0
0

Members of The Executive Committee / Council for 2014-2015

Sectional Presidents
Agriculture and Forestry Sciences

Dr. S. K. Mahapatra,
Principal Scientist,
National Bureau of Soil Survey and
Land Use Planning (I.C.A.R.),
Regional Centre,
IARI Campus,
New Delhi-110 012.
Animal, Veterinary and Fishery Sciences

Prof. M. K. Jyoti,
1738/F Sector,
Shivaji Chowk,
Nanak Nagar,
Jammu –180 004 (J & K).
Anthropological and Behavioural Sciences (including Archaeology and Psychology & Educational Sciences and Military Sciences)

Prof. Dr. Anup Kumar Kapoor,
Professor,
Department of Anthropology,
University of Delhi,
Delhi-110 007.
Chemical Sciences

Prof. Anand Prakash Mishra,
Professor, Department of Chemistry,
Dr.H.S.Gour University
(Cenetral University),
Sagar-470 003, M.P.
Earth System Sciences

Prof. Kanhaiya Lal Shrivastava,
Professor (Former Head),
Department of Geology,
Faculty of Science, New Campus,
Jai Narain Vyas University,
Jodhpur-342 005, Rajasthan.
Engineering Sciences

Prof. Atul Sitaram Padalkar,
Founder and Principal, Flora Institute
of Technology, Pune;
49/1, Khopi,
Near Khed-Shivapur Toll Plaza,
Off National Highway 4,
Pune-412 205.
Environmental Sciences

Dr. Kashinath Bhattacharya,
Professor & Former Head,
Environmental Biology Lab.,
Department of Botany,
Viswa-Bharati University,
Santiniketan-731 235,
Dist. Birbhum, West Bengal.
Information and Communication Science & Technology (including Computer Sciences)

Prof. Aparajita Ojha,
Director,
Pt. Dwarka Prasad Mishra Indian
Institute of Information Technology,
Design & Manufacturing, Jabalpur and
Professor, Computer Science and
Engineering,
Dumna Airport Road,
Post – Khamaria,
Jabalpur-482 005. M.P.
Materials Science

Dr. Arvind Kumar Saxena,
Outstanding Scientist & Director,
Defence Materials & Stores Research
& Development Establishment,
Defence R & D Organisation,
Govt. of India, Ministry of Defence,
P.O. : D.M.S.R.D.E.,
G.T.Road,
Kanpur-208 013.
Mathematical Sciences (including Statistics)

Prof. Ajay Kumar,
Dean Research (PS & MS),
Professor & Head,
Department of Mathematics,
University of Delhi,
Delhi-110 007.
Medical Sciences (including Physiology)

Dr.(Mrs.) Shashi Bala Singh,
Director,
Defence Institute of Physiology
& Allied Sciences,
Defence Research & Development
Organisation, Ministry of Defence,
Government of India,
Lucknow Road,
Timarpur,
Delhi-110 054.
New Biology (including Biochemistry, Biophysics & Molecular Biology and Biotechnology)

Dr. Sib Sankar Roy,
Principal Scientist,
Cell Biology and Physiology Division,
Indian Institute of Chemical Biology,
4, Raja S.C.Mullick Road,
Jadavpur,
Kolkata-700 032.
Physical Sciences

Dr. V. P. Mahadevan Pillai,
Professor and Head,
Department of Optoelectronics,
University of Kerala,
Kariavattom-695 581,
Thiruvananthapuram, Kerala.
Plant Sciences

Prof. Arun Kumar Pandey,
Professor, Department of Botany,
University of Delhi,
Delhi-110 007.

Members of The Executive Committee / Council for 2014-2015

$
0
0

Members of The Executive Committee / Council for 2014-2015

General PresidentImmediate Past General President
Dr. Sarjerao Bhaurao Nimse,
Vice-Chancellor,
University of Lucknow,
Lucknow-226 007.
Prof. Dr. Ranbir Chander Sobti,
Vice-Chancellor,
Babasaheb Bhimrao Ambedkar
University (A Central University),
Vidya Vihar,
Rai Bareilly Road,
Lucknow-226 025.
General President (Elect)General Secretary (Membership Affairs)
Dr. Ashok Kumar Saxena,
Sir Asutosh Mukherjee Fellow (ISCA) and Former Emeritus Fellow U.G.C., New Delhi;
Department of Zoology, D.A.V.College, Kanpur; Former Dean,
Faculty of Science, C.S.J.M.University, Kanpur; Principal, D.A.V.College, Kanpur;7/182, Swarup Nagar,
Kanpur-208 002, U.P.
Dr. Nilangshu Bhusan Basu,
Principal Chief Engineer (C) & C.M.E.
(P & D),The Kolkata Municipal
Corporation,
7A, Tinkari Ghosh Lane, Kalighat,
Kolkata-700 026
General Secretary (Scientific Activities)Treasurer
Prof. Arun Kumar,
Department of Earth Sciences,
Manipur University,
Canchipur,
Imphal-795 003, Manipur.
Prof. Dhyanendra Kumar,
Professor & Head,
P.G.Department of Zoology,
V.K.S.University,
Arrah-802 301 (Bihar).
Elected Members of the Executive Committee
Dr.(Mrs.) Vijay Laxmi Saxena,
Coordinator-Bioinformatics
Infrastructure Facility Centre of DBT
(Govt. of India);
Head of the Department of Zoology,
Dayanand Girls P.G. College, Kanpur;
7/182, Swarup Nagar,
Kanpur-208 002 (U.P.).
Mr.Gauravendra Swarup,
Secretary, Dr.Virendra Swarup
Academic Society,
Joint Secretary, Dr.Virendra Swarup
Educational Foundation,
15/96, Civil Lines,
Kanpur-208 001.
Prof. S. S. Katiyar,
Chairman, U.P. State Council for Higher Education,
Lucknow; Formerly Vice-Chancellor, Chhatrapati Shahu Ji Maharaj University,Kanpur,
Vice Chancellor, C.A.University of Agriculture and Technology,Kanpur,
Founder Director, Dr.Ram Manohar Lohia National Law University, Lucknow,
President, Association of Indian Universities, New Delhi; 7/111-E, Swaroop Nagar,
Kanpur-208 002 (U.P.).
Prof. Gangadhar,
Syndicate Member, Bangalore
University, Bangalore; Advisor
Trustee, BTL., Educational Trust for
Rural Development,
No. 59, III Main, I Cross,
Income Tax Layout,Vijayanagar,
Bangalore-560 040.
Prof. R. Ramamurthi,
INSA Hony. Scientist,
Formerly Vice Chancellor, Sri
Venkateswara University;
A-9, Vaikuntapuram, M.R.Palli,
Tirupati-517 502, A.P.
Dr. Manju Tembhre,
Principal,
M.K.Ponda College of Business &
Management, Bhopal,
52, M.L.A.Colony,Jawahar Chowk,
Bhopal-462 003, M.P.
Prof. Ranjit Kumar Verma,
Pro Vice-Chancellor,
Patna University,
Patna-800 005.
Dr. Achyuta Samanta,
Founder – KIIT & KISS,
KIIT University,
At. / P.O. KIIT, Patia,
Bhubaneswar-751 024, Odisha.
Prof. D. Narayana Rao,
Director – Research,
SRM University,
Kattankulathur-603 203,
Dt. Kancheepuram, Tamil Nadu.
Prof. Aditya Shastri,
Vice-Chancellor,
Banasthali Vidyapith,
P.O. Banasthali Vidyapith-304 022,
Rajasthan.
Representative of Department of Science & Technology, Government of India
Dr. Praveer Asthana,
Ministry of Science & Technology,
Department of Science & Technology,
Technology Bhavan,
New Mehrauli Road,
New Delhi-110 016.
 
Local Secretaries
Dr. Naresh Chandra,
Pro-Vice-Chancellor,
University of Mumbai,Fort,
Mumbai-400 032.
Prin.Dr. Rajpal S. Hande,
Director,
Board of College and University
Development (BCUD),
University of Mumbai, Fort,
Mumbai-400 032
Past General Presidents
Prof. M. S. Swaminathan
Founder Chairman,
M.S.Swaminathan Research
Foundation,
3rd Cross Street,
Taramani Institutional Area,
Chennai-600 113.
Prof. A. K. Sharma
Centre for Advanced Study in
Cell and Chromosome Research,
University College of Science,
35, Ballygunge Circular Road,
Kolkata-700 019.
Prof. M. G. K. Menon
K – 5 (Rear), Hauz Khas Enclave,
New Delhi-110 016.
Prof. R. P. Bambah
1275, Sector 19B,
Chandigarh-160 019
Prof. C. N. R. Rao
National Research Professor and Honorary President &
Linus Pauling Research Professor,
Jawaharlal Nehru Centre for
Advanced Scientific Research,
Jakkur P.O.,
Bangalore-560 064.
Prof. Yash Pal
11-B Super Deluxe Flats,
Sector 15-A,
Noida-201 301.
Prof. D. K. Sinha
Formerly Sir Rash Behari Ghose Professor of Applied Mathematics,
University of Calcutta,
69/A, Ekdalia Road,
Kolkata-700 019.
Dr. Vasant Gowariker
I-101, Vanaraji Heights,
Rambaug Colony,
Near MIT College,
Paud Road, Kothrud,
Pune-411 038.
Dr. S. Z. Qasim
Centre for Ocean and Environmental Studies (COES),
A-2 (Basement), East of Kailash,
New Delhi-110 065.
Prof. P. N. Srivastava
Professor Emeritus,
Jawaharlal Nehru University, New Delhi,
163, National Media Centre,
National Highway No.8, Nathupur,
Gurgaon-122 002, Haryana.
Dr. S. C. Pakrashi
INSA Honorary Scientist and Former
Director of Indian Institute of Chemical
Biology & CSIR Distinguished Fellow
“Meghamallar”,
Flat No.8F/2,
18/3, Gariahat Road,
Kolkata-700 019.
Prof. U. R. Rao
Chairman, PRL Council, ISRO-DOS,
Department of Space,
Antariksh Bhavan,
New BEL Road,
Bangalore-560 231.
Prof. S. K. Joshi
Room No.250,
National Physical Laboratory,
Dr.K.S.Krishnan Marg,
New Delhi-110 012.
Dr. P. Rama Rao
Chairman, Governing Council,
International Advanced Research
Centre for Powder Metallurgy and New Materials (ARCI),
Balapur P.O.,
Hyderabad-500 005.
Dr.(Mrs.) Manju Sharma
Former Secretary to the Govt. of India,
Dept. of Biotechnology;
B9/6476 (FF), Vasant Kunj,
New Delhi-110 070.
Dr. R. A. Mashelkar
National Research Professor &
President, Global Research Alliance,
CSIR-National Chemical Laboratory,
Dr.Homi Bhabha Road,
Pune-411 008.
Dr. R. S. Paroda
Chairman,
Trust for Advancement of
Agricultural Sciences (TAAS),
Avenue II,
IARI, Pusa Campus,
New Delhi-110 012.
Dr. K. Kasturirangan
Member (Science),
Room No.119,
Planning Commission, Govt. of India,
Yojana Bhavan,
Sansad Marg,
New Delhi-110 001.
Prof. Asis Datta
Professor Eminence,
National Institute of Plant
Genome Research,
Aruna Asaf Ali Marg,
J.N.U.Campus,
New Delhi-110 067.
Prof. N. K. Ganguly
Former Director General, ICMR,
Distinguished Biotechnology Research
Professor, Deptt. of Biotechnology,
C/o National Institute of Immunology,
Aruna Asaf Ali Marg,
New Delhi-110 067
Prof. Harsh Gupta
Member,
National Disaster Management
Authority, Government of India,
NDMA Bhawan,
A-1, Safdarjung Enclave,
New Delhi-110 029.
Dr. T. Ramasami
Secretary to the Government of India,
Department of Science & Technology,
Technology Bhavan,
New Mehrauli Road,
New Delhi-110 016.
Dr. G. Madhavan Nair
Manjary Temple Road,
Sasthamangalam,
Trivandrum-695 010.
Prof. K. C. Pandey
Department of Zoology,
Lucknow University, Lucknow;
B1-240-A, Sector G,
Jankipuram,
Lucknow
Prof. Geetha Bali
Former Vice-Chancellor, Karnataka
State Women’s University, Bijapur;
10, Sterling Southend Apartment,
30th Cross, Jayanagar,
VII Block,
Bangalore-560 082, Karnataka.
Dr. Manmohan Singh,
Hon’ble Prime Minister of India.
Past General Secretaries
Dr.(Miss) Shashi Prabha Arya
90, Saakshara Apartments,
A-3 Block, Paschim Vihar,
New Delhi-110 063.
Prof. H. P. Tiwari
389, Mumfordganj,
Allahabad-211 002.
Prof. S. P. Mukherjee
IAPQR,
AD-276, Salt Lake City,
Kolkata-700 064.
Dr.(Mrs.) Yogini Pathak
C/o Vihang Pathak,
403-404, Kush Flats,
Dhaibar Colony-16,
Opposite Polo Club,
Bagikhana Road,
Vadodara-390 001, Gujarat.
Prof. Uma Kant
Former Head, Department of Botany &
Director, School of Life Sciences,
University of Rajasthan, Jaipu
“Kant Kottage”,
Sector-5, JHA-14,
Jawahar Nagar,
Jaipur-302 004.
Prof. B. Satyanarayana
Formerly Chairman & Vice-President,
Andhra Pradesh State Council of
Science & Technology;
1-8-702/62/17, Behind Shankar Mutt,
Nallakunta,
Hyderabad-500 044.
Prof. B. P. Chatterjee
Emeritus Professor,
West Bengal University of Technology,
Sector – I, BF - 142,
Salt Lake,
Kolkata-700 064.
Prof. S. P. Singh
Professor Emeritus,
Department of Chemistry,
Kurukshetra University,
Kurukshetra-136 119, Haryana.
Prof. Avijit Banerji
Professor (Retired) and Former
Programme Co-ordinator,
CAS Department of Chemistry,
University of Calcutta, Kolkata;
83, Sarat Bose Road,
Kolkata-700 026.
Dr. Manoj Kumar Chakrabarti,
Deputy Director (Senior Grade) & Head, Division of Pathophysiology,
National Institute of Cholera and
Enteric Diseases (ICMR),
P-33, C.I.T. Road, Scheme XM,
Beliaghata,
Kolkata – 700 010.
Past Treasurer
Dr. S. B. Mahato
Ex-Deputy Director and Emeritus
Scientist (CSIR), Indian Institute of
Chemical Biology, Kolkata;
B6/6, Iswar Chandra Niwas,
68/1, Bagmari Road,
Kolkata-700 054.
 
Sectional Presidents
Agriculture and Forestry Sciences

Dr. S. K. Mahapatra,
Principal Scientist,
National Bureau of Soil Survey and
Land Use Planning (I.C.A.R.),
Regional Centre,
IARI Campus,
New Delhi-110 012.
Animal, Veterinary and Fishery Sciences

Prof. M. K. Jyoti,
1738/F Sector,
Shivaji Chowk,
Nanak Nagar,
Jammu –180 004 (J & K).
Anthropological and Behavioural Sciences (including Archaeology and Psychology & Educational Sciences and Military Sciences)

Prof. Dr. Anup Kumar Kapoor,
Professor,
Department of Anthropology,
University of Delhi,
Delhi-110 007.
Chemical Sciences

Prof. Anand Prakash Mishra,
Professor, Department of Chemistry,
Dr.H.S.Gour University
(Cenetral University),
Sagar-470 003, M.P.
Earth System Sciences

Prof. Kanhaiya Lal Shrivastava,
Professor (Former Head),
Department of Geology,
Faculty of Science, New Campus,
Jai Narain Vyas University,
Jodhpur-342 005, Rajasthan.
Engineering Sciences

Prof. Atul Sitaram Padalkar,
Founder and Principal, Flora Institute
of Technology, Pune;
49/1, Khopi,
Near Khed-Shivapur Toll Plaza,
Off National Highway 4,
Pune-412 205.
Environmental Sciences

Dr. Kashinath Bhattacharya,
Professor & Former Head,
Environmental Biology Lab.,
Department of Botany,
Viswa-Bharati University,
Santiniketan-731 235,
Dist. Birbhum, West Bengal.
Information and Communication Science & Technology (including Computer Sciences)

Prof. Aparajita Ojha,
Director,
Pt. Dwarka Prasad Mishra Indian
Institute of Information Technology,
Design & Manufacturing, Jabalpur and
Professor, Computer Science and
Engineering,
Dumna Airport Road,
Post – Khamaria,
Jabalpur-482 005. M.P.
Materials Science

Dr. Arvind Kumar Saxena,
Outstanding Scientist & Director,
Defence Materials & Stores Research
& Development Establishment,
Defence R & D Organisation,
Govt. of India, Ministry of Defence,
P.O. : D.M.S.R.D.E.,
G.T.Road,
Kanpur-208 013.
Mathematical Sciences (including Statistics)

Prof. Ajay Kumar,
Dean Research (PS & MS),
Professor & Head,
Department of Mathematics,
University of Delhi,
Delhi-110 007.
Medical Sciences (including Physiology)

Dr.(Mrs.) Shashi Bala Singh,
Director,
Defence Institute of Physiology
& Allied Sciences,
Defence Research & Development
Organisation, Ministry of Defence,
Government of India,
Lucknow Road,
Timarpur,
Delhi-110 054.
New Biology (including Biochemistry, Biophysics & Molecular Biology and Biotechnology)

Dr. Sib Sankar Roy,
Principal Scientist,
Cell Biology and Physiology Division,
Indian Institute of Chemical Biology,
4, Raja S.C.Mullick Road,
Jadavpur,
Kolkata-700 032.
Physical Sciences

Dr. V. P. Mahadevan Pillai,
Professor and Head,
Department of Optoelectronics,
University of Kerala,
Kariavattom-695 581,
Thiruvananthapuram, Kerala.
Plant Sciences

Prof. Arun Kumar Pandey,
Professor, Department of Botany,
University of Delhi,
Delhi-110 007.
Elected Members of the Council
Mrs. Kumkum Swarup,
Secretary,
Dr.Virendra Swarup Educational
Foundation,
15/96, Civil Lines,
Kanpur-208 002.
Dr. S. Ramakrishna,
Associate Professor,
Department of Zoology,
Jnanabharathi Campus,
Bangalore University,
Bengaluru-560 056, Karnataka.
Prof. K. S. Rangappa,
Vice-Chancellor,
University of Mysore,
Mysore-570 005, Karnataka.
Dr. M. G. Ragunathan,
Assistant Professor, Department of
Advanced Zoology and Biotechnology,
Guru Nanak College,
Chennai-600 042.
Prof. C. Muthamizhchelvan,
Director,
Faculty of Engineering and
Technology,
S.R.M.University,
Kattankulathur-603 203,
Dist. Kancheepuram, Tamil Nadu.
Dr. Abhaya Kumar Naik
Registrar,
National Institute of Science
Education and Research,
Institute of Physics Campus,
P.O. – Sainik School,
Bhubaneswar–751 005.
Dr. Kamal Kumar Saxena
Associate Professor, Department of
Zoology and Co-ordinator,
IGNOU Study Centre,
Bareilly College,
Bareilly-243 005.
Prof. Sunil Prakash Trivedi,
Environmental Toxicology &
Bioremediation Laboratory (E.T.B.L.),
Department of Zoology,
University of Lucknow,
Lucknow-226 007, U.P.
Representative of The Kolkata Municipal Corporation
Sri Anindya Karforma,
Director General,
Building Department,
The Kolkata Municipal Corporation,
Central Municipal Office Buildings,
5, S.N.Banerjee Road,
Kolkata-700 013.
 
Editor-in-Chief of Everyman’s Science
Dr. Ashok Kumar Saxena
Kanpur (Vide Sl.No. 3).
 
Representative of Indian National Science Academy (INSA) Council
Prof. J. P. Khurana,
Vice-President of the Academy and
Coordinator (UGC-SAP),
Deptt. of Plant Molecular Biology,
University of Delhi,
South Campus,
New Delhi-110 021.
 

The theme of the 102nd Congress is ‘Science and Technology for Human Development’

$
0
0


The Indian Science Congress was first held in Mumbai in the year 1926 and then in the years 1934, 1960 and 1969. The University of Mumbai had the honour of hosting the Congress in 1960 and is now privileged to host the 102nd Indian Science Congress from 3rd to 7th January 2015. It is only fitting for the Indian Science Congress to be organised in this city which is the commercial capital of India. Mumbai is also the city of science, home to great scientists and to great institutions of science as well as one of the oldest Indian Universities, the University of Mumbai, established in 1857.
The theme of the 102nd Congress is ‘Science and Technology for Human Development’ – a crucial theme to be reviewed and envisioned from the vantage point of the early twenty first century, a ‘chronotopic’ moment that can look back with both pride and dismay at the progress made, as well as the destruction wrought by Science in the last century.
The twentieth century saw the greatest signposts of modern Science, when humankind first took to the skies and then shot into space, a time when man walked on the moon and dived to great depths in the ocean in the service of Science and Technology. Indeed a small step for a man called Neil Armstrong but a giant leap for mankind.
It was, however, the century which also saw great holocausts and destruction of millions of human lives around the world. Weapons of mass destruction, invincible engines of war, lobotomised and laboratory confined human mice, Auschwitz, Nagasaki, Hiroshima not to forget a more unequal and unjust world in which Science and Technology were deeply implicated.
A walk down memory lane through the streets of India, and its corridors of Power ‘unconceal’ the fact that Science and Technology have brought the advantages of electricity, agricultural and dairy revolutions, modern means of transport, media and IT connectivity to large sections of the society.
To give the world a touch of Science and Technology harnessed to the service of all Humanity, even while slowly bringing India on par with the developed world, is the objective of this Congress.
We are impelled in this endeavour by eminent scientists who have also been great humanists and who have said that science has to work for the greatest good of the greatest number of human beings. Science cannot prosper in ivory towers leaving huge numbers of the human race to fester in poverty and ignorance. The Human Development Index evolved by the economist, Professor Mahbub ul Haq, in the 1970s and then worked into the Human Development Report written for the United Nations Development Programme in the 1990s, along with the writings of the Nobel Laureate Professor Amartya Sen and other economists, have clearly stated that the purpose of development is to improve people’s lives and this is to us an integral text that defines the core areas of critical concern of this Congress.
We are aware that in order to do this, Science has to move out of its multi-million dollar laboratories and work together with the social sciences and humanities, to construct not just a scientifically and technologically superior world, but a world in which human beings live longer, have better education and develop to the fullest extent of their capabilities.
As Bill Clinton, the former President of U.S.A. said, “We cannot idolize technology. Technology is only and always a reflection of our own imagination and its uses must be conditioned by our own values.”
We may safely conclude that Science and Technology have to foster Human Development in India to its fullest extent and enable Indians to have lives that measure up to the requirements of the Human Development Index.
With this as its goal, the 102nd session of the Indian Science Congress aims to further develop India as a Knowledge and Scientific society in which Human Development is the immediate and also ultimate objective. Needless to say, the  Indian Science Congress - 2015 is further animated by the conviction that science and technology must be value based and relevant to society.
Science and technology must thus venture beyond their narrow disciplinary domains and engage in mutually empowering dialogue with other disciplines. The sessions at the Congress have been organised into fourteen sections
The Sections are:
1Agriculture and Forestry Sciences
2Animal, Veterinary and Fishery Sciences
3Anthropological and Behavioural Sciences (including Archaeology, Psychology, Education and Military Sciences)
4Chemical Sciences
5Earth System Sciences
6Engineering Sciences
7Environmental Sciences
8Information and communication Science & Technology(including Computer Sciences)
9Materials Science
10Mathematical Sciences (including statistics)
11Medical Sciences (including Physiology)
12New Biology (including Biochemistry, Biophysics, Molecular Biology and Biotechnology
13Physical Sciences
14Plant Sciences.
Additionally several symposia on relevant themes – Women’s Science Congress, Children’s Science Congress, Science Exhibition, etc. – will also be organised during the five days of deliberations and discussions. We are confident that the plenary sessions, symposia and sessions in different sections around this timely theme of ‘Science and Technology for Human Development’, will provide a roadmap for future scientific, social, economic, academic, administrative and governmental initiatives.
Over 12,000 delegates are expected to participate in the 102nd Indian Science Congress making it one of the largest Congresses organised by the Indian Science Congress Association (ISCA). We hope that this concept note will encourage and inspire our esteemed guests, resource persons and delegates to be part of this rich experience, where science will join hands with humanity in Mumbai - the premier city of India.

World Soil Day 2014

$
0
0
 
World Soil Day 2014

Soils have been neglected for too long. We fail to connect soil with our food, water, climate, biodiversity and life. We must invert this tendency and take up some preserving and restoring actions. The World Soil Day campaign aims to connect people with soils and raise awareness on their critical importance in our lives.


Soil is the basis for food, feed, fuel and fibre production and for services to ecosystems and human well-being. It is the reservoir for at least a quarter of global biodiversity, and therefore requires the same attention as above-ground biodiversity. Soils play a key role in the supply of clean water and resilience to floods and droughts. The largest store of terrestrial carbon is in the soil so that its preservation may contribute to climate change adaptation and mitigation. The maintenance or enhancement of global soil resources is essential if humanity’s need for food, water, and energy security is to be met

2013 Responsible Care® Program Enhancements

$
0
0


Responsible Care Management System (RCMS®):

  • Includes Responsible Care® requirements only – no ISO 14001 requirements.
  • Focuses on hazards and risks.
  • Requires no periodic surveillance – recertification every three years.
  • Focuses on headquarters site, with incremental inclusion of production sites.
  • May be for valuable for organizations with only domestic manufacturing and supply chain activities.

RC14001 Management System:

  • Includes ISO 14001 and Responsible Care requirements.
  • Focuses on aspects and impacts.
  • Is driven by customer requirement for ISO 14001.
  • Stage I and Stage II registration audit approach and periodic surveillance required.
  • Suitable for any facility.
  • May be more valuable for organizations with foreign manufacturing sites, or as supplier to non-domestic customers, due to international acceptance of 14001.

2013 Responsible Care® Program Enhancements


Responsible Care is the chemical industry’s world-class environmental, health, safety and security performance initiative. It’s our commitment to doing more, and doing better.

The American Chemistry Council (ACC) is implementing a set of enhancements to Responsible Care, to strengthen the program and keep pace with 21st century performance expectations. These program enhancements were developed with one overriding principle in mind: to enhance the performance and credibility of the chemical industry through Responsible Care.
By building and growing a stronger Responsible Care, ACC member companies are playing a vital part to ensure that the business of chemical is safe, secure and sustainable.
A summary of the Responsible Care program enhancements follows:
Safe Management and Use of Chemicals:

The products of chemistry are at the heart of making our lives healthier and safer. But as valuable as these products are, they must also be used responsibly. The new Responsible Care Product Safety Code drives continuous improvement in chemical product safety. It includes a set of 11 mandatory practices that require chemical manufacturers to:
  • Evaluate, demonstrate and continuously improve product safety performance.
  • Gather and communicate chemical safety information along the value chain.
  • Make information about chemical products available to the public.

Safe Operations through the Manufacturing Process:

ACC Responsible Care companies are committed to the safe operation of their chemical processes. The Process Safety Code sets forth industry’s commitment to a culture of process safety throughout their operations, management systems and leadership organizations. The Process Safety Code:
  • Strengthens core concepts such as leadership, accountability, and culture to drive overall process safety performance improvement.
  • Encourages companies to identify and prioritize the hazards and risks of their processes.
  • Promotes systems to manage, mitigate and share information about identified risks.

Promoting Energy Efficiency and Materials Reuse and Recycling:
Additional enhancements to Responsible Care induce companies to consider operational energy efficiency and waste minimization, reuse and recycling issues when setting their environmental, health, safety and security performance priorities.
 
Core Elements of the Product Safety Code
The Product Safety Code includes a set of 11 Management Practices, through which chemical manufacturers can evaluate, demonstrate and continuously improve their product safety performance, while also making information about chemical products available to the public.
Specifically, the Product Safety Code Management Practices verify that chemical companies do the following:
  • Undertake scientific analyses of their products, and take steps to assure they can be used safely.
  • Enhance cooperation and communications along the chemical value chain, so that chemical producers and the manufacturers, distributors and retailers who use, handle or sell chemicals, work together to improve awareness about the safety and risks of certain chemicals, and how to manage chemicals safety along the value chain.
  • Consider impacts on public health, the environment and overall sustainability as they improve their products or develop new ones.
  • Determine whether the chemicals they make pose risks, based on any new research, how the chemical is used, and whether children and other sensitive groups come into contact with them.
  • Provide the public with access to product safety and stewardship information.
  • Ensure that company senior executives, including the CEO, commit to a culture of product safety and accountability.

Responsible Care® Process Safety Code

$
0
0
Responsible Care® Process Safety Code


Responsible Care companies are committed to safe operations. The Process Safety Code sets forth this collective commitment to a culture of process safety throughout chemical facility processing operations, management systems and leadership organizations.

This Code aims to supplement existing process safety requirements contained within the Responsible Care Management System® (RCMS®) and RC14001® technical specifications, by specifically addressing process safety concepts such as leadership, accountability and culture in order to drive overall process safety performance improvement.  It is also intended to complement existing regulatory requirements, such as OSHA’s Process Safety Management (PSM) standard and EPA’s Risk Management Plan (RMP) standard.

The Responsible Care Process Safety Code differs from regulatory standards that, by necessity, focus on process safety at an individual facility. The Process Safety Code is more universal—it addresses issues across a division or corporation, and includes a company commitment to set process safety expectations, define accountability for process safety performance and allocate adequate resources to achieve performance expectations.
Responsible Care companies commit to systematic, continuous improvement in process safety through applying the Code’s seven management practices, which address:
    Leadership and culture
    Accountability
    Knowledge, expertise and training
    Understanding and prioritization of process safety risks
    Comprehensive process safety management system
    Information sharing
    Monitoring and improving performance

Implementing the Process Safety Code is mandatory for all ACC Responsible Care companies.

Safety in the Chemistry Laboratory

$
0
0

Safety in the Chemistry Laboratory


Laboratory Safety

Safety measures in the chemistry laboratory. Handling solids and liquids. Chemical spills and clean up. Laboratory fires. Chemical burns and swallowing of chemicals. Personal injury and illness. The OSHA perspective towards lab safety.

SAFETY MANAGEMENT GUIDELINES

  • Safety demands an awareness of your surroundings. Be alert to unsafe conditions or actions in the laboratory. Call attention to them and make corrections.
  • Have an evacuation plan and be familiar with it. Keep passageways clear. Employ exits.
  • Learn to interpret MSDS info in regard to health hazard, flammability, reactivity, storage and disposal. Check for TLV, IDLH, Flash point and Fire fighting media.
  • Know how to use laboratory safety equipment and the exact positions of safety shower, eye wash station, respiratory gear, fume hood, fire alarm, fire extinguisher, and spill clean up materials.
  • Be aware of ignition sources, open flames, heat and electrical equipment.

LABORATORY SAFETY PRECAUTIONS

Laboratory Clothing.
Wear shoes that fully cover the feet. Sandals and clogs are not adequate. Shoes provide a great deal of initial protection in the case of dropped containers, spilled chemicals, and unseen hazards on the floor. Use old clothes, which are not too loose, especially at the sleeves. Laboratory coats or aprons must be worn over clothes. Snaps or fasteners are preferable to buttons for quicker removal in case of an emmergency. Tie back long hair so that it will not fall into flames or chemicals.
Avoid shorts and mini skirts in the lab. Exposed body skin give added risk to irritation and burns by corrosive chemicals and gases.
Aprons
Plastic or Rubber - protects against corrosive and irritating chemicals.
Labcoats
Cotton - good against flying objects, sharp or rough edges (usually treated with a fire retardant)
Wool - protects against molten splashes, small acid spills and small flames.
Synthetic fibres - protects against IR and UV radiation but burns easily and can be ruined by strong solvents.
Safety Glasses.
Wear safety glasses at all times in the laboratory. Goggles are required to be worn at each lab period and should also be worn over prescription glasses. Contact lenses should not be used during the lab. Goggles designed for contact wearers should be made available.
Working Alone in the laboratory
All work must be performed under the supervision of a laboratory instructor/demonstrator. The instructor should be aware of the exact nature of all work being done in the laboratory.
Unauthorized Experiments.
Do only the experiment which has been assigned by the laboratory instructor. Never do any unauthorized experiment in place of the one assigned by the instructor. Do not change the designated procedure without the advice of the instructor.
Read up experiment procedure.
Know exactly what you are to do. Occasionally incomplete directions or a misunderstanding of instruction causes accidents. Whenever you are in doubt, ask your instructor.
Think about what you are doing and why you are doing it at all times.
Do not start any experiment involving the use of an experimental set-up (apparatus) until it has been checked and approved by your laboratory instructor unless otherwise instructed.
Food
Do not eat, drink or smoke in the laboratory.
For safety purposes, assume all chemicals to be poisonous either by themselves or because of impurities. Also avoid direct contact with organic chemicals. Many are absorbed directly through the skin.
Cleanliness
Keep the lab bench clean at all times.
If a solution, a solid, or liquid chemical is spilled on the bench or on the laboratory floor, clean up the spill immediately. Any chemical spilled on your skin or your clothing, should be washed immediately and thoroughly. Notify the laboratory instructor of the spill.
When leaving the laboratory, wipe the bench top thoroughly. Make sure that your work area is clean and free of spilled chemicals or scraps of paper. Wash your hands with detergent or soap and water.
Waste disposal
Dispose of waste and excess materials in the proper manner.
Used matches, paper, broken glass, or porcelain ware should be placed in the appropriate containers but not in the sinks or cup sinks. If you have any questions concerning the waste disposal, ask your instructor for the proper procedure.
Fume Hood
Use fume hood when necessary.
Use the fume hood when you are so directed by the laboratory instructor, or when it is indicated to do so on the experimental procedure. Fume hoods remove toxic vapors and irritating odors from the laboratory. The removal of these materials is essential for protecting the health and safety of those people working in the laboratory.
Burners
Light burners only when needed.Properly extinguish any flame not being used. Any open flame may ignite reagents being used by you or others near you. Many organic liquids are highly flammable and these liquids should be heated only on hot plates or heating mantles.
Reactions
Never look directly into the mouth of an open flask or test tube if it contains a reaction mixture.
Hot Objects
Avoid touching hot objects. When heating a chemical in a container, the clamp holding the container and the burner will also become hot. Place the object on a piece of asbestos board or on wire gauze, which is not directly touching the bench top. Glass objects take a long time to cool, so allow plenty of time to cool before touching them.
Glass rods
Use extreme caution when inserting glass into stoppers. Be very careful when inserting glass tubing, glass rods, thermometers, funnels, or thistle tubes into rubber stoppers or corks. Protect your hands by holding the glass and stopper with a cloth towel or multiple layers of paper towels. Always lubricate the glass surface with water or glycerol.
Glassware
Use only equipment which is in good condition. Defective equipment is an important source of accidents. Some defects to watch for include:
• chipped tips on burets, pipets, and funnels.
• chipped or broken rims on beakers, flasks, funnels, graduated cylinders and test tubes.
• cracks in beakers, flasks, graduated cylinders, test tubes and crucibles.
• star-shaped breaks in the bottom of test tubes or near the bottom edges of beakers and flasks.
• severe scratches in the bottom of beakers, flasks, and test tubes.
• sharp edges on glass tubing and glass rods.
These defects may be repaired by a glass blower or have them replaced.
Also look for
• inflexibility in rubber stoppers - (replace)
• separations in the mercury column of thermometers - (replace)
• non-working parts of screw clamps, buret clamps or rings. - (clean off corrosion, lubricate or replace)
• Replace all old and worn electrical cords.

GLOVES

Gloves should be selected on the basis of the material being handled and the particular hazard involved. Glove manufacturers and the Material Safety Data Sheets (MSDSs) accompanying products in use are good sources of specific glove selection information.

PVC protects against mild corrosives and irritants.
Latex provides light protection against irritants and limited protection against infectious agents.
Natural Rubber protects against mild corrosive material and electric shock.
Neoprene for working with solvents, oils, or mild corrosive material.
Cotton absorbs perspiration, keeps objects clean, provides some limited fire retardant properties.
Zetex® when handling small burning objects. These are a good replacement for asbestos gloves.
(Asbestos containing gloves may not be purchased or used in labs since asbestos is a known carcinogen.)
When working with extremely corrosive material, wear thick gloves. Take extra precaution in checking for holes, punctures, and tears. Care should be taken when removing gloves. Peel the glove off the hand, starting at the wrist and working toward the fingers. Keep the working surface of the glove from contacting skin during removal. Contaminated disposable gloves should be discarded in designated containers (e.g., radioactive or biohazardous waste containers).
Wash hands as soon as possible after removing protective gloves.

HANDLING LIQUID CHEMICALS.

Take an appropriate container to the reagent shelf. Avoid measuring volumes of strong acids and alkaline solutions with your graduated cylinder held at eye level. Support your graduated cylinder on your bench. Add hazardous liquids a little at a time, inspecting after each addition.
Reagent in dropper bottle.
If the general supply bottle is equipped with a dropper, use it, but be sure that the dropper never touches your container or the contents in it. Never put it down on the bench top, but return it immediately the right reagent bottle.
Reagent in a stopper bottle.
If the general supply bottle is equipped with a stopper, the stopper should either be held during the transfer or placed on its flat top. Do not lay the stopper on its side on the bench top. Pour chemicals from the general supply bottle into your container. Be sure that the proper stopper is returned to the supply bottle; do not interchange stoppers.
Mixing.
If liquid chemicals are to be mixed with water, always add the concentrated chemical to water rather than water to chemical. This keeps the new solution dilute at all times and avoids many accidents. Usually addition should be done slowly, using small quantities. It is especially important to add acid to water because of the heat generated.
Pipetting.
Liquids are drawn into the pipet by applying a slight vacuum at the top, using a small rubber suction bulb but NEVER THE MOUTH.Use pipette fillers.
Heating.
Liquids in beakers and flasks can be heated by placing them on a ring or tripod stand on wire gauze with the container preferably supported by a clamp. Liquid should never be heated in a graduated cylinder or in other columetric glassware.
Disposal.
Check with your laboratory instructor before disposing of any chemicals down the drain. If the liquid chemical can be disposed of in the sink, dispose of it by rinsing it down the sink with large quantities of water. Avoid unnecessary splashing during this process by pouring the chemical directly down the drain while the water is running vigorously.

HANDLING SOLID CHEMICALS.

Take an appropriate container to the reagent shelf where the general supply is kept. Solids are somewhat more difficult to transfer than are liquids, so a wide-mouthed container such as a beaker is preferable.
During the transfer, hold the stopper or lay it on the bench without contaminating the stopper. Solid chemicals are most easily poured by tipping the general supply bottle and slowly rotating it back and forth. Mere tipping of the bottle alone often causes large chunks to come out very suddenly which leads to spills. If you use your own spatula, be sure that it is absolutely clean. Return the proper stopper to the general supply bottle; do not interchange stoppers.
Mixing.
If the solid is to be mixed with a liquid, add the solid to the liquid. Additions should be made in small quantities except in special circumstances.
Disposal.
If the laboratory instructor directs you to dispose of any solid chemicals in the sink, flush it down the drain with copious amounts of running water. All other solids should be disposed of in special containers provided for this purpose.

CHEMICAL SPILLS IN THE LABORATORY

In all cases, immediately alert your neighbours and laboratory instructor of the spill.
Locate spill cleanup materials. Laboratories should be equipped with spill cleanup kits.
Wear the appropriate personal protective equipment (e.g., gloves, goggles) when cleaning up spills.
Non volatile and non flammable materials
If the material is not particularly volatile, nor toxic, and poses no fire hazard the liquid can be cleaned up by using an absorbent material which neutralizes them, for example, sodium bicarbonate solution or powder for acids, or sodium thiosulfate solution for bromine. Rubber or plastic gloves should be worn while using absorbent materials. A dustpan and brush should be used to remove the absorbent material. Then, the contaminated area should be cleaned with detergent and water and the area mopped dry.
Volatile, flammable and toxic spill materials
Alert everyone in the laboratory to extinguish flames, disconnect spark-producing equipment, shut down all experiments, and evacuate the laboratory. The laboratory instructor and safety personnel will handle the clean up.
Acid Spills
Apply neutralizer (or sodium bicarbonate) to perimeter of spill. Mix thoroughly until fizzing and evolution of gas ceases. NOTE: It may be necessary to add water to the mixture to complete the reaction. Neutralizer has a tendency to absorb acid before fully neutralizing it. Check mixture with pH indicator paper to assure that the acid has been neutralized.
Transfer the mixture to a plastic bag, tie shut, fill out a waste label, and place in the fume hood. Notify supervisor.
Caustic Spills
Apply neutralizer to perimeter of spill. Mix thoroughly until fizzing and evolution of gas ceases. Check mixture with pH indicator paper to assure that the material has been completely neutralized.
Transfer the mixture to a plastic bag, tie shut, fill out a waste label, and place in the fume hood. Notify supervisor.
Solvent Spills
Apply activated charcoal to the perimeter of the spill. Mix thoroughly until material is dry and no evidence of liquid solvent remains.
Transfer absorbed solvent to a plastic bag (if compatible), tie shut, fill out and attach a waste label, and place in the fume hood. Notify supervisor.
Mercury Spills
Using a mercury vacuum, vacuum all areas where mercury was spilled with particular attention to corners, cracks, depressions and creases in flooring or table tops.
To clean up small spills with a mercury spill kit, dampen the mercury sponge with water, then wipe the contaminated area. Do this procedure slowly to allow for complete absorption of all free mercury. A silvery surface will form on the sponge.
Place the contaminated sponge in its plastic bag, tie shut, fill out and attach a waste label, and place in the fume hood.

CHEMICAL SPILLS ON A PERSON.

Over the body
Within seconds, quickly remove all contaminated clothing while person is under safety shower. Flood the affected body area with cold water for at least fifteen minutes. If pain continues or resumes, flood with more water. Wash off chemicals with a mild detergent solution. Do not apply any materials such as neutralizing agents or salves, to the area. Obtain medial assistance immediately.
On small area of body
Immediately flush area thoroughly with cold water. Wash with a mild detergent solution. If there is no visible burn, wash out the area with warm water and soap.
In the eyes
You will need to assist the person who has chemicals spattered in the eyes. Immediately drench the eyes at the nearest emergency eyewash station. Force the eye or eyes open to get water into them. The speed of your response to this emergency is extremely important. Notify the laboratory instructor of the accident immediately.

SWALLOWING CHEMICALS.

The laboratory instructor should determine what specific substance is ingested.
The individual should be forced to drink copious amounts of water while en route to medical assistance. The Health Center or Hospital should be notified while the individual is in transit as to what chemicals are involved.

BURNS.

For burns by hot objects, flames or chemical, flush the affected area with cold water for several minutes. Notify the laboratory instructor of the burn and he will arrange transportation to the infirmary if necessary.

FIRE.

Give assistance to people first. If the person clothes are on fire, guide him/her without running to the fire blanked station or to the safety shower and drench him. Do not hesitate because of such insignificant things as shrinking sweater, ruined hairstyles, or soggy discomfort. While the victims are being cared for, other available people should try to shut off or reduce the fuel supply to the fire. Get a fire extinguisher and direct its spray toward the base of the fire. If the fire is too big to extinguish, have the laboratory instructor call the fire department and sound the fire alarm.When the fire is out, be sure all extinguishers used are tagged as empty and are replaced.

INJURY OR ILLNESS.

Render assistance if necessary. For minor cuts, wash them thoroughly, apply a good antiseptic, and a band-aid. For major cuts, severe bleeding or serious illness, send someone for help and administer first aid. Only a physician is trained to treat serious injury or illness. Notify the instructor immediately.
Viewing all 8140 articles
Browse latest View live