Regeneration methods
for ion exchange units
Introduction
Most ion exchange resins are used in columns. Ion exchange operation is basically discontinuous: a loading phase, called service run, is followed by regeneration of the exhausted resins. There are two main methods for the regeneration process:- Co-flow regeneration, where the fluids are flowing from the top to the bottom of the column both during the service run as well as during regeneration.
- Reverse flow regeneration, where the fluids are flowing alternatively upwards and downwards during service and regeneration.
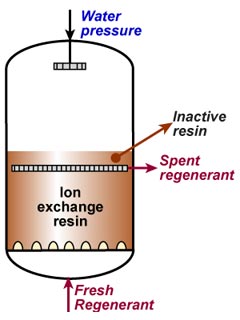
Co-flow regeneration (CFR)
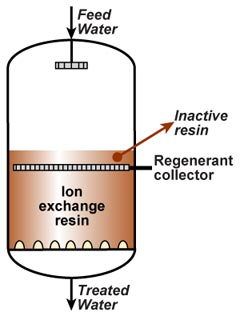
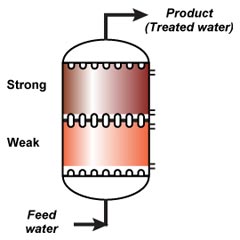
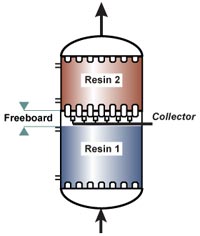
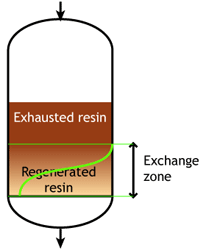
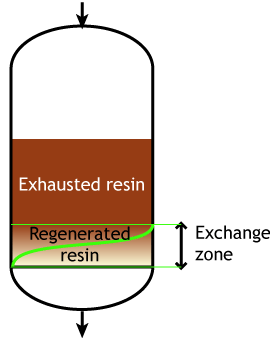
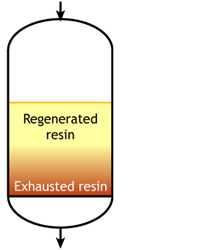
This regeneration technique has been used used at the beginning of ion exchange: the solution to treat flows from the top to the bottom of the column, and the regenerant uses the same path.The problem is that strongly acidic and strongly basic resins are not completely converted to the H or OH form at the end of the regeneration, because this would require too large an excess of chemical regenerant. As a result, the bottom layers of the resin bed are more contaminated than the top layers at the end of regeneration, so that when the next loading run begins the leakage is high due to the displacement of the contaminating ions by the H+ (or OH—) ions produced in the exchange.
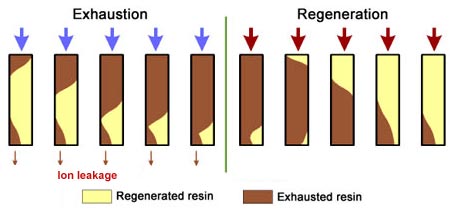
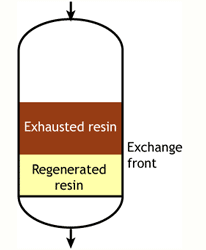
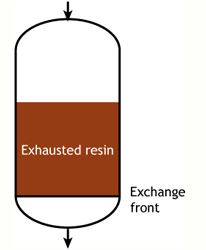
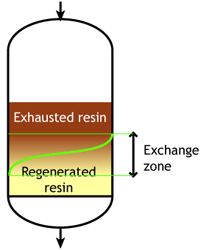
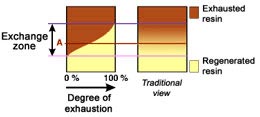 The dark zone in the picture above represents the proportion of exhausted resin, the yellow zone the proportion of regenerated resin. The small picture on the right explains what I mean: for instance, at level A, the resin is 50% exhausted and 50% regenerated. Above the exchange zone, the resin is fully exhausted, and below it is fullly regenerated.
 With co-flow regeneration, the only way to reduce this permanent leakage is to increase the quantity of regenerant so as to leave less contaminating ions at the outlet of the column.
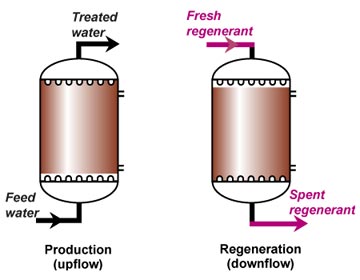
Reverse flow regeneration (RFR)
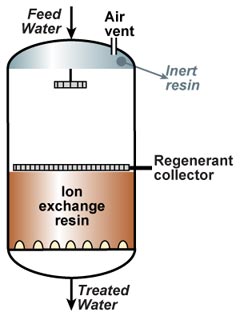
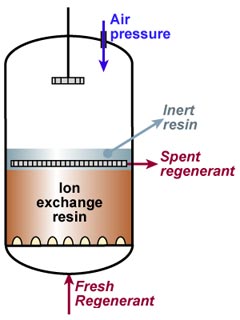
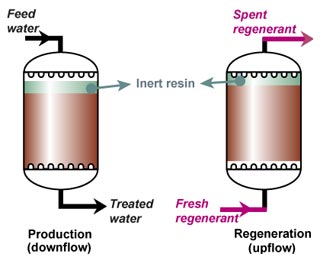
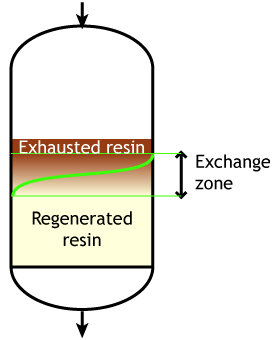
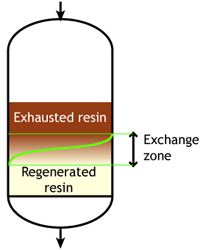
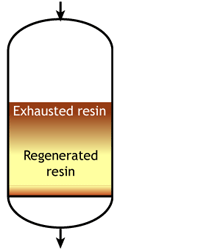
This is also called "counterflow regeneraton". In the past, it was called counter-current regeneration, but the term is not strictly correct as the resin bed does not move. With reverse flow regeneration the regenerant is injected in the opposite direction of the service flow. There are two sub-cases:- Upflow loading and downflow regeneration, as in the floating bed and AmberpackTM processes.
- Downflow loading and upflow regeneration, as in the UFDTM and UpcoreTM processes.


- The treated water has a much higher purity than with co-flow, due to a very low leakage.
- Less regenerant is required, as the contaminating ions don't have to be pushed through the whole bed, and the leakage is almost independent of the regenerant dosage.
Treated water quality

The graph shows the typical leakage profile during the loading phase (e.g. conductivity in µS/cm but it can be any other leakage depending on the process). The ionic leakage obtained with reverse flow regeneration is usually so low, that it does not depend on the amount of regenerant used. With co-flow, low leakage values are obtained only with high regenerant dosage.
No backwash with RFR
The whole effect of reverse flow regeneration relies on undisturbed resin layers. The resin with the highest degree of regeneration should always be at the column outlet. Therefore, the resin bed should not be backwashed before regeneration, and should not be allowed to fluidise at any time. So either the columns are completely filled with resin (packed beds) or the bed is held down during regeneration. See the "column design" page for the concepts of holddown and packed beds.Regeneration steps
The general regeneration procedure for ion echange vessels is as follows:- Backwash resin bed (co-flow regeneration only) to remove suspended solids and decompact the bed.
- Inject regenerant diluted in appropriate water quality. The injection is at a low flow rate, so that the contact time is 20 to 40 minutes.
- Displace the regenerant with dilution water at the same flow rate.
- Rinse the bed at service flow rate with feed water until the desired treated water quality is obtained.
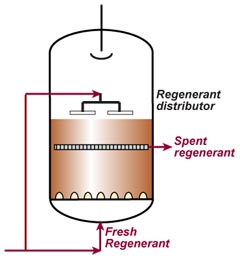
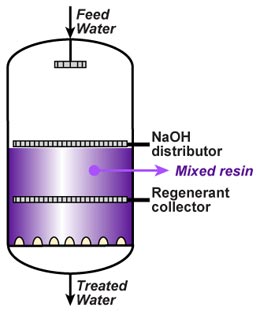
Mixed bed regeneration
 Internal regeneration of a mixed bed unit is more complicated. The steps are:
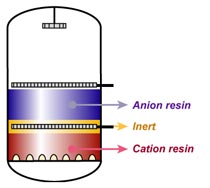
 - Backwash resin bed to separate the cation from the anion resin.
- Let the resins settle.
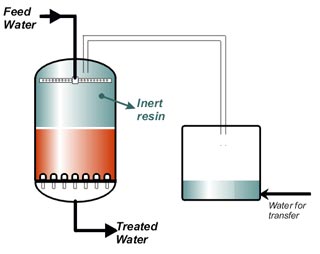
- Optionally: drain the water down to the resin bed surface.
- Inject caustic soda diluted in demineralised water.
- Displace the caustic with dilution water.
- Inject acid diluted in demineralised water.
- Displace the acid with dilution water.
- Drain the water down to the resin bed surface.
- Mix the resins with clean compressed air or nitrogen.
- Refill the unit slowly with water.
- Do the final rinse with feed water at service flow rate until the desired treated water quality is obtained.
Note 2: Cation and anion resin can be regenerated simultaneously to save time. Otherwise, always start with the anion resin.
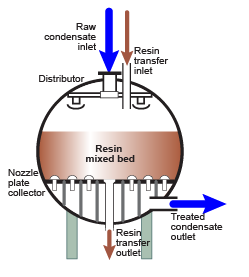
Note 3: In condensate polishing, mixed bed units are usually regenerated externally.
Regeneration efficiency


The three pictures on the left show the conversion of totally exhausted resins (in the Na+ or Cl— form), as a function of regenerant dosage. The y axis "% Regeneration" represents the percentage of conversion of the resins to the H+ and OH— form respectively. We can observe the following things:
- Hydrochloric acid is more efficient than sulphuric acid to regenerate a strongly acidic cation exchange resin (SAC) initially in the Na+ form.
With 50 g HCl per litre of resin, a conversion of 60 % to the H+ form is achieved.
With 50 g H2SO4, a conversion of only 40 % is achieved. - Even expressed as equivalents, hydrochloric acid is more efficient: 36.5 g HCl (1 eq) will convert the resin to 45 %, whereas 49 g H2SO4 (1 eq) convert only 39 %.
- To obtain total conversion, i.e. 100 % in the H+ form, we need about 6.5 eq HCl (240 g/L) but 8 eq H2SO4 (400 g/L).
- This is due to the fact that the second acidity of sulphuric acid is considerably weaker than the first acidity.
- Regeneration of a strongly basic anion exchange resin (SBA) initially in the Cl— form with caustic soda is more difficult:
With 50 g NaOH per litre, only 37 % of the resin are converted; with 40 g (1 eq) only 32 %.
As much as 37.5 eq NaOH (1500 g) are required to convert the SBA resin to about 100 % in OH— form. - The reason why SBA resins of type 1 are more difficult to regenerate than SAC resins is the selectivity coefficient:
K(Cl/OH) = 22 whilst K(Na/H) = 1.7.
Note: all regenerant values are expressed as grams of pure chemical (100 %) per litre of resin.
Regeneration ratio
Definition:
![Definition of regeneration ratio]()
Introduction
- The regeneration ratio — or regenerant ratio — is calculated as the total amount of regenerant (in equivalents) divided by the total ionic load (also in equivalents) during one cycle.
- It is is also equal to the number of eq/L regenerant per eq/L of resin operating capacity.
- A (theoretical) regenerant ratio of 1.00 (i.e. 100 %) would correspond to the stoichiometric quantity.
- All resins need a certain excess of regenerant above the stoichiometric quantity.
- Amberjet 1000
- regenerated with 55 g HCl per litre
- operating capacity : 1.20 eq/L
- 55 g/L HCl = 55/36.5 = 1.507 eq/L
- Regenerant ratio = 1.507/1.20 = 1.26 = 126 %
The difference between ionic load and regenerant quantity is called excess regenerant.
Excess [in eq]= regenerant [eq] - ionic load [eq]
Excess [in %] = 100 x (regenerant ratio – 1)
Minimum valuesExcess [in %] = 100 x (regenerant ratio – 1)
- WAC resins require just above the stoichiometric quantity. A safe number is 105 to 110 %.
- WBA resins require 115 to 140 %, because most of them they have some strongly basic functional groups.
- When regenerated with ammonia or sodium carbonate, WBA resins require a regenerant ratio of 150 to 200 %. These regenerants can be used for WBA only, not for SBA resins.
- SAC and SBA resins require a larger excess than their weak counterparts.
- Co-flow regenerated SAC and SBA resins require more than those regenerated in reverse flow.
- SAC resins regenerated in reverse flow with hydrochloric acid need an absolute minimum of 110 % regeneration, but a safer value is 120 %. If the water contains high hardness or low alkalinity, the minimum value must be increased.
- SAC resins regenerated with sulphuric acid require a larger excess than those regenerated with HCl. At least 40 % more.
- For SBA resins, there is no easy way to estimate a minimum, as it depends on the type of SBA resin (styrenic type 1 vs type 2 or acrylic resins).
- Important note: when calculating the regenerant ratio for SBA resins, one must take 2 equivalents of NaOH for each equivalent of CO2 or SiO2.
- WAC/SAC couples can be regenerated with a global ratio of about 105 %.
- WBA/SBA couples can be regenerated with a global ratio of 110 to 120 %. More is required if the silica level is high in the feed water.
- The regenerant ratio for silica should be at least 800 %. This should be calculated separately as the quantity of NaOH (in eq) divided by the load of silica (in eq) during one cycle. One equivalent of silica is taken as 60 g as SiO2.
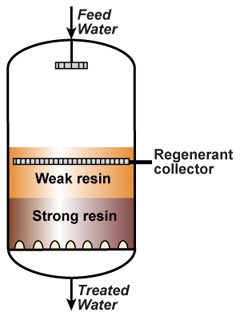
Thoroughfare regeneration
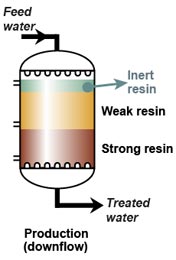
When a weak and a strong resin are used in series, the following two rules must apply:- The feed water must pass first through the weak, then only through the strong resin.
- The regenerant must pass first through the strong, then through the weak resin.
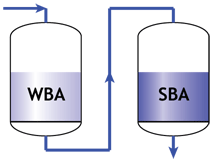 Separate columns in service | 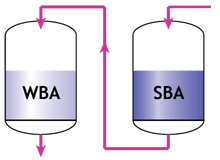 Separate columns in regeneration |
- The weak resin has a high capacity and good regeneration efficiency, but does not remove all ions. Therefore it must be placed first, and the strong resin will be used to remove whatever the weak resin has not removed, albeit with a lower efficiency.
- The strong resin requires a high excess of regenerant. The weak resin requires almost no excess. Therefore the regenerant passes through the strong resin first, and the weak resin is regenerated with the excess regenerant coming out of the strong resin.
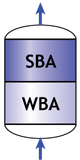 Amberpack in service | 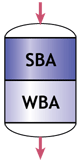 Amberpack in regeneration |
Regenerant types and concentrations
Types of regenerant
- Sodium chloride (NaCl) is normally used to regenerate SAC resins in the softening process, and SBA resins used for nitrate removal.
- For softening, potassium chloride (KCl) can also be used when the presence of sodium in the treated solution is undesirable.
- In some hot condensate softening processes, ammonium chloride (NH4Cl) can be used.
- For nitrate removal, the SBA resin can be regenerated with other compounds providing chloride ions, such as hydrochloric acid (HCl).
- For decationisation — the first step of a demineralisation process — SAC resins must be regenerated with a strong acid. The most common acids are hydrochloric and sulphuric acids.
- Hydrochloric acid (HCl) is very efficient and does not cause precipitations in the resin bed.
- Sulphuric acid (H2SO4) is sometimes cheaper and easier to store and to handle in general, but less efficient than hydrochloric acid: the operating capacity of the SAC resin is lower. Additionally, its concentration must be carefully adjusted to prevent calcium sulphate precipitation (see below). Once a CaSO4 precipitate is formed, it is very difficult to remove from the resin bed.
- Nitric acid (HNO3) can also be used in principle, but is not recommended as it can cause exothermic reactions; explosions have been observed in some cases, so that the use of nitric acid is considered dangerous.
- For dealkalisation, the WAC resin is best regenerated with hydrochloric acid (HCl). When using sulphuric acid, the concentration must be kept under 0.8 % to avoid calcium sulphate precipitation. Other, weaker acids can also regenerate WAC resins, such as acetic acid (CH3COOH) or citric acid, a molecule containing three —COOH groups: (CH2COOH-C(OH)COOH-CH2COOH = C6H8O7). Have a look at the 3-dimensional formula.
- SBA resins are always regenerated with caustic soda (NaOH) in the demineralisation process. Caustic potash (potassium hydroxide KOH) is in principle also applicable, but usually more expensive.
- WBA resins are usually also regenerated with caustic soda, but other regenerants— weaker alkalis — can also be used, such as:
- Ammonia (NH3)
- Sodium carbonate (soda ash, Na2CO3)
- A lime (calcium hydroxide, Ca(OH)2) suspension
SAC and SBA resins can only be regenerated with strong acids or strong bases respectively.
Concentrations
The most usual concentrations are:- NaCl (softening and nitrate removal): 10 %
- HCl (decationisation, de-alkalisation and demineralisation): 5 %
- NaOH (demineralisation): 4 %
- H2SO4: for SAC resins, the acid concentration must be carefully selected between 0.7 and 6 % as a function of the proportion of calcium in the feed water (which is the same in the SAC resin). For WAC resins, the concentration is usually 0.7 %. Too high a concentration may cause calcium sulphate precipitation.
For SAC resins, stepwise concentrations are often used: after a first step at a low concentration, a second step is carried out at a higher concentration once a great part of the calcium on the resin has been eluted. In rare cases, three steps are used. The steps at higher concentrations reduce the quantity of dilution water and increase the sulphuric acid efficiency.
Special applications
Sweetening-off and -on
In several applications other than water treatment, the solution treated by resins must be displaced before regeneration, to recover as much treated solution as possible, avoiding losses in the regeneration waste. This additional step is called "sweetening off" because it was first introduced in sugar treatment processes. Similarly, a "sweetening on" step is carried out after regeneration and rinse before feeding the raw solution to be treated, to avoid dilution of the treated solution. The complete regeneration process consists then of the following steps:- Backwash with the raw solution (optional)
- Sweetening off: displacement of the solution with water
- Regenerant injection
- Displacement of the regenerant with water
- Fast rinse with water
- Sweetening on with the solution to be treated
Merry-go-round
 To increase the concentration of the eluate and the operating capacity of the resin, a system consisting of at least three columns can be used, where two columns are in service, in series, and the third in regeneration, as shown in the picture on the left. The "lead" column is exhausted past its leakage breakthrough, whilst the "lag" column acts as a polisher and guarantees a low leakage in the treated solution.
 When the eluate contains a valuable compound removed on the resin, this compound is eluted at a higher concentration than with a single column.


 A backwash tower. Left: principle, right: photograph of the bottom of the column.
 The first thing to do is thus obtain a reliable water analysi.
 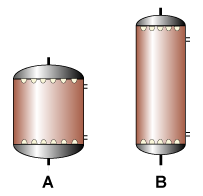 For a given resin volume, it is generally cheaper to make a tall and narrow column rather than a wide and short unit: in the illustration, both columns contain the same resin volume. Column B is cheaper, because the major cost components of the column are the dished ends and nozzle plates.
 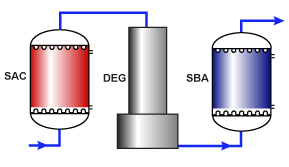 Using the 10 point procedure described above.
  The laboratory setup shown here can be used as an example. More sophisticated arrangements including pumps and regeneration equipment are also used. The basic setup includes:
  Glass columns in the Lanxess laboratory
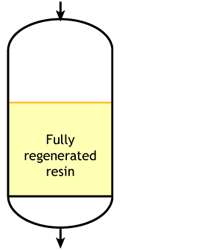

 CO3= + H2O
  A low pH value means that there are H+ ions in solution. In the presence of bicarbonate, the following equilibrium exists:
  H2CO3
H2CO3