Quantcast
Channel: EHSQL Greenko -AMGreen Group (Env-Energy,Health,Safety,Security ,Social Ac.Quality-Lab) Tech.Serv.
Viewing all 9469 articles
Browse latest View live

What is gas chromatography (GC)?

$
0
0

What is gas chromatography (GC)?


Gas Chromatography
Gas chromatography (GC) is based on the repeated partition or adsorption, between a mobile phase and a stationary phase, of components to be separated. The mobile phase is always a gas known as the carrier gas. The stationary phase can be either a solid or a liquid.
When the stationary phase is a solid then it is called gas-solid chromatography (GSC) or adsorption chromatography. The components of the injected sample are adsorbed on the solid and the principle of separation is based on the fact that the various components can be more or less strongly adsorbed by the adsorbent.
The solid stationary phases used in gas chromatography are materials such as silica gel, active carbon, aluminum oxide, molecular sieves.
When the stationary phase is a liquid then it is called gas-liquid chromatography(GLC) or partition chromatography. The components of the injected sample form different concentrations in the liquid stationary phase and in the gaseous mobile phase.
Like all chromatographic techniques, gas chromatography separates mixtures by taking advantage of their components differential distribution between two phases – one stationary and the other moving. The distinctive feature of gas chromatography is the use of a gas as the moving, or mobile, phase. It is usually called carrier gas. A sample of the mixture to be separated is introduced into this gas stream just before it encounters the stationary phase. The components of the injected sample – the sample may be a liquid or a gas-  are separated by elution and detected as they emerge in the gas at the other end of the column (Fig. 1). They are distinguished by the different times which they take to pass through the colum – the retention times.
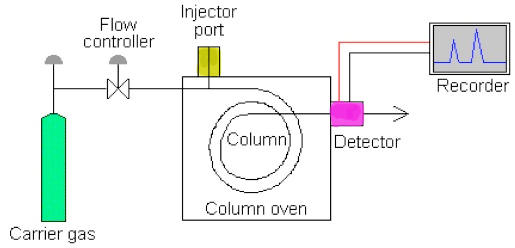
Fig. 1: Block diagram of a gas chromatography system 


The hardware components used in typical GC systems include aninjector, a carrier gas, a column (stationary phase), an oven, a detector and a recorder or information processor (Figure 1). Several components have variable settings that can be used to optimize the analysis of different sample types.

A GC-MS analytical instrument is shown in the following video. A mass spectrometer is the detector in this case:


Which are the most common mobile phases in gas chromatography?
The most common mobile phases(carrier gases) for gas chromatography (GC) are He, H2 and N2 which have the advantage of being chemically inert toward both the sample and the stationary phase. However, other gases such as Ar and CO2 have also been used though much less frequently.
The choice of which carrier gas to use is often determined by the instrument’s detector.
The gases can be obtained from commercial air suppliers, conveniently compressed in cylinders and in a state of purity sufficient for most purposes.
What happens if the mobile phase gases are impure?
If the gases are impure then a very unstable and noisy baseline is observed in the chromatogram.
The commonest impurity is water, and drying the gas with an in-line molecular sieve trap is recommended.
Another impurity is oxygen which may cause oxidation of the stationary phase particularly in high temperatures. The stationary phases are usually organic, and the products of oxidation are usually volatile and cause a noisy, drifting baseline when they reach the detector. The column life will also be shortened and will not give good results.
The Injection System in Gas Chromatography – Sample Introduction
Sample introduction is of primary importance in gas chromatography. The performance of the sample introduction system is crucial for the overall chromatographic performance.
What volume of sample is injected to the gas chromatograph and how?
The sample volume injected is usually less than 1-2 μl of liquid or 5 cm3 of gas. Injection, is usually achieved by means of a syringe inserted through a self-sealing silicone rubber septum at the injection head.

What is the injection port of a gas chromatograph
Fig. 2: Injection head of a gas chromatograph. Injection is achieved by means of a syringe inserted through a self-sealing silicone rubber septum at the green-colored injection port.
However, there are a number of problems inherent in the use of syringes for injection, even when they are not damaged:
  • Even the best syringes claim an accuracy of only 3%, and in unskilled hands, errors are much larger
  • The needle may cut small pieces of rubber from the septum as it injects sample through it. These can block the needle and prevent the syringe filling the next time it is used. It may not be obvious of what happened.
  • A fraction of the sample may get trapped in the rubber, to be released during subsequent injections. This can give rise to ghost peaks in the chromatogram.
  • There may be selective loss of the more volatile components of the sample by evaporation from the tip of the needle.

There are also several problems with the splitting process since the split may not be homogeneous. This may be because there is a poor mixing with the carrier gas at the dilution stage or because the low relative molecular mass components diffuse toward the vent more rapidly than those of higher molecular mass.
In principle, there are four types of sample injection:
  • Splitless injection
  • Split injection
  • Temperature-programmed injection
  • On-column sample injection
When splitless injection is used?  
This method is useful for very dilute solutions. When splitless injection is used, the column is overloaded with the solvent. For this reason, the temperature at the top of the column is kept low (10-20 ◦C below the boiling point of the solvent), so that the low-volatility components and the solvent condense. This condensation causes the components to be focused. The method is not recommended for volatile components, as these are eluted from the column with the solvent.
When split injection is used?
Split sampling was the first sample introduction system developed for capillary gas chromatography. In the split injection technique,only a part of the sample is delivered to the column. This method is used with capillary columns. The sample is injected into the carrier gas stream through a septum, vaporized in the vaporizing chamber, and then mixed with the carrier gas. The gas then is divided into two streams by means of an infinitely adjustable needle valve, which should be adjusted so that a very small proportion of the sample is delivered to the column. This method is used when concentrations in the sample are high because the capacity of a capillary column is low.


References
  1. D. Harvey,  “Modern Analytical Chemistry”, McGraw-Hill Companies Inc., 2000
  2. “Gas Chromatography”, J. Willett, John Wiley &Sons, 1987
  3. “High Resolution Gas Chromatography”, K.J. Hyver, P. Sandra, 3rdEdition, 1989

Troubleshooting and maintenance of GC Systems

$
0
0

Troubleshooting and maintenance of GC Systems

Troubleshooting a GC chromatograph can be made easier, if one learns to recognize the symptoms produced by an instrument malfunction, column and detector problems, leaks. Many symptoms appear as unusual peaks as shown below:
Symptom: No peaks (Fig. 1) 

Fig. 1: No peaks appear after the injection of the sample
Possible Cause: Main power off, fuse burned out
Action: Plug in the instrument, replace fuse
Possible Cause: Detector off
Action: Turn detector on and adjust its sensitivity
Possible Cause: No carrier gas flow
Action: Check the carrier gas lines and correct the problem i.e. replace empty gas cylinders, possible obstructed or broken gas lines
Possible Cause: Injector temperature too low. The sample is not vaporized
Action: Increase injector temperature.
Possible Cause: Injector septum is leaking
Action: Replace the septum.
Possible Cause: The syringe used for the injection of sample is plugged up.
Action: Clean the syringe or replace it if it is damaged.
Possible Cause: The FID flame is out.
Action: Check the FID flame. Check if water vapor condenses on mirror. Light up the flame if needed.
Possible Cause: Column connections are loose.
Action: Check for leaks. Use a leak detector. If needed tighten column connections
Possible Cause: Oven temperature too cold. Possibly, the sample condenses in the column
Action: Increase oven temperature
 

Symptom: Retention times or areas are not reproducible (Fig. 2)


Possible Cause: Septum is leaking
Action: Replace the septum if it is damaged. If there is a premature septum failure (less than 200 injections) check also if:
The syringe needle is not straight
The syringe is not installed correctly
The septum retainer nut is too tight
Possible Cause: Syringe is dirty or damaged
Action: Replace the syringe if it is damaged. Clean the syringe with an appropriate solvent if it is dirty.
Possible Cause: Sample is not stable under the conditions of the analysis
Action: Check the sample stabiblity. Some samples change with heat or U.V. light. In case the sample is photosensitive use amber sample vials.
Possible Cause: Sample volume is too low or too high
Action: Check the sample vials. If the sample vials are not filled correctly, evaporation or contamination may affect the analysis. The sample level should be approximately half the volume of the vial.


Fig. 2: Retention times or areas are not reproducible

Fig. 2: Retention times or areas are not reproducible


Symptom: Poor sensitivity with normal retention time
 
Fig. 3: Poor sensitivity with normal retention times

Fig. 3: Poor sensitivity with normal retention times
 
 Possible Cause: Insufficient sample size

Action: Increase sample size. Check syringe needle for plugging.
Possible Cause: Poor sample injection technique
Action: Check if the proper injection technique is used.
Possible Cause: High attenuation
Action: Reduce attenuation.
Possible Cause: FID response low
Action: Optimize the flow rates of H2and air. Use N2 for make-up gas
Possible Cause: Thermal conductivity response low
Action: Use higher filament current.
Possible Cause: Syringe or septum leaking when injecting
Action: Replace syringe and/or septum

Symptom: Poor sensitivity with increased retention time and broadening of the peak
Possible Cause: Carrier gas flow rate too low.
Action: Increase carrier gas flow.
Possible Cause: Septum is leaking.
Action: Replace septum.

Symptom: Irregular baseline drift (isothermal)

  
Fig.4: Irregular baseline drift when operating isothermally

Fig.4: Irregular baseline drift when operating isothermally

Possible Cause: The instrument location is not according to the manufacturer’s specifications .
Action: Instrument should not be placed directly under heater or air conditioner or any other place where it is subject to excessive drafts and ambient temperature changes.
Possible Cause: Column packing bleeding.
Action: Let column to stabilize as described by the manufacturer.
Possible Cause: Carrier gas leaking.
Action: Locate leaks and correct.
Possible Cause: Carrier gas regulators do not work properly.
Action: Check carrier gas regulators and flow controllers.
Possible Cause: Poor air or H2 regulation (FID detectors)
Action: Check regulators and flow controllers.
Possible Cause: Detector is contaminated
Action: Clean detector according to manufacturer’s specifications. Raise temperature and bake out detector overnight.
Possible Cause: Detector filaments are defective (TCD detector only)
Action: Change the filaments.

Symptom: Contamination or ghost peaks
Possible Cause: Vial cap septum is dissolving in solvent
Action: Check the vial septum. If it is not resistant enough to the solvent you are using try a more resistant type.
Possible Cause: Injection port septum is giving off volatiles
Action: Make several blank runs with a small piece of aluminum foil backing the inlet septum. If the contamination peaks disappear, they were probably due to the septum. Use another type of septum that is stable to the required injector temperatures.
Possible Cause: Column is contaminated
Action: Examine the first 10 cm of the capillary column for contamination holding a light behind it. If possible cut the contaminated part of the column. Replace or clean the inlet liner.
Possible Cause: The sample is not stable
Action: Store the sample in a protected environment and use amber sample vials.

Symptom: Sinusoidal baseline drift
 

Fig.5: Sinusoidal baseline drift

Fig.5: Sinusoidal baseline drift

Possible Cause: Oven temperature defective
Action: Replace the oven temperature sensing probe .
Possible Cause: Oven temperature control was set to a low value
Set the oven temperature control to a higher value.
Possible Cause: Carrier gas flow regulator defective
Replace the carrier gas flow regulator. Set to a higher pressure in order to stabilize the gas flow.
Possible Cause: Carrier gas cylinder pressure too low to allow regulator to work properly                                                                                                                   
Replace the carrier gas cylinders.

Understanding Columns in Gas Chromatography

$
0
0

Understanding Columns in Gas Chromatography


A chromatographic column provides a location for physically retaining the stationary phase. The column’s construction also influences the amount of samplethat can be analyzed, the efficiency of the separation, the number of analytes that can be easily separated, and the amount of time required for the separation.
There are two types of column used in gas chromatography – packed and capillary.
Packed columns are the routine work horses of gas chromatography, being cheaper and easier to use and often giving adequate performance.
Capillary columns generally give far superior resolution and although more expensive are becoming widely used, especially for complex mixtures.
Both types of column are made from non-adsorbent and chemically inert materials. Stainless steel and glass are the usual materials for packed columns and quartz or fused silica for capillary columns.
Packed Columns
A packed column is constructed from glass, stainless steel, copper or aluminum and is typically 2-6 m in length, with an internal diameter of 2-4 mm. The column is filled with a particulate solid support, with particle diameters ranging from 38-44 μm to 250-354 μm.
The most widely used particulate support is diatomaceous earth. These particles are porous, with surface areas of 0.5 -7.3 m2/g, which provides ample contact between the mobile phase and stationary phase.
 
gc chromatography: a packed column
Fig. 1: A packed column in a G.C. oven
 
Packed columns can handle larger amounts of sample than capillary columns. Samples of 0.1 -10 μl are routinely analyzed with a packed column.
Capillary Columns
These consist of silicon dioxide, alkali glass or borate glass. Their id varies between 30 and 500 μm. Column lengths are usually between 1 and 100 m. There are three types of capillary column:
 
gas chromatography: a capillary column
Fig. 2: A gc capillary column
Packed capillary columns in which the packing is an adsorbent (e.g. silica gel). These are used for adsorption chromatography only, not partition chromatography, and are suitable for strongly polar components.
Thin film capillary columns, in which the liquid phase is applied to the inner walls of the column in the form of a thin film.
Thin coating capillary columns, which consist of a thin, finely divided coating of carrier material which is then itself coated with the liquid phase.
Capillary columns provide a significant improvement in separation efficiency compared to packed columns. The pressure needed to move the mobile phase through a packed column limits its length. The absence of packing material allows a capillary column to be longer than a packed column allowing for more efficient separations.
However, due to their smaller diameter capillary columns require smaller samples – less than 10-2μl.

Solutions and Concentration - Solution Composition

$
0
0

Solutions and Concentration - Solution Composition


Chemical reactions often take place in aqueous solutions. To perform stoichiometric calculations in such cases the amounts of chemicals present in solution – the concentration of solution - must be known.
Concentrationof a solution is a measurement stating the amount of a solute present in a known amount of solution:

Concentration = amount of solute / amount of solution

The terms solute and solution are usually used for liquid samples but they can be extended to gaseous and solid samples.

The most common units of concentration are given in Table I.1:

Common Units of Concentration
Name
Symbol
Units
molarity
moles solute / liters of solution
M
molality
moles solute / kg solvent
m
normality
number of equivalent weights of solute / liters of solution
N
formality
number of formal weights of solute / liters of solution
F
weight %
g solute / 100 g of solution
% w/w
volume %
ml solute / 100 ml solution
% v/v
weight-to-volume %
g solute / 100 ml solution
% w/v
parts per million
g solute / 106 g solution
ppm
parts per billion
g solute / 109 g solution
ppb

Note: Another way of describing solution concentration is the mole fraction (xi)


Molarity (M)is defined as the number of moles of solute per liter of solution.
i.e by dissolving 0.1 mol NaOH in 1 l of H2O gives a solution that contains 0.1 mol Na+ and 0.1 mol of OH- in 1 l. The concentration of the solution is [Na+] = 0.1 M and [OH-] = 0.1 M.  
Since molarity depends on the volume of the solution it changes slightly with temperature.

Another way of describing solution concentration is molality (m) which is the number of moles of solute per kilogram of solvent.
Molality is independent of temperature since it depends on mass.

In very dilute aqueous solutions the molarity (M) and molality (m) are nearly the same.

Example #1


A solution of 1M H2SO4 has density 1.04 g/cm3. Calculate the (%w/w) concentration of the solution.

Given
[H2SO4] = 1M
d = 1.04 g/cm3
PH2O = 41 mmHg
MW H2SO4 = 98 g/mole
Asked for
 (%w/w) = ?

 From the definition of  (%w/w) = g solute / 100 g of solution    (1)
The mass of solute (g solute) is unknown but it can be calculated.

Since [H2SO4] = 1M 1000 cm3 of H2SO4 solution contain 1 mole “pure” H2SO4    (2)
The mass of 1 mole “pure” H2SO4 can be calculated as shown below:

mass (g) = mole* MW = 1 mole * 98 g/mole = 98 g    (3)
 
From (2) and d = m/V = 1.04 g/cm3   the mass of 1000 cm3 of H2SO4can be calculated:
m = d* V = 1.04g/cm3 * 1000cm3 = 1040 g of H2SO4 solution  (4)
From (2), (3) and (4):
Mass of 1040 g of H2SO4 solution contain 98 g of“pure”H2SO4
              Mass of 100  gof H2SO4 solution contain   x = ? g of“pure”H2SO4
x = 98 g“pure”H2SO4 * (100gof H2SO4 / 1040gof H2SO4) = 9.42 g of“pure”H2SO4
Therefore,(%w/w) = 9.42

Provided that the theory and the definitions of solution concentration units is understood a % solution calculator can be used.
Meant to be used in both the teaching and research laboratory, a % solution calculator  can be utilized to perform a number of different calculations for preparing percent (%) solutions when starting with the solid or liquid material.

Performance Verification of Analytical Balances according to ISO/IEC 17025

$
0
0

Performance Verification of Analytical Balances according to ISO/IEC 17025


Accurate analytical measurements are fundamental to the functioning of modern society. Inaccurate results can have an enormous social and economic impact1 (Prichard et al. “Quality Assurance in Analytical Measurement”, 2007) such as:
  • “In trade, it could lead to the supply of sub-standard goods and the high cost of replacement with subsequent loss of customers”
  • “In environmental monitoring, mistakes could lead to hazards being undetected or to the identification of unreal hazards”
  • “In supply of drinking water, it could lead to harmful contaminants being undetected”
  • “In healthcare, the incorrect medication or the incorrect content of an active ingredient in a tablet can be catastrophic for the patient”.
Calibration and verification are the most important actions to ensure the correct indication of measuring instruments2 (K. Sommer et al. “Calibration and Verification: Two Procedures
Having Comparable Objectives and Results”; OIML BULLETIN; vol. XLII, number 1, 2001)
They are considered major requirements for the competence of testing and calibration laboratories according to the International Standard  ISO/IEC 17025:
“Equipment used for testing, calibration and sampling shall comply with specifictions…” (5.5.1)  and
“Before being placed into service, equipment (including that used for sampling) shall be calibrated or checked to establish that it meets the laboratory’s specification requirements and complies with relevant standard specifications. It shall be checked and/or calibrated before use”. (5.5.2)
ISO/IEC Guide 2 defines verification as: “Confirmation by examination and provision of evi-dence that specified requirements have been met”.
Verification is the confirmation, based on evidence (test results) that a certain number of specified requirements have been fulfilled. For example, the verification of an analytical balance  will prove that the performance of the balance is still in agreement with the calibration certificate.
The acceptance / rejection criteria used for the verification of analytical balances are:
·         Trueness (% relative error), comparing to the weights of certified standard weights. The average weight xaverageof ten consecutive measurements of a certified standard weight is measured using the analytical balance. The absolute error is calculated and then the % relative error according to:
Absolute error  = xaverage– xt
% relative error  = [ (xaverage– xt )/ xt]  x 100
Where xt  the true value of  the certified weight and xaverage  the average weight of the certified weight determined experimentally ( ten consecutive measurements of the certified weight using the analytical balance of interest).
Absolute and % relative error are a measure of the accuracy (trueness) of the analytical balance.
The definition of trueness according to VIM 2010 (International Vocabulary of Terms in Legal Metrology)  is:  closeness of agreement between the average of an infinite number of replicate measured quantity values and a reference quantity value.
·   Repeatability  (% coefficient of variance, %RSD), comparing to the weighs of certified standard weights.
The standard deviation from the mean value of ten consecutive measurements of a certified weight is determined. Then the % relative standard deviation (%RSD) is calculated.
Standard deviation = s = [Σ(xi-xaverage)2 / (n – 1)]1/2
Where xaverage the average value of the ten consecutive measurements and x each individual measurement and n the number of measurements
% relative standard deviation (%RSD) =  s / xaverage * 100
Repeatability  (%RSD) is a measure of the precision of the analytical balance.
The definition of precision according to VIM 2010 (International Vocabulary of Terms in Legal Metrology)  is: closeness of agreement between indications or measured quantity values obtained by replicate measurements on the same or similar objects under specified conditions.
·         Drift
The acceptance / rejection criteria (tolerance) for analytical balances are given in the table below:
Acceptance / Rejection Criteria for Analytical Balances
Trueness, % Relative Error
0.01
Repeatability, % RSD
0.0001
Drift, g
0.001
The above procedure was followed for the performance verification of a KERN 770-13 precision balance. The results are given in the table below:
Table 1: Balance Verification Table – Trueness and Repeatability Assays
Balance I.D.
Standard Weight I.D.
Brand
KERN
Nominal Value
99,9996
Model
770-13
Measurement #
Value (g)
Drift (g)
1
99.9998
t = 0     1.0000
2
99.9997
             t = 5     1.0001
3
99.9996
             t = 10   1.0001
4
99.9997
5
99.9998
6
99.9998
7
99.9997
8
99.9997
9
99.9997
10
99.9997
Average (g)
99.9997
Absolute Error (g)
0.0001
Relative Error (%)
0.0001
Accepted /not Accepted  Trueness
Accepted
Std. Deviation (g)
0.000063
%RSD
0.000063
Accepted /not Accepted  Repeatability
Accepted
Drift (g)
0.0001
Accepted /not Accepted 
Drift
Accepted
10 σχόλια

Subject: Consideration of project proposal from Andhra Pradesh in absence of SEIAA/SEAC - reg.

10 photos of a changing world

$
0
0

01 / Satellite images from the Arctic ice pack in September 2005 and again in September 2007

01
Credits: Nasa

The Arctic ice pack is most extensive in the month of September. Yet NASA, which has been mapping it annually since 1979, has measured a 13% drop in its surface area per year.

02 / The Maldives under threat from rising water levels

02
Credits: Géo

The rising water levels are threatening more and more islands and coastal cities.

Scientists have calculated that sea levels rose by 18cm between 1870 and 2000, and

at a faster rate in recent years (+6cm in 20 years).

03 / Iceberg drifting off the village of Kulusuk in Greenland

03
Credits: Bob Strong / Reuters

Global warming has hit Greenland hard, with the ice melting increasingly quickly.

In barely ten years, temperature variations of several dozen degrees in the same period have been recorded.

04 / Pollution from factories contributes to global warming

04
Credits: ThinkStock

In 2012, the primary production of renewable energies rose to 22.4 million tonnes of oil equivalent (Mtoe).

The main sectors are wood fuel (44.8%), hydropower (22.4%), biofuels (10.7%) and heat pumps (6.2%).

05 / Drought, one of the consequences of climate change

05
Credits: Getty Image

Climate change increases the risk of more violent and more frequent extreme

climate events such as droughts, torrential rain and storms.

06 / I don’t believe in global warming

06
Credits: Banksy

A meta-study published in 2013 in “Environmental Research Letters” compiled

almost 12,000 research abstracts published by over 29,000 researchers between 1991 and 2011.

Among them, 3,896 articles stated a position on the causes of global warming over the past 50 years:

97.1% of them endorsed the consensus that it is human-caused.

07 / The Robeson Islands in the San Blas archipelago (Panama) are under threat from rising water levels

07
Credits: Yann-Arthus Bertrand

Experts from the IPCC have predicted that average sea and ocean levels could rise

from 26cm to 82cm by 2100. This would pose a threat to all islands, deltas and coastal areas.

08 / Melting ice is destroying many species’ habitats

08
Credits : Reuters

Destroying habitats and ecosystems leads to many species becoming extinct. Currently,

20-30% of animal and plant species are under threat of extinction.

09 / Flooding in Pakistan

09
Credits: Getty Image

The recent deadly floods which hit Pakistan are largely due to

the melting Himalayan glaciers, which in turn is caused by global warming.

10 / Large-scale deforestation

10
Credits: Global Population Speak out

Four centuries ago, 66% of the earth was covered in forests – today, this figure has been halved.

And this deforestation is intensifying, with 23 million hectares of forest destroyed between 2000 and 2012.

Weather Report and Forecast For: Kakinada Dated :Nov 22, 2015

$
0
0
Local Weather Report and Forecast For: Kakinada    Dated :Nov 22, 2015
Kakinada
Past 24 Hours Weather Data
Maximum Temp(oC)30.7
Departure from Normal(oC)1
Minimum Temp (oC)22.4
Departure from Normal(oC)1
24 Hours Rainfall (mm)NIL
Todays Sunset (IST)17:25
Tommorows Sunrise (IST)06:09
Moonset (IST)02:12
Moonrise (IST)14:35
Today's Forecast:Sky condition would be partly cloudy. Rain/thundershowers may occur. Maximum & Minimum temperatures would be around 31 and 22 deg.cel respectively.
Date Temperature ( o C ) Weather Forecast
Minimum Maximum
23-Nov 22.0 31.0 Mainly or Generally cloudy sky with possibility of rain or Thunderstorm
24-Nov 22.0 31.0 Mainly or Generally cloudy sky with possibility of rain or Thunderstorm
25-Nov 22.0 31.0 Partly cloudy sky with Thundery development
26-Nov 21.0 31.0 Partly cloudy sky with Thundery development
27-Nov 21.0 31.0 Partly cloudy sky with Thundery development
28-Nov 21.0 31.0 Partly cloudy sky with Thundery development


INDIA METEOROLOGICAL DEPARTMENT 
NWP MODELS BASED DISTRICT LEVEL WEATHER PREDICTION
ISSUED ON: 20-11-2015
VALID TILL 08:30 IST OF THE NEXT 5 DAYS

DISTRICT : EAST-GODAVARI STATE : ANDRA-PRADESH
------------------- ------------------- ------------------- ------------------- ------------------- -------------------
PARAMETERS ENSEMBLE FCST
----------------------------------------------------------------------------------------------------
DAY-1 DAY-2 DAY-3 DAY-4 DAY-5
21/11 22/11 23/11 24/11 25/11
------------------- ------------------- ------------------- ------------------- ------------------- -------------------
Rainfall (mm) 3 0 0 0 0
Max Temperature ( deg C) 28 28 28 28 28
Min Temperature ( deg C) 17 17 16 15 14
Total cloud cover (octa) 2 3 6 5 0
Max Relative Humidity (%) 78 83 82 84 86
Min Relative Humidity (%) 54 47 47 45 42
Wind speed (kmph) 009 008 007 005 004
Wind direction (deg) 112 106 103 98 101
------------------ ------------------- ------------------- ------------------- ------------------- -------------------

NOTE: -99.0 ........ NO DATA

TimeTemp.Feels LikeDew PointHumidityConditionsPrecip.Liquid Precip.WindCloud CoverPressure
7:00 am26 °C29 °C23 °C84%Partly CloudyPartly Cloudy0% 0 mm 16 km/h ENE37%1014hPa
8:00 am27 °C31 °C23 °C80%Partly CloudyPartly Cloudy0% 0 mm 18 km/h ENE38%1015hPa
9:00 am26 °C29 °C24 °C86%Partly CloudyPartly Cloudy0% 0 mm 8 km/h ENE36%1015hPa
10:00 am28 °C31 °C23 °C74%Partly CloudyPartly Cloudy0% 0 mm 18 km/h ENE32%1015hPa
11:00 am28 °C32 °C23 °C73%ClearClear1% 0 mm 18 km/h ENE29%1015hPa
12:00 pm29 °C34 °C23 °C72%ClearClear1% 0 mm 6 km/h ENE23%1014hPa
1:00 pm28 °C31 °C22 °C70%ClearClear2%0 mm 16 km/h ENE19%1013hPa
2:00 pm28 °C31 °C22 °C71%ClearClear2%0 mm 14 km/h ENE12%1012hPa
3:00 pm29 °C34 °C23 °C67%ClearClear2%0 mm 3 km/h ENE13%1012hPa
4:00 pm26 °C29 °C22 °C79%ClearClear2%0 mm 11 km/h E15%1012hPa
5:00 pm25 °C28 °C22 °C83%ClearClear3%0 mm 10 km/h E17%1012hPa
6:00 pm27 °C30 °C23 °C79%ClearClear3%0 mm 0 km/h E15%1012hPa
7:00 pm24 °C27 °C22 °C88%ClearClear4%0 mm 8 km/h E15%1013hPa
8:00 pm24 °C27 °C23 °C90%ClearClear4%0 mm 8 km/h E16%1014hPa
9:00 pm26 °C29 °C23 °C86%ClearClear4%0 mm 0 km/h E21%1015hPa
10:00 pm23 °C26 °C22 °C92%ClearClear4%0 mm 8 km/h E23%1015hPa
11:00 pm23 °C25 °C22 °C93%ClearClear4%0 mm 8 km/h ENE17%1015hPa


Total Kjeldahl nitrogen or TKN is the sum of organic nitrogen, ammonia (NH3), and ammonium (NH4+) in the chemical analysis of soil, water, or wastewater (e.g. sewage treatment plant effluent).

$
0
0

 Kjeldahl method

The Kjeldahl method or Kjeldahl digestion (Danish pronunciation: [ˈkʰɛld̥æːˀl]) in analytical chemistry is a method for the quantitative determination of nitrogen in chemical substances developed by Johan Kjeldahl in 1883.

Contents

    1 Method
    2 Applications
        2.1 Total Kjeldahl nitrogen
        2.2 Conversion factors
        2.3 Sensitivity
        2.4 Limitations
    3 See also
    4 References
    5 External links

Method

The method consists of heating a substance with sulfuric acid, which decomposes the organic substance by oxidation to liberate the reduced nitrogen as ammonium sulfate. In this step potassium sulfate is added to increase the boiling point of the medium (from 337 °C to 373 °C) . Chemical decomposition of the sample is complete when the initially very dark-colored medium has become clear and colorless.

The solution is then distilled with a small quantity of sodium hydroxide, which converts the ammonium salt to ammonia. The amount of ammonia present, and thus the amount of nitrogen present in the sample, is determined by back titration. The end of the condenser is dipped into a solution of boric acid. The ammonia reacts with the acid and the remainder of the acid is then titrated with a sodium carbonate solution by way of a methyl orange pH indicator.

    Degradation: Sample + H2SO4 → (NH4)2SO4(aq) + CO2(g) + SO2(g) + H2O(g)
    Liberation of ammonia: (NH4)2SO4(aq) + 2NaOH → Na2SO4(aq) + 2H2O(l) + 2NH3(g)
    Capture of ammonia: B(OH)3 + H2O + NH3 → NH4+ + B(OH)4−
    Back-titration: B(OH)3 + H2O + Na2CO3 → NaHCO3(aq) + NaB(OH)4(aq) + CO2(g) + H2O

In practice, this analysis is largely automated; specific catalysts accelerate the decomposition. Originally, the catalyst of choice was mercuric oxide. However, while it was very effective, health concerns resulted in it being replaced by cupric sulfate. Cupric sulfate was not as efficient as mercuric oxide, and yielded lower protein results. It was soon supplemented with titanium dioxide, which is currently the approved catalyst in all of the methods of analysis for protein in the Official Methods and Recommended Practices of AOAC International.http://upload.wikimedia.org/wikipedia/commons/thumb/e/ee/Kjeldahl%27s_distillation.svg/800px-Kjeldahl%27s_distillation.svg.png
                           Kjeldahl digestion                                                                        Kjeldahl distillation
Applications
The Kjeldahl method's universality, precision and reproducibility have made it the internationally recognized method for estimating the protein content in foods and it is the standard method against which all other methods are judged. It is also used to assay soils, waste waters, fertilizers and other materials. It does not, however, give a measure of true protein content, as it measures nonprotein nitrogen in addition to the nitrogen in proteins. This is evidenced by the 2007 pet food incident and the 2008 Chinese milk powder scandal, when melamine, a nitrogen-rich chemical, was added to raw materials to fake high protein contents. Also, different correction factors are needed for different proteins to account for different amino acid sequences. Additional disadvantages, such as the need to use concentrated sulfuric acid at high temperature and the relatively long testing time (an hour or more), compare unfavorably with the Dumas method for measuring crude protein content.
Total Kjeldahl nitrogen

Total Kjeldahl nitrogen or TKN is the sum of organic nitrogen, ammonia (NH3), and ammonium (NH4+) in the chemical analysis of soil, water, or wastewater (e.g. sewage treatment plant effluent).

Today, TKN is a required parameter for regulatory reporting at many treatment plants, and as a means of monitoring plant operations. Conversion factors

TKN is often used as a surrogate for protein in food samples. The conversion from TKN to protein depends on the type of protein present in the sample and what fraction of the protein is composed of nitrogenous amino acids, like arginine and histidine. However, the range of conversion factors is relatively narrow. Example conversion factors, known as N factors, for foods range from 6.38 for dairy and 6.25 for meat, eggs, maize (corn) and sorghum to 5.83 for most grains; 5.70 for wheat flour, and 5.46 for peanuts.
Sensitivity

The Kjeldahl method is poorly sensitive in the original version. Other detection methods have been used to quantify NH4+ after mineralisation and distillation, achieving improved sensitivity: in-line generator of hydride coupled to a plasma atomic emission spectrometer (ICP-AES-HG, 10–25 mg/L),[6] potentiometric titration (>0.1 mg of nitrogen), zone capillary electrophoresis (1.5 µg/ml of nitrogen),and ion chromatography (0.5 µg/ml).
Limitations

Kjeldahl method is not applicable to compounds containing nitrogen in nitro and azo groups and nitrogen present in rings (e.g. pyridine) as nitrogen of these compounds does not convert to ammonium sulfate under the conditions of this method.


References

Kjeldahl, J. (1883) "Neue Methode zur Bestimmung des Stickstoffs in organischen Körpern" (New method for the determination of nitrogen in organic substances), Zeitschrift für analytische Chemie, 22 (1) : 366-383.
Julius B. Cohen Practical Organic Chemistry 1910 Link to online text
AOAC International
Dr. D. Julian McClements. "Analysis of Proteins". University of Massachusetts Amherst. Retrieved 2007-04-27.
http://www.fao.org/docrep/006/y5022e/y5022e03.htm
A.M.Y. Jaber, N.A. Mehanna, S.M. Sultan. Determination of ammonium and organic bound nitrogen by inductively coupled plasma emission spectroscopy. Talanta, 78 (4-5) 1298-1302, 2009. [1]
http://blog.pharmaphysic.fr/ecz-dosage-azote-kjeldahl/#more-592

Weather Report and Forecast For: Kakinada Dated :Nov 23, 2015

$
0
0
Local Weather Report and Forecast For: Kakinada    Dated :Nov 23, 2015
Kakinada
Past 24 Hours Weather Data
Maximum Temp(oC)30.7
Departure from Normal(oC)1
Minimum Temp (oC)23.1
Departure from Normal(oC)2
24 Hours Rainfall (mm)NIL
Todays Sunset (IST)17;25
Tommorows Sunrise (IST)06;10
Moonset (IST)03;12
Moonrise (IST)15;24
Today's Forecast:SKY CONDITION WOULD BE PARTLY CLOUDY. RAIN OR THUNDERSHOWERS MAY OCCUR IN PARTS OF CITY. MAXIMUM AND MINIMUM TEMPERATURES WOULD BE AROUND 31 AND 22 DEGREE CELSIUS.
Date Temperature ( o C ) Weather Forecast
Minimum Maximum
24-Nov 22.0 31.0 Partly cloudy sky with possibility of rain or Thunderstorm
25-Nov 22.0 31.0 Mainly or Generally cloudy sky with possibility of rain or Thunderstorm
26-Nov 22.0 31.0 Mainly or Generally cloudy sky with possibility of rain or Thunderstorm
27-Nov 21.0 30.0 Partly cloudy sky with Thundery development
28-Nov 21.0 30.0 Partly cloudy sky with Thundery development
29-Nov 21.0 30.0 Partly cloudy sky with Thundery development


INDIA METEOROLOGICAL DEPARTMENT 
NWP MODELS BASED DISTRICT LEVEL WEATHER PREDICTION
ISSUED ON: 23-11-2015
VALID TILL 08:30 IST OF THE NEXT 5 DAYS

DISTRICT : EAST-GODAVARI STATE : ANDRA-PRADESH
------------------- ------------------- ------------------- ------------------- ------------------- -------------------
PARAMETERS ENSEMBLE FCST
----------------------------------------------------------------------------------------------------
DAY-1 DAY-2 DAY-3 DAY-4 DAY-5
24/11 25/11 26/11 27/11 28/11
------------------- ------------------- ------------------- ------------------- ------------------- -------------------
Rainfall (mm) 0 0 0 0 0
Max Temperature ( deg C) 28 28 28 28 28
Min Temperature ( deg C) 15 14 13 13 14
Total cloud cover (octa) 2 2 1 2 2
Max Relative Humidity (%) 89 86 79 83 85
Min Relative Humidity (%) 49 47 41 39 41
Wind speed (kmph) 006 005 004 004 007
Wind direction (deg) 98 102 88 91 117
------------------ ------------------- ------------------- ------------------- ------------------- -------------------

NOTE: -99.0 ........ NO DATA

TimeTemp.Feels LikeDew PointHumidityConditionsPrecip.Liquid Precip.WindCloud CoverPressure
12:00 am25 °C25 °C23 °C91%ClearClear0% 0 mm 0 km/h ENE19%1014hPa
1:00 am23 °C23 °C22 °C93%ClearClear0% 0 mm 6 km/h NE20%1014hPa
2:00 am23 °C23 °C22 °C94%Partly CloudyPartly Cloudy0% 0 mm 6 km/h NE30%1013hPa
3:00 am23 °C23 °C22 °C93%Partly CloudyPartly Cloudy3% 0 mm 0 km/h NE31%1013hPa
4:00 am23 °C23 °C22 °C95%Partly CloudyPartly Cloudy4% 0 mm 6 km/h NE33%1013hPa
5:00 am23 °C25 °C22 °C93%Partly CloudyPartly Cloudy6% 0 mm 8 km/h NE34%1013hPa
6:00 am23 °C25 °C22 °C96%Partly CloudyPartly Cloudy5%0 mm 0 km/h NE37%1014hPa
7:00 am25 °C28 °C23 °C85%Partly CloudyPartly Cloudy5%0 mm 13 km/h NE40%1014hPa
8:00 am26 °C29 °C23 °C82%Partly CloudyPartly Cloudy4%0 mm 14 km/h ENE41%1015hPa
9:00 am26 °C28 °C23 °C86%Partly CloudyPartly Cloudy3%0 mm 3 km/h ENE39%1015hPa
10:00 am28 °C31 °C22 °C74%Partly CloudyPartly Cloudy2%0 mm 14 km/h ENE31%1015hPa
11:00 am28 °C31 °C22 °C71%ClearClear2%0 mm 14 km/h ENE25%1014hPa
12:00 pm29 °C33 °C23 °C70%ClearClear2%0 mm 3 km/h ENE14%1013hPa
1:00 pm28 °C31 °C22 °C71%ClearClear2%0 mm 14 km/h E14%1012hPa
2:00 pm27 °C31 °C22 °C73%ClearClear2%0 mm 14 km/h E16%1012hPa
3:00 pm29 °C34 °C23 °C68%ClearClear2%0 mm 3 km/h E23%1011hPa
4:00 pm26 °C28 °C22 °C79%ClearClear3%0 mm 11 km/h E25%1011hPa
5:00 pm25 °C28 °C22 °C83%ClearClear3%0 mm 10 km/h E28%1012hPa
6:00 pm27 °C30 °C22 °C76%Partly CloudyPartly Cloudy3%0 mm 0 km/h E30%1012hPa
7:00 pm24 °C27 °C22 °C85%Partly CloudyPartly Cloudy3%0 mm 8 km/h E33%1013hPa
8:00 pm24 °C27 °C22 °C88%Partly CloudyPartly Cloudy3%0 mm 8 km/h E36%1014hPa
9:00 pm26 °C28 °C22 °C83%Partly CloudyPartly Cloudy4%0 mm 0 km/h ENE36%1015hPa
10:00 pm23 °C25 °C22 °C90%Partly CloudyPartly Cloudy4%0 mm 6 km/h ENE35%1015hPa
11:00 pm23 °C24 °C22 °C91%Partly CloudyPartly Cloudy4%0 mm 6 km/h NE33%1015hPa

Yesterday's Extremes

Country HighsCountry Lows


Carbon Dioxide Bidding Farewell to 400-ppm Benchmark

$
0
0

Carbon Dioxide Bidding Farewell to 400-ppm Benchmark

By: Bob Henson , 5:18 PM GMT on November 20, 2015
On an otherwise unremarkable day last week--November 11, 2015 (noted mainly for being Veterans Day in the U.S.)--a crucial milestone in global climate was quietly transcended. The daily average concentration of carbon dioxide in the air that day at Hawaii’s Mauna Loa Observatory was 399.68 parts per million. On November 12 it rose to 401.64 ppm, and it’s quite possible that we’ll never see another day in our lives with the daily Mauna Loa CO2 reading below 400 ppm. Greenhouse gases have been building in our atmosphere for more than a century, so this news doesn’t come as a shock so much as a reminder of what our continued use of fossil fuels is doing to the atmosphere. The data also serve as a prelude to the upcoming United Nations climate talks in Paris, which face some unexpected obstacles (see below) as a result of the city’s terrorist attacks of November 13.


Figure 1. Hourly and daily averages of atmospheric carbon dioxide as measured at Mauna Loa Observatory for the week of November 12-18, 2015. Image credit: Scripps/The Keeling Curve.

If it seems like you heard the news about the atmosphere reaching 400 ppm quite a while ago, you can attribute your deja vu to the seasonal cycle. Figure 2 (below) shows what’s been going on. The 400-ppm mark was first reached in May 2013--but only for a few days, during the annual peak of atmospheric CO2. Along with the year-on-year rise due to fossil-fuel use, CO2 ebbs and flows in the atmosphere each year as vegetation grows and dies back in the Northern Hemisphere (where the majority of the world’s plant life is located). In 2014, the daily Mauna Loa readings stayed above 400 ppm for more than three months. This year they rose above 400 ppm even longer, again dipping below 400 ppm in August before climbing back above the benchmark this month.

Ordinarily, we might expect one more northern summer with CO2 values below 400 ppm, but El Niño could prevent that. A strong El Niño event, like the one now under way, tends to produce drought in some of the world’s most heavily forested areas, such as Indonesia. Averaged across the globe, this temporarily reduces the total amount of CO2 soaked up by Earth’s vegetation. In addition, the large fires common in drought-stricken areas pour even more CO2 into the air. Based on this prospect, Ralph Keeling, who directs the CO2 measurement program at Mauna Loa for the Scripps Institute of Oceanography, made a fairly bold prediction on October 21: “By sometime in the next month or two, CO2 will again rise above 400 ppm. Will daily values at Mauna Loa ever fall below 400 ppm again in our lifetimes? I’m prepared to project that they won’t, making the current values the last time the Mauna Loa record will produce numbers in the 300s.”


Figure 2. CO2 measurements from Mauna Loa Observatory for (top to bottom) the past six months, the past two years, and since the observatory was established in 1958. The final panel shows the Mauna Loa record juxtaposed with CO2 readings deduced from air trapped in ice cores. The ice-core evidence shows that carbon dioxide waxed and waned with a number of ice ages, but the current values near 400 ppm are far greater than any peaks observed in at least the last 800,000 years--and probably much further back than that. Image credit: Scripps/The Keeling Curve.


What next?
Figure 1 shows that the hourly readings at Mauna Loa can vary quite a bit. It’s possible we’ll see more days this month with hourly readings dipping below 400 ppm, as they did on November 18. However, even these hourly readings should remain firmly above 400 ppm within a few weeks. If Keeling’s prediction is accurate, daily readings may stay above 400 ppm in 2015 and for many years thereafter. It’s also still possible that a few hours or even several days might manage to dip just below 400 ppm in mid-2016.

There are other CO2 measurement facilities around the world, although the Mauna Loa record is the one most commonly cited, with its high quality, pristine location, and longevity (Keeling’s father, Charles David Keeling, began regular measurements there in 1958). Different measuring sites will see the 400-ppm mark in their rear-view mirrors at slightly different times, due to local atmospheric variations, but there is no doubt where the global atmosphere is headed. I asked Ralph Keeling on Wednesday for his latest thoughts.

“It's too early to be 100% certain, but I agree that it's starting to look like we are already over 400 ppm for this year, with the last daily and weekly values below 400 ppm occurring earlier this month,” Keeling said. “It also looks like the November monthly average will also be above 400 ppm.”

Climate-change deniers and contrarians typically look beyond CO2 measurements when crafting their talking points, but a few misunderstandings about the role of carbon dioxide still crop up--many of them skillfully rebutted by the website skepticalscience.com. “A possible misconception about the Mauna Loa CO2 record is that the overall increase is influenced by emissions from the volcano,” Keeling told me. “In fact, the volcanic effects are very small and are easily filtered out, like static on a radio signal. Dozens of stations around the world show essentially identical long-term trends, including a record from the South Pole also going back to the 1950s.  The CO2 at these stations might be a little higher or lower than Mauna Loa in a particular season or averaged over the calendar year. But the upward trends are all pretty similar. The rise is therefore clearly a global phenomenon.”

What it means for the Paris climate talks
The 400-ppm news comes just as Earth is experiencing a heat wave fueled by the long-term rise in greenhouse gases and goosed by El Niño. NOAA announced on Wednesday that global temperatures in October 2015 showed the largest departure from the long-term average for any month going back to 1880. The UK Met Office now predicts that global temperature in 2015 will likely end up at least 1°C warmer than the preindustrial average. This would put our planet halfway to the 2°C warming that’s long been viewed by many scientists and policy experts as a level that significantly raises the odds of major climate disruption (although there is nothing magic about 2°C; a smaller rise could still have serious consequences). A brief video from the journal Nature, released on Thursday, serves as a quick guide to the origin and significance of the 2°C goal.

All of these happenings underscore the importance of the two-week-long meeting in Paris that begins on November 30. This is COP21, the 21st annual Conference of the Parties to the United Nations Framework Convention on Climate Change, which was signed in 1992 and ratified by the United States and all other UN members. There has been an unprecedented level of cooperation among the world’s leading carbon-emitting nations in the lead-up to COP21, which raises the odds that a workable agreement for carbon reduction just might be achievable. In contrast to the Kyoto Protocol, which failed to gain support from the world’s two largest carbon emitters--the United States and China--it’s expected that any deal arising from Paris will hinge on voluntary commitments (dubbed “intended nationally determined contributions”, or INDCs) that have already been submitted by more than 160 nations representing more than 90% of global emissions. In an upcoming post, we’ll take a closer look at what to expect and what to watch for as COP21 unfolds. WU climate blogger Dr. Ricky Rood has already filed a series of posts that lay out important context ahead of the Paris meeting. I attended the ill-fated Copenhagen meeting in 2009 (COP15) and came away profoundly discouraged at the lack of progress there. This time around, I am cautiously optimistic that a truly global deal will be struck, although I’m not confident that it will be enough to prevent 2°C of warming.


Figure 3. One of the major protest marches held during the Copenhagen climate summit in December 2009. Image credit: Bob Henson.

In wake of attacks, a global climate march gets new attention
Several experts involved with the upcoming UN meeting have speculated that global leaders now have even more incentive to make the talks a success in the wake of the deadly November 13 attacks in Paris. At the same time, the French government announced on Wednesday that massive climate marches planned for Paris on November 29 and December 12 would not be allowed, due to the heightened state of alert following the deadly attacks of November 13. Organizers led by Avaaz.org and 350.org have responded by intensifying their efforts toward a Global Climate March, scheduled for the weekend of November 28-29. More than 2000 events are on tap in towns and cities around the world. You can see what’s happening near you by using the interactive tool at this Guardian article.

Worker Health & Safety Principlesthe following list of seven principles

$
0
0

Worker Health & Safety Principlesthe following list of seven principles (modeled after the list of Quality Principles set out in ISO 9000).

 Worker Health and Safety Principles
 1.       Health and Safety Focus
Worker health and well-being is an important organizational resource to be protected through the prevention of injury and ill health.
 2.       Leadership Commitment
Top management needs to provide the leadership and resources necessary for effective management of OH&S issues
 3.       Worker Engagement
Workers need to have the information, opportunities and accountability necessary for them to actively participate in ensuring their own safety
 4.       Factual Approach to Decision Making
Decisions and actions related to evaluating and controlling OH&S risks should, to the extent feasible, be based on the analysis of factual information
 5.       Prioritization of Controls
Hazards should be controlled using process, equipment and facility controls before administrative controls and personal protective equipment are utilized
 6.       Prevention Instead of Reaction
Establishing systematic processes to identify and address OH&S risks is more effective than waiting until after an incident has occurred to react
 7.        Supply Chain Accountability
Organizations need to act ethically when transferring OH&S risks to others in their supply chain

kakinada weather

$
0
0
                                             INDIA METEOROLOGICAL DEPARTMENT 
NWP MODELS BASED DISTRICT LEVEL WEATHER PREDICTION
ISSUED ON: 24-11-2015
VALID TILL 08:30 IST OF THE NEXT 5 DAYS

DISTRICT : EAST-GODAVARI STATE : ANDRA-PRADESH
------------------- ------------------- ------------------- ------------------- ------------------- -------------------
PARAMETERS ENSEMBLE FCST
----------------------------------------------------------------------------------------------------
DAY-1 DAY-2 DAY-3 DAY-4 DAY-5
25/11 26/11 27/11 28/11 29/11
------------------- ------------------- ------------------- ------------------- ------------------- -------------------
Rainfall (mm) 0 0 0 0 0
Max Temperature ( deg C) 28 28 28 28 28
Min Temperature ( deg C) 14 13 13 14 15
Total cloud cover (octa) 3 1 2 3 8
Max Relative Humidity (%) 91 82 82 87 80
Min Relative Humidity (%) 50 45 42 43 45
Wind speed (kmph) 005 005 004 007 010
Wind direction (deg) 88 96 102 103 82
------------------ ------------------- ------------------- ------------------- ------------------- -------------------

NOTE: -99.0 ........ NO DATA 
 
TimeTemp.Feels LikeDew PointHumidityConditionsPrecip.Liquid Precip.WindCloud CoverPressure
7:00 am26 °C29 °C23 °C84%ClearClear0% 0 mm 10 km/h NE22%1014hPa
8:00 am27 °C30 °C23 °C80%ClearClear0% 0 mm 13 km/h NE17%1014hPa
9:00 am26 °C29 °C23 °C83%ClearClear0% 0 mm 2 km/h ENE14%1014hPa
10:00 am28 °C31 °C22 °C71%ClearClear0% 0 mm 13 km/h ENE12%1014hPa
11:00 am28 °C31 °C22 °C67%ClearClear0% 0 mm 13 km/h ENE11%1014hPa
12:00 pm29 °C33 °C22 °C67%ClearClear0% 0 mm 2 km/h E12%1013hPa
1:00 pm28 °C30 °C21 °C66%ClearClear0% 0 mm 13 km/h E9%1012hPa
2:00 pm27 °C29 °C21 °C68%ClearClear1% 0 mm 13 km/h E9%1012hPa
3:00 pm29 °C33 °C22 °C65%ClearClear1% 0 mm 2 km/h E10%1012hPa
4:00 pm26 °C28 °C21 °C76%ClearClear2% 0 mm 10 km/h E1%1012hPa
5:00 pm25 °C27 °C21 °C81%ClearClear3% 0 mm 8 km/h ESE2%1012hPa
6:00 pm26 °C29 °C22 °C76%ClearClear3% 0 mm 0 km/h E6%1013hPa
7:00 pm23 °C25 °C21 °C86%ClearClear3% 0 mm 8 km/h E6%1013hPa
8:00 pm23 °C24 °C21 °C89%ClearClear3% 0 mm 8 km/h E10%1014hPa
9:00 pm24 °C27 °C22 °C83%ClearClear3% 0 mm 0 km/h ENE10%1014hPa
10:00 pm22 °C24 °C21 °C89%ClearClear3% 0 mm 8 km/h ENE3%1015hPa
11:00 pm22 °C24 °C21 °C90%ClearClear3% 0 mm 8 km/h NE12%1014hPa

Tuesday, November 24, 2015


ActualAverage Record
Temperature 
Mean Temperature27 °C -  
Max Temperature31 °C - - ()
Min Temperature23 °C - - ()
Cooling Degree Days15  
Growing Degree Days30 (Base 50)  
Moisture 
Dew Point24 °C  
Average Humidity80  
Maximum Humidity94  
Minimum Humidity65  
Precipitation 
Precipitation0.0 mm - - ()
Sea Level Pressure 
Sea Level Pressure1013.38 hPa  
Wind 
Wind Speed1 km/h ()  
Max Wind Speed6 km/h  
Max Gust Speed -   
Visibility7.0 kilometers  
Events    
T = Trace of Precipitation, MM = Missing ValueSource: Averaged Metar Reports

Daily Weather History Graph

Daily Weather History Graph

Search for Another Location

Airport or City:

Trip Planner

Search our weather history database for the weather conditions in past years. The results will help you decide how hot, cold, wet, or windy it might be!
Date:

Astronomy

Nov. 24, 2015RiseSet
Actual Time6:09 AM IST5:25 PM IST
Civil Twilight5:46 AM IST5:48 PM IST
Nautical Twilight5:20 AM IST6:14 PM IST
Astronomical Twilight4:54 AM IST6:41 PM IST
Moon4:14 PM IST (11/24)4:12 AM IST (11/24)
Length of Visible Light 12h 01m
Length of Day
11h 15m


Hourly Weather History & Observations
Time (IST)Temp.Dew PointHumidityPressureVisibilityWind DirWind SpeedGust SpeedPrecipEventsConditions
2:30 AM24 °C23 °C89%1013 hPa4 kmCalmCalm - -   Scattered Clouds
5:30 AM23 °C22 °C94%1013 hPa4 kmCalmCalm - -   Scattered Clouds
8:30 AM25 °C24 °C88%1015 hPa10 kmCalmCalm - -   Scattered Clouds
11:30 AM30 °C25 °C66%1014 hPa10 kmEast5.6 km/h /   - -   Scattered Clouds
2:30 PM30 °C24 °C65%1012 hPa10 kmCalmCalm - -   Clear
5:30 PM28 °C24 °C74%1012 hPa10 kmCalmCalm - -   Clear
8:30 PM27 °C24 °C79%1014 hPa4 kmCalmCalm - -   Clear
11:30 PM26 °C24 °C89%1014 hPa4 kmCalmCalm - -   Clear

Month of November, 2015


MaxAvgMinSum
Temperature 
Max Temperature32 °C30 °C23 °C
Mean Temperature28 °C26 °C20 °C
Min Temperature26 °C23 °C19 °C
Degree Days 
Heating Degree Days (base 65)0000
Cooling Degree Days (base 65)18144355
Growing Degree Days (base 50)332918731
Dew Point 
Dew Point26 °C23 °C11 °C
Precipitation 
Precipitation33.0 mm2.3 mm0.0 mm57.40 mm
Snowdepth - - - -
Wind 
Wind18 km/h4 km/h0 km/h
Gust Wind - - -
Sea Level Pressure 
Sea Level Pressure1015 hPa1012 hPa1008 hPa

Monthly Weather History Graph

Monthly Weather History Graph

Astronomy

Nov. 24, 2015RiseSet
Actual Time6:09 AM IST5:25 PM IST
Civil Twilight5:46 AM IST5:48 PM IST
Nautical Twilight5:20 AM IST6:14 PM IST
Astronomical Twilight4:54 AM IST6:41 PM IST
Moon4:14 PM IST (11/24)4:12 AM IST (11/24)
Length of Visible Light 12h 01m
Length of Day
11h 15m
Waxing Gibbous, 96% of the Moon is Illuminated


Daily Weather History & Observations

2015Temp. (°C)Dew Point (°C)Humidity (%)Sea Level Press. (hPa)Visibility (km)Wind (km/h)Precip. (mm)Events
Novhighavglowhighavglowhighavglowhighavglowhighavglowhighavghighsum 
129262325242497877310121010.37100810.07.04.0156 - 0.0Rain
231272325242391776110141012.25101110.07.04.074 - 0.0 
332282425242492786210141012.38101010.07.04.063 - 0.2 
432282425242392766110141012.00101010.07.04.062 - 0.0 
532282425242488755710141012.00101010.07.04.061 - 0.0 
632282325242391766110131011.25100910.07.04.061 - 0.0 
731272325232295745810141012.37101110.07.04.094 - 0.0 
831282424232283695010141012.38101110.07.04.0115 - 0.0 
9292826262423100847110131011.63101010.07.04.0119 - 3.0Rain
1029262223222092745810121010.38100910.06.34.0118 - 0.2Rain
1131262224222192735010131011.25101010.07.04.061 - 0.0 
1231262222201192651910141013.00101210.07.04.061 - 0.0 
1332262122212091695110151013.63101210.07.04.061 - 0.0 
1430252024221985746010141011.88101010.07.04.061 - 0.0 
1531262124222087705710121010.50100910.07.04.062 - 0.0 
1627252324222183746310131010.12100910.06.34.0113 - 1.0 
1723201921201892866510121010.12100810.04.84.01510 - 33.0Rain
1828242023222091776510131011.25101010.07.04.0159 - 0.0 
1927262424222197806510141012.50101110.07.04.01813 - 20.0Rain
2029262223211898744710141012.75101110.08.54.0117 - 0.0Rain
2130262124222084746210141012.62101110.07.04.061 - 0.0 
2230262224232192806410141012.62101110.07.04.062 - 0.0 
2330262324232292805710151013.50101210.07.04.061 - 0.0 
2431272324242294806510151013.38101210.07.04.061 - 0.0 
2525252424242390909010131012.5010124.04.04.000 - 0.0 


Top 22 Benefits of Trees NFCL PLANTED 500 PLANTS UNDER SUPER VISION OF SHRI R. RAGHAVAN AND APPCB ENGINEER

$
0
0
Top 22 Benefits of Trees NFCL PLANTED 500 PLANTS UNDER SUPER VISION OF SHRI R. RAGHAVAN AND APPCB ENGINEER
Around 200 associates, college students gathered at NFCL play ground for the promotion  of environment, health, safety and quality for better life and  thanks to one and all mainly , Shri R. RAGHAVAN, Shri GVS ANAND, Shri. VK GROVER,ShriVS SUNDER, Shri PC MOHAN, SHRI GVRK RAJU,Shri JK PRASAD ,Shri PHN REDDY, Shri BHSN RAJU AND ASSOCIATES actively participated FOR TREE PLANTAIN  , WE HAVE PLANTED AND ASSURED BY PROVIDING WATER ALL THE SAMPLES SHALL GROW AND CONTINUOUS MONITORING.WILL BE DONE.
 To take initiative for plantation to check the dust concentration into atmosphere.
Ambient Air constitutes various size ranges of solid particles commonly recognized as Particulates or Dust, which are continuously agglomerated and deposited, on various surfaces. The deposited particulate matter is a conglomerate of chemically heterogeneous
Research has shown that plant leaves can act as biological filters, removing large quantities of particles from the urban atmosphere. Stomata are microscopic pores on the underside (abaxial) of the leaf. These allow air into and out of the leaf through which the plant takes in CO2 and lets out O2, and allows water vapor out in the process of transpiration. As air passes through the stomata, most of the airborne particles will not pass through the stomata but will rather eliminated on the leaf’s outer surface due to available moisture.

There is a certain amount of force needed for particles to stick to surface. This amount is greater depending on the size of the particle. Because the airflow through the stomata is not very powerful, only the smaller particles will stick to the bottom surface. The particles on the top surface of the leaves will mainly be from the settling of dust. Because particles settled on upper surface of leave are both coarse and fine particles captured by leave surface because of favourable morphological features of leaves. These particulates remain adhered to plant leaves till these are washed down through rain or artificially.


Something about NFCL  step HAS BEEN  taken towards Environment protection 4 lakhs plant grown in Saline soil.
The Green Belt at NFCL, Kakinada, had to be established overcoming a lot of difficulties such as those listed below :

Physiography :

The area consisted of Level to gently sloping coastal plains with pockets of low lands, depressions and waterlogged areas close to the seacoast.  Part of the area was under backwaters connecting the sea during the high tides.

Hydrology :

The borrow pits and depressional areas remained water logged almost throughout the year.  The deteriorated/salt-infested lands also remained water logged for prolonged periods.
Vegetation :

The area in general was devoid of any vegetation except the sand-casted area, which used to have a few ‘Palmyra’ trees.  The waterlogged area towards south-east being highly saline was totally devoid of any vegetation.
Soils :

The soils support very little vegetation and were primarily covered with sparse grass.  The deteriorated soils constituted large continuous flat lands that had degenerated due to high salt infestation and incrustations on the surface.  The sub soils had high concentrations of salts beyond critical limits with electrical conductivity ranging from 10 to 15 umhos per cm.  The available P 205 was very low.

Thus it took stupendous efforts by NFCL to overcome all these natural hindrances and to transform a once highly saline marshy area devoid of any vegetation into lush Green Park.

Presently the Green belt is serving as a Natural Habitat for Flora & Fauna” and the factory and the ecological system developed in the Green belt are existing in ‘Harmony’.

Around 69, 000 plants being planted as mortality replacement due to saline soil profiles, over the period, in order to sustain Green Belt.
Now the No. of plant is more than 4 lakhs .


DEPRESSURIZATION CATALYST (NICKEL- MOLYBDENUM CATALYST)

$
0
0
 WONDERFUL DISCUSSION BY SHRI V. SHYAM SUNDER SIR AND SHRI JKP SIR.

DEPRESSURIZATION CATALYST (NICKEL- MOLYBDENUM CATALYST)
    The natural gas feed stock supplied to NFCL contains no H2S, but it is anticipated that future supplies may contain sulphur compounds which have to be removed in order not to poison the reforming catalysts and the LT shift catalyst. Natural Gas from battery limit is heated to 385 deg.C in the Feed stock preheater F-203, and is passed through the Hdrogenator. A bed of Nickel-Molybdenum catalyst is provided to catalyse the hydrogenation of organic sulphur compounds to hydrogen sulphide.  There are two types of organic sulphur compounds that may be present in the feed stock.  One is called 'Normal Sulphur' containing H2S, COS, CS2 and Mercaptans and the other is called 'Less Reactive Sulphur', containing Thiophenes, Thioethers etc.  In case of normal sulphur except Mercaptan Hydrogen recycle gas is not consumed where as for less reactive sulphur, recycle hydrogen is consumed as per the following hydrogenation reactions:
                   RSH + H2                               RH + H2S
                   (Mercaptans)
                   R1SR + 2H2                            RH + R1H + H2S
                   (Thioethers)
                   R1SSR + 3H2                          RH + R1H + 2H2S
                   (Thiophenes)
                
If sulphur is present, natural gas is mixed with recycle gas from synthesis gas compressor first stage discharge with flow of recycle gas around 1306 NM3/hr., in order to avoid Carbon deposition on the catalyst due to catalytic cracking of higher hydrocarbons if any. After preheating to 385 deg.C,the gas mixture passes to Hydrogenator Reactor R-201 and reacts to produce H2S.  The above reactions are exothermic but insignificant (which depends on the type of Sulphur that determines the number of moles of hydrogen taken up).  H2S produced in R-201 and that already present in Natural Gas is then removed in H2S Absorbers R-202 A/B, thereby the gas will be free of H2S.  Each absorber contains one bed of Zno catalyst to absorb the sulphur.  The absorbers are operating in series with the second vessel acting as guard.  When the Zno in the first vessel is getting exhausted, a break through of H2S from the first vessel may be observed.  The operation will then continue with the second vessel in service, while the first vessel is being reloaded with fresh catalyst.  The sulphur content at the exit of R-202B shall be less than 0.1 ppm on dry volume basis at all times which is tolerant to reforming catalyst.
    The sulphur removal reaction in Zno bed takes place as follows:
                  
                   Zno  +  H2S                             ZnS  +  H2O
                   Zno  +  COS                             ZnS  +  CO2
    Zno reaction with 'S' depend on :
    1.   Type of sulphur compounds.
    2.   Temperature:  Increase in temperature will generally increase the ability of Zno to remove sulphur.
    3.   Capacity   :   As Zno reacts with sulphur it gets saturated with sulphur and looses its activity.  Normal life of Zno catalyst depends on the H2S and sulphur concentration in the natural gas.
Reactor
Catalyst
 Type
Size
mm
Volume
M3
Bulk Density
Bed ht.
mm
composition
Life time (exp)
R-201
TK-251
5X2.5
8.44
480
2220
NiO:2-3%
MoO:10%
>5
R-202A
HTZ-3
4
10.64
1300
2800
ZnO:99%

R-202B
HTZ-3
4
10.64
1300
2800
ZnO:99%
Guard

EAST-GODAVARI WEATHER

$
0
0
 INDIA METEOROLOGICAL DEPARTMENT 
NWP MODELS BASED DISTRICT LEVEL WEATHER PREDICTION
ISSUED ON: 25-11-2015
VALID TILL 08:30 IST OF THE NEXT 5 DAYS

DISTRICT : EAST-GODAVARI STATE : ANDRA-PRADESH
------------------- ------------------- ------------------- ------------------- ------------------- -------------------
PARAMETERS ENSEMBLE FCST
----------------------------------------------------------------------------------------------------
DAY-1 DAY-2 DAY-3 DAY-4 DAY-5
26/11 27/11 28/11 29/11 30/11
------------------- ------------------- ------------------- ------------------- ------------------- -------------------
Rainfall (mm) 0 0 0 0 7
Max Temperature ( deg C) 28 28 28 28 28
Min Temperature ( deg C) 13 13 14 15 14
Total cloud cover (octa) 3 3 4 6 7
Max Relative Humidity (%) 86 86 88 77 86
Min Relative Humidity (%) 49 45 45 45 53
Wind speed (kmph) 005 005 007 011 009
Wind direction (deg) 131 89 103 82 106
------------------ ------------------- ------------------- ------------------- ------------------- -------------------

NOTE: -99.0 ........ NO DATA
KAKINADA WEATHER FORECAST

TimeTemp.Feels LikeDew PointHumidityConditionsPrecip.Liquid Precip.WindCloud CoverPressure
12:00 am23 °C23 °C21 °C87%ClearClear0% 0 mm 0 km/h NNE16%1014hPa
1:00 am22 °C22 °C21 °C92%ClearClear0% 0 mm 8 km/h NNE16%1013hPa
2:00 am22 °C22 °C21 °C93%ClearClear0% 0 mm 6 km/h NNE12%1013hPa
3:00 am22 °C22 °C21 °C92%ClearClear2% 0 mm 0 km/h NNE10%1013hPa
4:00 am21 °C21 °C21 °C95%ClearClear3% 0 mm 6 km/h NNE9%1012hPa
5:00 am22 °C22 °C20 °C92%ClearClear3% 0 mm 6 km/h NE12%1013hPa
6:00 am22 °C23 °C21 °C92%ClearClear4%0 mm 0 km/h NE12%1013hPa
7:00 am24 °C27 °C21 °C83%ClearClear4%0 mm 10 km/h NE12%1014hPa
8:00 am26 °C28 °C22 °C78%ClearClear3%0 mm 11 km/h ENE6%1014hPa
9:00 am25 °C28 °C22 °C82%ClearClear2%0 mm 0 km/h ENE6%1014hPa
10:00 am27 °C29 °C21 °C70%ClearClear2%0 mm 11 km/h ENE7%1014hPa
11:00 am28 °C30 °C21 °C68%ClearClear1%0 mm 11 km/h E6%1014hPa
12:00 pm29 °C32 °C22 °C68%ClearClear1%0 mm 2 km/h E6%1013hPa
1:00 pm27 °C30 °C21 °C67%ClearClear1%0 mm 13 km/h E5%1012hPa
2:00 pm27 °C29 °C21 °C69%ClearClear1%0 mm 11 km/h E4%1011hPa
3:00 pm29 °C33 °C22 °C66%ClearClear1%0 mm 0 km/h E4%1011hPa
4:00 pm26 °C28 °C21 °C77%ClearClear2%0 mm 8 km/h ESE4%1011hPa
5:00 pm24 °C27 °C21 °C81%ClearClear3%0 mm 8 km/h ESE5%1011hPa
6:00 pm26 °C29 °C22 °C76%ClearClear3%0 mm 0 km/h ESE8%1012hPa
7:00 pm23 °C25 °C21 °C86%ClearClear3%0 mm 8 km/h E11%1013hPa
8:00 pm23 °C24 °C21 °C89%ClearClear3%0 mm 8 km/h E15%1013hPa
9:00 pm24 °C27 °C22 °C83%ClearClear3%0 mm 2 km/h E15%1013hPa
10:00 pm22 °C23 °C21 °C91%ClearClear3%0 mm 8 km/h E11%1013hPa
11:00 pm22 °C23 °C21 °C90%ClearClear3%0 mm 8 km/h ESE9%1013hPa

Wednesday, November 25, 2015


ActualAverage Record
Temperature
Mean Temperature26 °C-
Max Temperature30 °C- - ()
Min Temperature23 °C- - ()
Cooling Degree Days16
Growing Degree Days30 (Base 50)
Moisture
Dew Point23 °C
Average Humidity77
Maximum Humidity90
Minimum Humidity64
Precipitation
Precipitation0.0 mm- - ()
Sea Level Pressure
Sea Level Pressure1013.14 hPa
Wind
Wind Speed0 km/h ()
Max Wind Speed0 km/h
Max Gust Speed-
Visibility7.4 kilometers
Events 
T = Trace of Precipitation, MM = Missing ValueSource: Averaged Metar Reports

Daily Weather History Graph

Daily Weather History Graph


Hourly Weather History & Observations

Time (IST)Temp.Dew PointHumidityPressureVisibilityWind DirWind SpeedGust SpeedPrecipEventsConditions
2:30 AM25 °C24 °C90%1013 hPa4 kmCalmCalm- -   Clear
5:30 AM24 °C23 °C90%1012 hPa4 kmCalmCalm- -   Clear
8:30 AM25 °C23 °C84%1015 hPa10 kmCalmCalm- -   Scattered Clouds
11:30 AM30 °C24 °C65%1014 hPa10 kmCalmCalm- -   Scattered Clouds
2:30 PM30 °C24 °C64%1012 hPa10 kmCalmCalm- -   Scattered Clouds
5:30 PM27 °C22 °C68%1012 hPa10 kmCalmCalm- -   Scattered Clouds
8:30 PM26 °C22 °C75%1014 hPa4 kmCalmCalm- -   Scattered Clouds


MaxAvgMinSum
Temperature
Max Temperature32 °C30 °C23 °C
Mean Temperature28 °C26 °C20 °C
Min Temperature26 °C22 °C19 °C
Degree Days
Heating Degree Days (base 65)0000
Cooling Degree Days (base 65)18144359
Growing Degree Days (base 50)332918734
Dew Point
Dew Point26 °C23 °C11 °C
Precipitation
Precipitation33.0 mm2.3 mm0.0 mm57.40 mm
Snowdepth- - - -
Wind
Wind18 km/h4 km/h0 km/h
Gust Wind- - -
Sea Level Pressure
Sea Level Pressure1015 hPa1012 hPa1008 hPa

Monthly Weather History Graph

Monthly Weather History Graph

Daily Weather History & Observations

2015Temp. (°C)Dew Point (°C)Humidity (%)Sea Level Press. (hPa)Visibility (km)Wind (km/h)Precip. (mm)Events
Novhighavglowhighavglowhighavglowhighavglowhighavglowhighavghighsum
129262325242497877310121010.37100810.07.04.0156- 0.0Rain
231272325242391776110141012.25101110.07.04.074- 0.0 
332282425242492786210141012.38101010.07.04.063- 0.2 
432282425242392766110141012.00101010.07.04.062- 0.0 
532282425242488755710141012.00101010.07.04.061- 0.0 
632282325242391766110131011.25100910.07.04.061- 0.0 
731272325232295745810141012.37101110.07.04.094- 0.0 
831282424232283695010141012.38101110.07.04.0115- 0.0 
9292826262423100847110131011.63101010.07.04.0119- 3.0Rain
1029262223222092745810121010.38100910.06.34.0118- 0.2Rain
1131262224222192735010131011.25101010.07.04.061- 0.0 
1231262222201192651910141013.00101210.07.04.061- 0.0 
1332262122212091695110151013.63101210.07.04.061- 0.0 
1430252024221985746010141011.88101010.07.04.061- 0.0 
1531262124222087705710121010.50100910.07.04.062- 0.0 
1627252324222183746310131010.12100910.06.34.0113- 1.0 
1723201921201892866510121010.12100810.04.84.01510- 33.0Rain
1828242023222091776510131011.25101010.07.04.0159- 0.0 
1927262424222197806510141012.50101110.07.04.01813- 20.0Rain
2029262223211898744710141012.75101110.08.54.0117- 0.0Rain
2130262124222084746210141012.62101110.07.04.061- 0.0 
2230262224232192806410141012.62101110.07.04.062- 0.0 
2330262324232292805710151013.50101210.07.04.061- 0.0 
2431272324242294806510151013.38101210.07.04.061- 0.0 
2530262324232290776410151013.14101210.07.44.000- 0.0

Orsat Analysis

$
0
0
for quality of analysis improvements with the help of shri jkp sir we are assuring flue gasanalyisis and product CO2 AND CDR CO2


Orsat Analysis

Orsat analysis is one of techniques to analyze flue gases. Orsat analysis is even now regarded as the most beneficial technique to analyze flue gases correctly. Orsat device as shown in Figure 1 contains some components (labeled) such as:
-          Label A is straight burette which flow from bottom to top and contains 100 sections
-          Label B is aspirator container
-          Label D1, D2, and D3 are pipettes that are numbered 3 pieces comprising absorbents stuffed with beads or glass tubes intended for improving absorption areas. Each pipettes contains solution as follow:
·         CuCl2 (cuprous chloride) in HCl intended for CO
·         Alkaline pyrogallol intended for O2
·         KOH (Potassium hydroxide) intended for SO2 dan CO2)

Each one pipette is linked to an unoccupied pipette lurking behind it so absorbent could subside directly into this when the gas is accepted. Label C is the primary separating cock pertaining to gas maintenance in the process in conjunction with Label F1, F2, and F3 which is 3 separating cocks intended for 3 pipettes.
Figure 1: Orsat Device for Orsat Analysis
(Source: Book-Boiler for Power and Process-Kumar Rayaprolu)
The process of orsat analysis is as follow:
  1. Aspirator container aspirates gas approximately 100 cc.
  2. 3 absorbents absorbs gas in certain series
  3. Record absorption through variation in the burette. Caution, tight adherence to the right planning of absorbents and the process to specific focus are required to get mistake-free outcomes. To get correct samples on a continual base, a suction pump is utilized to suck up flue gas, because the aspirator only is normally not sufficient.

EAST-GODAVARI weather forcast 30/11.2015 it will rain/

$
0
0
INDIA METEOROLOGICAL DEPARTMENT 
NWP MODELS BASED DISTRICT LEVEL WEATHER PREDICTION
ISSUED ON: 26-11-2015
VALID TILL 08:30 IST OF THE NEXT 5 DAYS

DISTRICT : EAST-GODAVARI STATE : ANDRA-PRADESH
------------------- ------------------- ------------------- ------------------- ------------------- -------------------
PARAMETERS ENSEMBLE FCST
----------------------------------------------------------------------------------------------------
DAY-1 DAY-2 DAY-3 DAY-4 DAY-5
27/11 28/11 29/11 30/11 01/12
------------------- ------------------- ------------------- ------------------- ------------------- -------------------
Rainfall (mm) 0 0 0 39 0
Max Temperature ( deg C) 28 28 28 24 23
Min Temperature ( deg C) 14 13 15 17 17
Total cloud cover (octa) 3 4 7 8 8
Max Relative Humidity (%) 90 89 80 92 85
Min Relative Humidity (%) 47 47 46 65 66
Wind speed (kmph) 004 006 010 009 010
Wind direction (deg) 96 112 67 52 177
------------------ ------------------- ------------------- ------------------- ------------------- -------------------

NOTE: -99.0 ........ NO DATA

kakindada weather prediction

TimeTemp.Feels LikeDew PointHumidityConditionsPrecip.Liquid Precip.WindCloud CoverPressure
6:00 am23 °C23 °C22 °C95%ClearClear0% 0 mm 0 km/h NNE15%1012hPa
7:00 am25 °C25 °C22 °C86%ClearClear0% 0 mm 3 km/h NE13%1012hPa
8:00 am26 °C29 °C22 °C81%ClearClear0% 0 mm 5 km/h ENE11%1013hPa
9:00 am25 °C25 °C23 °C86%ClearClear0% 0 mm 0 km/h E9%1013hPa
10:00 am27 °C31 °C22 °C72%ClearClear0% 0 mm 8 km/h E13%1013hPa
11:00 am28 °C31 °C22 °C69%ClearClear0% 0 mm 10 km/h E13%1012hPa
12:00 pm29 °C33 °C23 °C69%ClearClear0%0 mm 0 km/h E18%1012hPa
1:00 pm27 °C30 °C22 °C70%ClearClear1%0 mm 11 km/h ESE23%1011hPa
2:00 pm27 °C29 °C21 °C71%ClearClear2%0 mm 11 km/h ESE21%1010hPa
3:00 pm29 °C33 °C23 °C67%ClearClear2%0 mm 0 km/h ESE14%1010hPa
4:00 pm26 °C28 °C21 °C78%ClearClear3%0 mm 8 km/h ESE25%1010hPa
5:00 pm24 °C27 °C22 °C82%ClearClear3%0 mm 8 km/h ESE25%1010hPa
6:00 pm27 °C29 °C22 °C77%ClearClear3%0 mm 0 km/h ESE24%1011hPa
7:00 pm23 °C25 °C22 °C89%ClearClear3%0 mm 8 km/h ESE24%1012hPa
8:00 pm23 °C24 °C22 °C91%ClearClear4%0 mm 8 km/h E28%1013hPa
9:00 pm25 °C28 °C22 °C85%Partly CloudyPartly Cloudy4%0 mm 0 km/h E30%1013hPa
10:00 pm23 °C24 °C22 °C92%Partly CloudyPartly Cloudy4%0 mm 8 km/h E40%1013hPa
11:00 pm23 °C24 °C21 °C92%Partly CloudyPartly Cloudy4%0 mm 6 km/h ENE31%1013hPa


KVK Raju (born November 28, 1928), whose surname is Kanumuri, was a first generation technopreneur born in a humble agricultural family in Andhra Pradesh.

$
0
0

 http://dramarnathgiri.blogspot.in/2015/03/late-shri-kvk-raju-founder-of-nagarjuna.html

K. V. K. Raju

From Wikipedia, the free encyclopedia
KVK Raju (born November 28, 1928), whose surname is Kanumuri, was a first generation technopreneur born in a humble agricultural family in Andhra Pradesh. He was the founder of the Nagarjuna Group of companies. He was born in a small village at Ai Bhimavaram in West Godavari District, Andhra Pradesh. He belonged to a family which has played a part in the struggle for political freedom in India. [1]

Contents

Early life

He was born to Shri Kanumuri Venkata Narasimha Raju a Landlord and Shrimati Subbamma, a pious lady. KVK Raju had his elementary education in a local school during 1933-38. he passed Secondary School Leaving Certificate Course from Sri Rama Krishna Mission School, Tanuku in 1945. He was the first batch of Intermediate in 1945-46 at West Godavari Bhimavaram (WGB) College, subsequently renamed D.N.R College.
During 1947-49, KVK Raju studied B.Sc course in Banaras Hindu University at Varanasi and later he joined the Madras Institute of Technology at Choromepet, Madras and did Automobile Engineering. He went on to complete his Master's in Mechanical and Industrial Engineering from Michigan State University and the University of Minnesota, USA.

Work life

After a short stint in American he returned to India and worked for short periods at CaltexOil Refinery, Orient General Industries and Associated Electrical Industries.
Finally, he joined Union Carbide of India and worked with them for 17 years at various places - Calcutta, Madras, Visakhapatnam and Hyderabad. While working with Union Carbide, KVK Raju's deep-rooted urge to serve society through industry impelled him to start out on his own.
He started the Nagarjuna Steels Limited in 1973. Nagarjuna Group is a dream willed into reality by its visionary Founder Shri KVK Raju. The Group has since then become a diversified conglomerate with an asset base of 3.5 billion dollars.

Achievements

A recipient of various awards for his outstanding contribution to the industry and society, KVK Raju was a firm believer in the adage "practice what you preach". A self-made man KVK Raju practised simple living and high thinking. He dreamt big and worked with an unstinted focus of mind and body to make his dreams come true. KVK Raju was a visionary with firm belief in his mission to serve society through industry. It is this belief, which continues today to be the guiding light of Nagarjuna Group.

See also

References


External links

biography on group page
biography on company page

CONGRATULATION -Iffco's Rakesh Kapur new Vice-Chairman of IFA

$
0
0

Iffco's Rakesh Kapur new Vice-Chairman of IFA

Press Trust of India  |  New Delhi 
Fertiliser cooperative Iffco's Joint Managing Director Rakesh Kapur has been elected as Vice-President of the Paris-based International Fertilizer Industry Association (IFA) for two years.

IFA has 540 Members covering 80 countries.
ADVERTISING

Kapur, an ex-IRS officer who has been with Iffco for the last 15 years, is also Chairman of the Fertiliser Association of India (FAI).

He will also hold the post of Chairman of IFA's finance committee. Besides Kapur, there are only two other members from South Asia on the board of IFA.

IFA's technical symposium is scheduled to take place in March next year in India.

Recently, Iffco in partnership with Japanese company Mitsubishi Corp forayed into the agrochemical sector and has rolled out 18 products with an aim to achieve Rs 130 crore turnover by March 2017.
Viewing all 9469 articles
Browse latest View live