Quantcast
Channel: EHSQL Greenko -AMGreen Group (Env-Energy ,Health,Safety, Security , Social Ac. Quality-Lab) Tec.Ser.

Viewing all 9450 articles
Browse latest View live

Weather Report and Forecast For: Kakinada Dated :Nov 10, 2015

$
0
0
Local Weather Report and Forecast For: Kakinada    Dated :Nov 10, 2015
Kakinada
Past 24 Hours Weather Data
Maximum Temp(oC)29.4
Departure from Normal(oC)-2
Minimum Temp (oC)22.4
Departure from Normal(oC)-1
24 Hours Rainfall (mm)8.6
Todays Sunset (IST)17:27
Tommorows Sunrise (IST)06:04
Moonset (IST)17:22
Moonrise (IST)05:31
Today's Forecast:Sky condition would be Generally cloudy. Rain/thundershowers would occur.Maximum & Minimum temperatures would be around 29 and 24 deg.cel respectively.
Date Temperature ( o C ) Weather Forecast
Minimum Maximum
11-Nov 24.0 29.0 Mainly or Generally cloudy sky with possibility of rain or Thunderstorm
12-Nov 24.0 30.0 Mainly or Generally cloudy sky with possibility of rain or Thunderstorm
13-Nov 23.0 31.0 Mainly or Generally cloudy sky with possibility of rain or Thunderstorm
14-Nov 23.0 31.0 Partly cloudy sky with possibility of rain or Thunderstorm
15-Nov 23.0 31.0 Partly cloudy sky with possibility of rain or Thunderstorm
16-Nov 23.0 31.0 Partly cloudy sky with Thundery development


NDIA METEOROLOGICAL DEPARTMENT 
NWP MODELS BASED DISTRICT LEVEL WEATHER PREDICTION
ISSUED ON: 10-11-2015
VALID TILL 08:30 IST OF THE NEXT 5 DAYS

DISTRICT : EAST-GODAVARI STATE : ANDRA-PRADESH
------------------- ------------------- ------------------- ------------------- ------------------- -------------------
PARAMETERS ENSEMBLE FCST
----------------------------------------------------------------------------------------------------
DAY-1 DAY-2 DAY-3 DAY-4 DAY-5
11/11 12/11 13/11 14/11 15/11
------------------- ------------------- ------------------- ------------------- ------------------- -------------------
Rainfall (mm) 12 3 0 0 0
Max Temperature ( deg C) 22 25 30 30 30
Min Temperature ( deg C) 19 16 16 14 14
Total cloud cover (octa) 8 6 4 4 5
Max Relative Humidity (%) 89 80 79 83 86
Min Relative Humidity (%) 77 56 41 39 38
Wind speed (kmph) 009 007 007 003 004
Wind direction (deg) 75 87 91 86 58
------------------ ------------------- ------------------- ------------------- ------------------- -------------------


Tropical Cyclone Megh

Tropical Cyclone Megh


EHSQ OF DM PLANT

$
0
0


De-mineralization plant is employed for removal of minerals or dissolved salts from the water. Salts on dissolving dissociate into electrically charged particles called ions: for example common salt  will be split into sodium ion (a positively charged ion or cation) and chloride (a negatively charged ion or an anion). If such a solution is brought into contact with a suitable ion exchange material (called resin), some ions from the solution are taken up by the resin and an equivalent number are transferred from the resin to the solution. Ion exchange is thus a reversible interchange of ions between a liquid and a solid.
A simple Demineralization Plant consists of two beds of chemically treated resin beads operating in series. The first column- cation exchanger- converts the dissolved solids in the raw water to the equivalent acids; these acids are removed as the water passes through the second column- anion exchanger. The final product from this process consists essentially of  pure water. When exhausted, the cation exchange resin is regenerated with acid and the anion exchange resin with alkali.
In essence the DM plant comprises of  resin vessels with charge of strong cation and anion resin; control-panel encompassing a conductivity measurement and alarms, etc; acid and caustic injection facility from bulk, semi-bulk or carboy containers.
The high-purity water from a demineralization plant is typically used as feed water for high pressure boilers in many industries; as wash water in computer chip manufacture and other micro-electronics manufacturing processes, as pharmaceutical process water, and any process where high-purity water is a requirement. DM water is used as process water in the manufacture of chemicals and fertilizers, food products such as soft drinks, automobiles for rinsing of parts, textiles, etc.
Two-bed INDION DM plants are made in all sizes, from small portable units for laboratories to large multi-stream installations for Thermal power stations, refineries, petrochemical and steel plants.
Why are there numerous types of resins used in demineralization plants?                                               .
The type of resinsemployed and selected depends on numerous factors: Treated water quality required- If silica removal is not required, anion exchange resin used  in two- bed  DM plants is usually INDION 850  weak base anion resin. If silica level of 1.0 ppm can be tolerated, then INDION N-IP strong base Type -2 resin is offered. When water free from silica is required, the anion exchanger is charged with INDION FF-IP strong base Type -1 anion resin.
  • Input water quality
    Presence of organic foulants- In cases where water has high level of organic foulants such as humic and fulvic acids occurring in natural surface waters, Macroporous resins such as INDION 810- Type 1strong base resin are better suited for the application than INDION FF-IP
  • Flow through plant required
  • Considerations of minimization of operating costs in terms of regenerant chemical consumption: In order to  reduce regenerant chemical consumption in large plants, INDION 850 resin (which is very efficient for removal of strong acids such as HCl and H2SO4 with minimal requirement of alkali for regeneration) is used in combination with INDION FF-IP strong base resin which is best suited for removal of weak acids such as carbon dioxide and silica from water
What is co-current flow regeneration?                                                                                                 .
The regeneration is usually carried out in three steps. Firstly, the ion exchange column is backwashed with an upflow of water. The pressure vessel has about 50% free space above the resin bed (known as free board). This free space allows removal of any entrained solids, and re-classification of the resin bed by backwashing. Backwashing also relieves bed compaction. Secondly, a predetermined amount of acid or alkali is injected into the column in a downward direction (same direction as the service flow or co-current) to displace sodium/calcium/magnesium in the cation exchanger and chlorides/sulphates/alkalinity in the anion exchanger taken up during the service cycle. Lastly, the column is rinsed to remove excess regenerant. The entire operation takes about 3 hours for a two-bed DM plant.
With counter-flow regeneration, the regenerant acid or caustic passes in the direction opposite to the flow of water during  the service cycle. With counter-flow regeneration, the fresh regenerant  enters  at the bottom of the resin bed and passes in an upward direction (opposite to the downflow direction during service cycle- or counter-current). Hence, bottom layer of the resin bed is always in highly regenerated condition. This means lower leakage or slip of  ions during the service cycle producing better quality of treated water than the co-current method.
What is mixed-bed Demineralization?                                                                                                  .
The mixed bed is a single column of  INDION 225 cation exchanger and INDION FF-IP anion exchanger  mixed together. Water passing through the column comes into contact with these materials and is subjected to almost infinite number of demineralizing stages. Thus demineralized water of extreme purity is produced.
As with two-bed demineralizers, mixed bed units are regenerated with acid and alkali: but the ion exchange resins must be separated before this can be done. Bed separation is accomplished by backwashing: this carries the lighter INDION FF-IP resin to the top of the bed and the heavier INDION 225 sinks to the bottom. Two completely separated layers are thus formed, into which the acid and alkali solutions and rinse water are introduced through specially designed distributors. After regeneration, the two resins are mixed with compressed air.
Normally mixed bed unit treats water from the two-bed DM plant that is already of high purity and their ionic load is low. They can consequently be operated at high flow rates, and are of relatively smaller size.
What is the quality of the treated water from a demineralization plant?                                                 .
Electrical conductivity is used to express the purity of demineralized water. Depending on the application pH and/or reactive silica in DM water may also be specified as parameters to measure the purity of DM water.
The quality of the water depends on the type of scheme used:
Cation-Anion-Polishing Mixed Bed
For standard plants our guarantees are as follows:
1) Conductivity 0.1 micromhos /cm-1.0 micromhos/cm. at 25°C (We guarantee conductivity of 0.1 micromhos/cm in  very large projects only)
2) Sodium 0.01 mg/l  - pH: 7 +/- 0.2
3) Reactive silica 0.02 mg/l -0.05 ppm
Cation-Anion (Counter-Current Regeneration)
For standard plants our guarantees are as follows:
1) Conductivity 0.5 to 1.0 µS/cm at 25°C- 30 micromhos/cm  (We guarantee conductivity less than 10 micromhos/cm in large projects only)
2) Sodium 0.05 to 0.1 mg/l -  pH: 7.5 - 9.0
3) Reactive silica 0.025 mg/l - less than 0.5 ppm (with FF-IP we  can guarantee less than say 0.3 ppm)
Cation-Anion (Co-Current Regeneration)
With typical co-current regeneration, the outlet quality will depend on the regenerant applied, resin employed and raw water quality
1) Conductivity 5 to 30 µS/cm at 25°C- conductivity can be upto 2 to 5 % of conductivity of raw water
2) Sodium 0.5 to 3 mg/l
3) Silica 0.1 to 0.3 mg/l - less than 1.0 ppm
How do I size a demineralization plant?                                                                                               .
For the sizing of a demineralization plant, a good in-depth water analysis is normally required which gives the breakdown of total anions and total cations and any potential organic foulants. The final water quality specification, as well as flow rate and water used per day is required.
The alkalinity or bicarbonates and carbonates present in raw water appear as carbonic acid or dissolved carbon dioxide at the outlet of cation exchanger. Weak base anion resin such as INDION 850 does not remove weak acids such as carbon dioxide or silica. The demineralized water is therefore passed through a degassing tower for removal of carbon dioxide or CO2. The tower, made of rubber-lined steel is filled with packing rings through which the demineralized water percolates. Low pressure air introduced at the bottom of the tower scrubs out CO2, and the degassed water collects in a sump beneath the tower.
How is conductivity measured?                                                                                                            .
All INDION DM plants are provided with conductivity indicators that have two basic elements: a conductivity cell with electrodes of special design between which demineralized water flows and a sensitive milliammeter for measuring the current passing between the electrodes. This current is proportional to conductivity of the water.
                                                                                                                                                          .
Defects
Causes
Remedies
a. Increase in ionic load
b. Flow recorder defective
c. Insufficient chemicals used
d. Resin dirty
e. Plant being used intermittently
f. Channelling in bed
                                                                       g. Resin fouled
                                                                         h. Resin deteriorated
i. Resin quantity insufficient in unit
Check by analysis
Check
Check
Give prolonged backwash
Avoid this
Check and ensure uniform distribution /collection
If cation, give HCl wash; if anion, resin give alkaline brine treatment
Check and replace charge
Check and top up
a. Cation exhausted
b. Anion exhausted
c. Mixed bed exhausted
d. MB resin not in uniform mixed state

e. Some valves like backwash leaking
f. Na slip from cation high


g. SiO2 slip from anion high


h. Unit idle
i. Unit not sufficiently rinsed
j. Excessive/low flow rate

k. Channelling

l. Resin fouled
                                                                       m. Resin deteriorated
Check
Check
Check
Repeat air mix and rinse
                                                       Check
Check raw water analysis; change in Na/TA and SiO2/TA ratio; use more chemicals
Check
Rinse to satisfactory quality
Adjust to between unit min/max flow rate
Check and ensure uniform collection/distribution
Check resin and give alkaline brine/ HCL treatment
Check resin and replace
a. Resin not separated during backwash properly

b. Air mix not proper
c. Final rinse not proper
d. Some valves may be leaking and contaminating the treated water
Give extended backwash after exhausting the bed
Repeat
Repeat
Check and examine
High residual CO2 from degasser
a. It can be due to choked suction filter of degasser air blower
b. Improper air flow to the degasser

c. Degasser blower not in operation
d. Air seal not fitted/broken resulting in short circulating of air
Check and clean filter

Check damper, speed of blower, discharge pressure
Check and operate blower
Check and replace fitting
a. Flow rate too high
b. Unit exhausted
c. Backwash valve passing
d. Anion resin organically fouled
e. MB air mix not satisfactory
f. Acid/alkali pockets formed in unit
Increase flow rate
Regenerate unit
Check and rectify
Give alkaline brine treatment
Carry out air mix once again
Faulty design check and rectify. Temporarily backwash (followed by air scour if MB) and rinse again
a. Choked valve and suction strainer of pump
b. Cavitation in the pump
c. Low inlet pressure
d. Distribution or collecting system choked
e. Resin trap at outlet choked
f. Control valve shut due to low off-take
Check
Check
Check-pump
Check
Check and clean
Increase off-take
Pressure drop across the bed increasing day by day
a. Defective valves
b. Packed resin bed and resin fines present
c. Collecting system choked
d. Pressure gauge defective
Check
Give extended backwash with open manhole and scrap off fines from top surface of the resin
Check, repeat backwash
Check and rectify/ replace
Flooding in degasser
a. Very high air flow rate

b. Packed tower chocked due to dirt or broken packing material
Reduce air flow rate by adjusting damper
Open and check
Resin being lost
a. Excessive backwash pressure

b. Faulty collecting system
c. Inlet strainer damaged
Check inlet pressure and reduce if necessary
Examine same for breakage
Check and replace
Ejector not working
a. Low power water pressure
b. Air lock in the unit
c. Choked or defective valves
d. Ejector nozzle may be choked
e. Too much back pressure from the unit

f. Bulge in pipe lining
Check
Backwash & open air release
Examine and rectify
Check
Check for chokage of collecting system; passage of inlet/outlet valves
Check and rectify
Incorrect reading rota-meters
a. Chocked orifice lines/orifice
b. Dirty glass and float
Check and clean
check and clean
Improper reading from flow recorder integrator
a. Choked impulse lines/orifice
b. DP transmitter requires recalibration
c. Leakage in signal tube between transmitter and panel
d. Low air pressure for DP transmitter or recorder
Check and clean
Recalibrate
Check
                                               Check
Level electrodes system for measuring and dilution tank not functioning properly
a. Improper contact between electrodes and control
cabling
b. Shorting of the two electrodes due to moisture or
any foreign material
c. Improper working of the level controllers
Check contact and rectify
                                                     Check and dry the contacts of moisture and dirt
Check
Leakage from acid injection/unloading/transfer pumps
a. Improper adjustment of the mechanical seal
b. Low strength of sulphuric and presence of ferrous sulphate
Check and adjust
Check concentration and take appropriate action
Corrosion in concentrated acid tanks and lines
a. Low concentration of sulphuric acid
b. Lining of HCl tank/pipe line damaged
Check silica gel breather in acid storage tank and replace silica gel charge if exhausted
Rectify
a. Defective solenoid valves
b. Leakage in airline from solenoid valve to the respective control valve.
c. Improper contact of micro switch giving false indication to panel
d. Fused mimic lamp giving false indication to the panel
Check
Check
                                               Check
                                               Check
a. Defective relays in the control circuit
Check and replace relays
Solid state programme not functioning properly
a. The controller can be kept in "hold" due to the reasons explained under operation
b. Improper operation of the controls for the controller
c. Defect in the inside of the controller
Remove conditions which cause "hold" of controller
Press test switch & check the complete cycle
Check the instruments thoroughly from inside. Meanwhile, operation may be continued by using bypass toggle switches

Climate change threatens 55 million people in India's coastal areas: Report

$
0
0

Climate change threatens 55 million people in India's coastal areas: Report

Climate Change
Environment ministers extended until 2020 the Kyoto Protocol, which obliges about 35 nations to cut their greenhouse gas emissions.
WASHINGTON: Climate change threatens nearly 55 million people in India's coastal areas and could lock in enough sea level rise to submerge land currently home to more than half a billion people globally if the temperature spikes by 4 degrees Celsius -- humanity's current trajectory.

Homes of 55 million people in coastal areas of India are likely to be submerged in sea with a 4 degrees Celsius global increase in temperature, warned a new report published on Monday in Climate Central -- a US-based non-profit research and journalism organisation.

It warned that a 4 degrees Celsius increase in temperature could submerge a whopping 145 million in China.

The findings comes just weeks ahead of a UN climate summit in Paris from November 30 to December 11. The objective of the summit is to cap the rise in Earth's temperatures to 2 C above pre-industrial levels.

Achieving the two-degree goal remains a serious challenge.

"A 4C warming scenario could lock in enough sea level rise to submerge land inhabited by half or more of today's population in Shanghai and Shantou, China; Haora (Howrah), Calcutta and Mumbai, India; Hanoi, Vietnam; and Khulna, Bangladesh," it said.

The report, however, said that if the increase in global temperature is managed to 2 degrees - the target set by the international community - this man-made calamity could be considerably reduced.

If the world temperature rises by 2 degrees Celsius, homes of 20 million people in India would be submerged in sea while the figure is expected to be 64 million in China.

China has the most to gain from limiting warming to 2 degrees Celsius.

Carbon emissions causing 4 degrees Celsius could lock in enough sea level rise to submerge land currently home to 470 to 760 million people, the report said.

It also showed that aggressive carbon emissions cuts resulting in 3.6 degrees Fahrenheit warming -- equivalent to 2 degrees Celsius -- could bring the numbers down to 130 million.

According to the report, China - the world's leading carbon emitter - also leads in coastal risk, with 145 million people living on land ultimately threatened by rising seas if emission levels are not reduced.

Twelve other nations each have more than 10 million people living on land at risk, led by India, Bangladesh, Vietnam, and Indonesia. The United States is most threatened outside of Asia, with roughly 25 million people on implicated land.

Meeting the 3.6F goal would cut exposure by more than half in the US, China, and India, the world's top three carbon emitters, as well as in many other nations.

Know the difference between Cardiac arrest, Heart attack and a stroke. It might save a life someday.

$
0
0

Know the difference between Cardiac arrest, Heart attack and a stroke. It might save a life someday.

Learn-what-differentiates-Cardiac-arrest-Heart-attack-and-a-stroke.-It-might-save-a-life-someday.
Cardiac arrest, heart attack and stroke are three very distinct life-threatening occurrences, but one can differentiate between them on the basis of their symptoms and the period for which they affect a person.
But if you don’t know the difference between the three, it could cost someone’s life as people who are most susceptible to them often overlap their meanings. Knowing even the basic difference between the three can be a matter of life and death for some person and it is a basic necessity to know it in today’s world.
Here’s how you can easily learn about the differences between a heart attack, cardiac arrest and a stroke.
Heart Attack
It is a problem of supply of blood to the heart itself.
A heart attack is usually caused by the blockage in a blood supplying artery whose job is to supply blood to the heart. This stops the heart from pumping blood throughout the body. The cause of this blockage can be plaque that builds up in the arteries. Another reason could be the excess of cholesterol that is derived from food that we eat and which gets deposited in the inner walls of the arteries leading to the heart.
Or it could be a blood clot that has made its way to the artery and has stopped the supply of the blood to heart and is blocking the artery.
When someone suffers from a heart attack, that person requires immediate treatment. If there is a huge amount of delay in providing the treatment, the result can be fatal.
There are many symptoms of a heart attack, mainly of which are pressure, tightness or squeezing feeling in the chest, pain that shoots up the arms, shoulders, upper back and jaw, difficulty in breathing, breaking into cold sweats and feeling nauseous.
Risk factors for a heart attack include things like age, gender, history of heart attack in the family, diabetes, high blood pressure, obesity and stress.
 Cardiac arrest
It is a problem with heart’s electrical system.
Cardiac arrest happens when the heart suddenly stops beating and that prevents supply of blood and oxygen to other vital organs in the body. It is necessary to shock the heart back into rhythm using an automated external defibrillator or death can occur within minutes and this is known as a sudden cardiac arrest.
The likelihood of survival falls 5-7% for every delay in minutes without defibrillation as discovered by the American Heart Association.
The most common cause of Cardiac arrest is a coronary heart disease. Most of cardiac arrests are caused by abnormal heart rhythms, called arrhythmia. Arrhythmia is the cause behind the heart beating at a much faster rate than it should be or at a much slower rate, both of which can be fatal.
Other causes for cardiac arrest are respiratory failure, electrocution, drowning, choking and trauma.
Though cardiac arrest comes about suddenly, without warning, here are some symptoms that include loss of consciousness, stopping of breathing and pulse, sudden drop in blood pressure, chest pains, dizziness, fatigue, palpitation and vomiting.
Risk factors for cardiac arrest are things like age, gender, family history, underlying coronary heart disease, arrhythmia history, smoking, and drug or alcohol abuse.

Stroke
Stroke is a problem regarding the disruption or severe reduction of blood supply to the brain.
Stroke happens when a part of the brain is deprived of oxygen because of the interruption or serious reduction of blood flow to the brain.
A stroke is normally caused by a blood clot that travels the bloodstream and blocks the blood vessels that lead to the brain. This blockage cuts off the blood supply to the brain. There is also another form of stroke called as hemorrhagic stroke caused by the bursting or seeping blood vessel that supplies blood to the brain. Stroke is considered as a serious medical emergency and quick treatment provided to the patient can help save the life and also prevent possible complications like paralysis or weakness in one side of the body.
Symptoms of a stroke can be abrupt onset of severe headache, dizziness, confusion, trouble in speaking, slurring of words and feeling of numbness or weakness of the face or one side of the body.
Risk factors of a stroke include things like gender, age, history of family gender, race of the person, temporary ischemic attack (TIA), diabetes, high blood pressure, smoking and consumption of drugs and alcohol.
This will help you differentiate between the three and may be help you save a life of person in need.

Weather Report and Forecast For: Kakinada Dated :Nov 11, 2015

$
0
0
Local Weather Report and Forecast For: Kakinada    Dated :Nov 11, 2015
Kakinada
Past 24 Hours Weather Data
Maximum Temp(oC)31.6
Departure from Normal(oC)1
Minimum Temp (oC)22.4
Departure from Normal(oC)-1
24 Hours Rainfall (mm)0.2
Todays Sunset (IST)17:27
Tommorows Sunrise (IST)06:04
Moonset (IST)17:22
Moonrise (IST)05:31
Today's Forecast:Sky condition would be generally cloudy. Rain/thundershowers may occur.Maximum & Minimum temperatures would be around 32 and 23 deg.cel respectively.
Date Temperature ( o C ) Weather Forecast
Minimum Maximum
12-Nov 23.0 33.0 Partly cloudy sky with possibility of rain or Thunderstorm
13-Nov 23.0 32.0 Partly cloudy sky with possibility of rain or Thunderstorm
14-Nov 23.0 32.0 Partly cloudy sky with possibility of rain or Thunderstorm
15-Nov 23.0 31.0 Mist
16-Nov 23.0 31.0 Mist
17-Nov 23.0 31.0 Mist


 INDIA METEOROLOGICAL DEPARTMENT 
NWP MODELS BASED DISTRICT LEVEL WEATHER PREDICTION
ISSUED ON: 11-11-2015
VALID TILL 08:30 IST OF THE NEXT 5 DAYS

DISTRICT : EAST-GODAVARI STATE : ANDRA-PRADESH
------------------- ------------------- ------------------- ------------------- ------------------- -------------------
PARAMETERS ENSEMBLE FCST
----------------------------------------------------------------------------------------------------
DAY-1 DAY-2 DAY-3 DAY-4 DAY-5
12/11 13/11 14/11 15/11 16/11
------------------- ------------------- ------------------- ------------------- ------------------- -------------------
Rainfall (mm) 0 0 0 0 0
Max Temperature ( deg C) 29 30 30 30 29
Min Temperature ( deg C) 15 13 13 13 13
Total cloud cover (octa) 7 5 4 7 7
Max Relative Humidity (%) 81 79 84 86 84
Min Relative Humidity (%) 45 40 37 38 40
Wind speed (kmph) 007 006 004 004 005
Wind direction (deg) 92 68 90 89 89
------------------ ------------------- ------------------- ------------------- ------------------- -------------------

imeTemp.Feels LikeDew PointHumidityConditionsPrecip.Liquid Precip.WindCloud CoverPressure
12:00 am27 °C30 °C23 °C81%Partly CloudyPartly Cloudy1% 0 mm 5 km/h NE35%1013hPa
1:00 am24 °C24 °C22 °C86%Partly CloudyPartly Cloudy2% 0 mm 10 km/h NE38%1012hPa
2:00 am24 °C24 °C22 °C87%Partly CloudyPartly Cloudy3% 0 mm 10 km/h NNE39%1012hPa
3:00 am25 °C28 °C23 °C87%Partly CloudyPartly Cloudy4% 0 mm 3 km/h NNE38%1012hPa
4:00 am23 °C25 °C21 °C87%Partly CloudyPartly Cloudy4% 0 mm 10 km/h NNE37%1012hPa
5:00 am24 °C26 °C21 °C84%Partly CloudyPartly Cloudy4% 0 mm 11 km/h NE36%1013hPa
6:00 am24 °C27 °C22 °C84%Partly CloudyPartly Cloudy3%0 mm 5 km/h NE35%1013hPa
7:00 am26 °C29 °C22 °C79%Partly CloudyPartly Cloudy3%0 mm 14 km/h NE35%1014hPa
8:00 am27 °C30 °C22 °C74%Partly CloudyPartly Cloudy2%0 mm 16 km/h NE34%1015hPa
9:00 am26 °C29 °C23 °C79%Partly CloudyPartly Cloudy2%0 mm 8 km/h ENE33%1015hPa
10:00 am29 °C32 °C22 °C66%Partly CloudyPartly Cloudy1%0 mm 19 km/h ENE33%1015hPa
11:00 am29 °C32 °C22 °C64%Partly CloudyPartly Cloudy1%0 mm 19 km/h ENE33%1015hPa
12:00 pm31 °C35 °C23 °C63%Partly CloudyPartly Cloudy1%0 mm 11 km/h ENE31%1014hPa
1:00 pm29 °C32 °C21 °C63%ClearClear1%0 mm 21 km/h ENE28%1013hPa
2:00 pm28 °C32 °C21 °C65%ClearClear1%0 mm 21 km/h ENE26%1012hPa
3:00 pm31 °C35 °C22 °C59%ClearClear1%0 mm 11 km/h ENE25%1012hPa
4:00 pm27 °C30 °C22 °C71%ClearClear1%0 mm 19 km/h E23%1012hPa
5:00 pm27 °C29 °C22 °C74%ClearClear2%0 mm 18 km/h E22%1012hPa
6:00 pm28 °C32 °C22 °C68%ClearClear2%0 mm 10 km/h E19%1013hPa
7:00 pm26 °C28 °C22 °C76%ClearClear2%0 mm 18 km/h ENE14%1014hPa
8:00 pm26 °C28 °C22 °C76%ClearClear2%0 mm 16 km/h ENE11%1015hPa
9:00 pm28 °C31 °C22 °C72%ClearClear2%0 mm 8 km/h ENE10%1015hPa
10:00 pm25 °C28 °C22 °C81%ClearClear3%0 mm 13 km/h ENE10%1015hPa
11:00 pm24 °C27 °C22 °C83%ClearClear3%0 mm 11 km/h NE11%1015hPa


Operation of Fire Extinguisher

$
0
0

Operation of Fire Extinguisher

1.0   Purpose    :       To provide a documented procedure forOperation of Fire Extinguisher.
                                                                                   
2.0   Objective  :       Operation of Fire Extinguisher
       
3.0  Scope  :   This SOP is applicable for Operation of Fire Extinguisher. 
4.0     Responsibility  :
·        Primary: Technician Engineering
·        Secondary: Manager Engineering

5.0    Procedure :
·        Foam Type Fire Extinguisher:
Ø      It should be used for fires involving solvents, oils, greases, fats, charcoals etc.
Ø      As these articles being lighter than water, will float on water and are likely to splash burning liquids on all sides.

·        CO2 Gas Type Fire Extinguisher:
Ø       This type of extinguisher can also be used for fires involving inflammable liquids such as solvents, oils, greases etc.
Ø      The only difference between foam type and CO2 type fire extinguishers must always be used in the event of an electrical fire.

·        Dry Chemical powder (DCP Type Extinguisher):
Ø       These are recommended mainly for tackling petroleum/solvents fires.
Ø         However they are suitable for gas fires

Cleaning Of Cooling Coil

$
0
0

Cleaning Of Cooling Coil

1.0  Purpose     :       To provide a documented procedure for Cleaning of Cooling Coil.
                       
2.0   Objective  :       Cleaning of Cooling Coil.
       
3.0    Scope     :   This SOP is applicable for Cleaning of Cooling Coil.

4.0     Responsibility  :
·        Primary: Technician Engineering
·        Secondary: Manager Engineering

5.0    Procedure :
·        Remove main supply fuse & affix label to “DO NOT START, MACHINE UNDER CLEANING”.

·        Switch ‘OFF’ Air Handling Unit fan & chilled water valves.

·        Remove filters from Air Handling Unit.

·        Spray decaling chemical by pump on fins of cooling coil on both sides.

·        Clean cooling coil fins by water jet at 30 Ib/in2 from both sides.

·        Check for satisfactory cleaning by looking through fins at light source at other side of coil.

First Aid

$
0
0

First Aid


1.0   Purpose                         :  To provide a documented guideline  for the first aid treatment
   in case of any accident.

2.0   Objective                      :   To provide a first aid treatment. 

3.0   Scope                            :   Employees / Visitors / workmen of agencies of ----             
                                                
4.0   Responsibility             :

  • Follow up                       :  Officer
  • Over all responsibility     :  Manager


5.0    Procedure                  :
·  Training           

Ø      First aid training shall be given to selected employees of each department.
Ø      Detail training of the first aid shall be given to some employees of the company.
Ø      The list is as follows and shall be available in each department for easy reach out
      during emergency.


                                List of trained employees
Serial No.
   Department
  Name of Trained
 employees


Format No. F/PA/001


·                The first aid box shall be numbered and   located at identified and marked 
                 positions  as following –


                                Locations of first aid box

Serial No.
  
First aid box number

Location of First aid Box


Format No. F/PA/002


·        Each first aid box shall contain following -

Contents of first aid box

Serial No.

First Aid box Contents

   Quantity


Format No. F/PA/003

·        Every Monday from Personnel department personnel or General Manager (Adm) shall 
                Review the contents of first aid box and shall replenish the required item. The   
                 Record of review shall be kept.


6.0    Reference documents 
v     List of trained employees
v     Locations of first aid box
v     Contents of first aid box
v     Review of first aid box


·        First aid box no ----------------

Review of first aid box
Date/day
Contents checked
OK/not OK
Replenishment
details
Reason for
replenishment
Reviewed
 by
Discarded
 Items
 submitted
to QA.


Format No. F/PA/004

Internal Audit check list for QC department

$
0
0

Internal Audit check list for QC department

Internal Audit check list for Production department

Internal Audit check list for Production department


Sr. No.
Check points
Observation (Yes/No)
Comments
Recommendation
Action taken by
1.       
Is the control copy of production department SOPs available?


2.       
Are the personnel having knowledge of current GMP requirements?


3.       
Are the lots of raw material properly stored?


4.       
Are the lots of raw material having proper labels of status?


5.       
Is the housekeeping maintained?


6.       
Is the weighting balance having proper tag of calibration status?


7.       
Is the balance calibration record available?


8.       
Are the calibrated standard weights available?


9.       
Is the calibration certificate available?


10.   
Is the standard weights are properly stored?


11.   
Is the reactor area cleaned?


12.   
Is the status label of reactor available?


13.   
Is the BMR requisition slip record available?


14.   
Check the calibration status of temperature gauges.


15.   
Check the calibration status of pressure gauges.


16.   
Check the status of centrifuge.


17.   
Check the cleaning of centrifuge and centrifuging area.


18.   
Check the condition of centrifuge bags.


19.   
Check the status of dryer.


20.   
Check the cleaning of dryer and drying area.


21.   
Check the calibration status of temp, Gauge of dryer.


22.   
Check the trays and trolley condition.


23.   
Check the status of sifter.


24.   
Check the cleaning of sifting area.


25.   
Check the status of multi mill.


26.   
Check the cleaning of milling area.


27.   
Check the finished product packing area.


28.   
Check the availability and stock of packing materials.


29.   
Check the temperature and humidity record.


30.   
Check the cleaning of sampling devices.


31.   
Are all the sampling devices properly stored?


32.   
Check the general cleaning and housekeeping of plant.


33.   
Check the test request slip record.


34.   
Check the personnel hygiene.


35.   
Check the safety equipments.


36.   
Check the other records.


37.   
Is ECR available?


38.   
Check the ECR.


39.   
Check the condition of reactors.


40.   
Are there work instruction labeled on all equipments.


41.   
Are records maintained for Solvent Receipt, Usage & Recovery In Plant?


42.   
Check the records of Solvent Receipt, Usage & Recovery In Plant.


43.   
Is there any training record for new employee?


44.   
Check the training record and training schedule.


45.   
Is the pipeline properly marked with directional arrows?


46.   
Is logbook of all Equipment properly maintained?


Internal audit check list for Store

$
0
0

Internal audit check list for Store

Sr. No.
Check points
Observation (Yes/No)
Comments
Recommendation
Action taken by
01
Is the control copy of store department SOPs available?


02
Is the personnel having knowledge of current GMP requirements?


03
Is the incoming raw materials entry register available?


04
Is the housekeeping maintained?


05
Is the sampling booth area cleaned?


06
Is the weighting balance having proper tag of calibration status?


07
Is the balance calibration record available?


08
Are the calibrated standard weights available?


09
Is the calibration certificate available?


10
Is the standard weights are properly stored?


11
Is the quarantine, approved and rejected area designated?


12
Are the UNDER TEST label pasted on all the incoming raw materials?


13
Are the SAMPLE label pasted on all the sampled raw materials?


14
Are the APPROVED labels pasted on all the approved raw materials?


15
Are the raw materials stored at their respective place?


16
Check the cleaning and housekeeping condition record of quarantine, approved and rejected area.


17
Are the packing materials stored separately?


18
Is the cleaning and housekeeping maintained at packing material store area?


19
Is the temperature and relative humidity record maintained for all respective area?


20
Is the approved vendor list available?


21
Is the FIFO system follow?


22
Check the production requisition slip record?


23
Check the issuance record?


24
Check the dispatch record?


25
Check the general cleaning and housekeeping of store?


26
Check the personnel hygiene?


27
Check the safety equipments?


28
Check the drum storage yard for cleaning, housekeeping and status?


29
Check the proper segregation at drum storage yard?


30
Check the other records?


Environment Minister Launches New Website on Climate Change

$
0
0
Press Information Bureau
Government of India
Ministry of Environment and Forests
12-November-2015 18:17 IST
Environment Minister Launches New Website on Climate Change

Union Minister of Environment, Forest and Climate Change Shri Prakash Javadekar has launched a new website – www.justclimateaction.org. Launching the website in Pune today, Shri Prakash Javadekar said that the website has been created especially for the purpose of putting up India’s stands and efforts till Paris Summit.  “The website includes our Intended Nationally Determined Contributions (INDCs), the appreciation received from the world over and comments on our INDCs”, he added.  Shri Javadekar also said that India has taken firm steps under the leadership of the Prime Minister, Shri Narendra Modi.  
The website focuses on bringing transparency to the entire effort. As each stakeholder brings his activity to the fore to take a billion-strong people into confidence, the website and associated social media infrastructure ensures that each citizen in the country becomes a votary for a better future.
The website brings most of its content in the form of videos that can be shared on personal social media channels. Built on a ‘break away and play’ architecture, each page, story or section can be posted/shared by viewers anywhere in the world.

Salient features of our website

·                    It contains over 300 GB of data in films, reports and pictures. The thrust is to provide rich content in the form of short films to engage the audience and retain their interest in going through all the material presented;
·                    It hosts clippings from the speeches of the Prime Minister and Environment Minister, outlining the various initiatives to curb climate change;
·                    Over 30 films on various climate change initiatives undertaken by the government and private sectors have been indexed under seven different heads in the section ‘India’s Initiatives’;
·                    The aim is to display over 100 films, sourced from various arms of the government and social sector archives in the coming week;
·                    The website offers an integrated platform to all social media channels such as Facebook, Twitter etc. It contains links to, tracks and displays the social media channels in real time;
·                    Designed to reach out to the whole of India, the device neutral platform enables browsing from all devices, including mobile phones;
·                    The INDC documents have been uploaded in full and specialized parts for convenience of users;
·                    The FAQ section provides comprehensive answers to all questions on India’s stance and initiative, raised by media personnel from across the world till date;
·                    The site also provides links to activities and initiatives of all ministries related to climate change;
·                    A coordinated plan with the Ministry of External Affairs is being worked out for joint promotion of the website to all foreign viewers in the run-up to CoP21.
There are six links at the top band of the website. The first link is on India’s INDCs. The link on Science Express takes the visitor to the respective website of the initiative. The reports section currently displays links to 4 reports published by the Ministry and also the Earth Overshoot Report by the Global Footprint Network. The fourth one is a collection of videos on India’s initiatives and goes by the same name. The Event link on the title bar will be a showcase of all the proposed side events at the India Pavilion of CoP21. The Media Centre will act as an integrated resource pool for journalists from around the world. Apart from these, there are links to FAQs, Contact etc.
The modular layout of the homepage will enable showcasing of all the latest news as new boxes on the home page. The moving ticker at the top can also list news as they come in. The current ticker starts with the PM’s message and goes on to show four other messages.
The website is an aggregator of projects of over thirty ministries and agencies that can influence and curb India’s carbon emissions. Designed to be a participative website, it aims to take along the people of the country to a greener future.

BOD, COD, TOC and TOD – sum parameters in environmental analysis

$
0
0

BOD, COD, TOC and TOD – sum parameters in environmental analysis

Dr. Werner Arts, LAR Process Analysers AG
There are about 40 million organic compounds known in the environment [1] which cannot be defined individually with considerable analytical effort and in short time. Therefore, the so-called sum parameters are used. These parameters reflect effect and material characteristics of one or more substances. The most popular sum parameter in waste water analysis are the BOD (biochemical oxygen demand), COD (chemical oxygen demand), TOD (total oxygen demand) and TOC (total organic carbon). The TOC reflects the organic pollution on the basis of a direct carbon determination. The other parameters are based on oxygen, which is required to reduce or to oxidise the samples' substances.Formation of sum parametersThe BOD (biological or biochemical oxygen demand) can be considered as the 'mother' of the sum parameters. It had been already found and defined in the 19th century [2], apparently as a consequence of the canalisation of the big cities. The canalisation had provided definitive advantages for hygiene. Waste water and refuse had started to be taken underground by channels. However, these waste water had a high oxygen demand and led to an oxygen deficiency in water bodies, into which the waste water was discharged. Hence, the oxygen content of these water decreased to zero. A higher fish mortality was the consequence. Since then the engagement with biological and biochemical oxygen demand has intensified. In the following years, further parameters have been defined.BOD, biochemical oxygen demand
The BOD indicates the content of oxygen needed to decompose organic compounds in waste water by bacteria. In most cases the special factor BOD5 is perceived as the BOD, which requires a detailed definition (5 represents the 5 days analysis time)[3][4]. For the determination of BOD5 there are nitrification inhibitors added to the samples, which suppress the degradation of nitrogen compounds. Consequently, it results in the determination of the decomposition of carbon compounds only (carbonaceous BOD, cBOD). Due to this limitation, an essential process of sewage treatment is not considered: The nitrification. Obviously, a WWTP can only be controlled and monitored reliably by total BOD measurements, instead of the determination of the insufficient BOD5. In the real sense, BOD measurements are respiration measurements. Due to their rapidity, respiration measurements are preferred for online analysis. Provided that the conditions are known, respiration measurements [mg/(l*min)] can be converted into BOD measurements [mg/l].
Due to the 5 day analysis time and the measurement of the carbonaceous BOD instead of total BOD, the BOD5 is not suitable to assess the current capacity of the waste waters' degradation by bacteria. The BOD5 is only a time-delayed information about the pollution of waste water and cannot be used for optimization or control of a WWTP. Alternatively, BOD analysers or respiration analysers can be used, which enable measurements within 5 to 60 minutes. Thus, estimations can be made promptly for the biodegradability of the waste water and its behavior in the plants.
The market is dominated by short-time respiration measurements by O2 electrodes. Due to the low oxygen solubility of the waste water, the small respirations are extrapolated to the final result by using factors.  Essentially, only the easy biodegradable substances are detected this way.
Alternatively, LAR AG provides an online respirometer that operates like a miniature waste water treatment plant: The BioMonitor. This BOD analyser degrades nitrogen and carbon compounds in special waste water cascades, so that the significant total BOD is determined. Due to the multi-stage cascade structure also difficult to degrade components are reliably detected. The oxygen required for the degradation is measured by an O2 sensor. Especially advantageous is the use of the plant's activated sludge, whereby the conditions at the WWTP are simulated reliably.
COD, chemical oxygen demand
The COD value has been developed analogically to the BOD measurement. Since there are many organics which are rather hard or not possible to decompose biologically, a parameter has been defined indicating the amount of oxygen which would be needed when all organic ingredients would be oxidised completely. As, according to the name, the oxidation takes place chemically, the chemical oxygen demand can only be defined indirectly. A chemical oxidant is added to the sample in question, the consumption of which is then determined. The internationally dominant method today is the so-called 'Dichromate' method [5][6] which is characterized by the acidification of the sample with sulphuric acid and the addition of silver sulphate. To avoid false measurements in chloride-containing samples, the chloride must be masked by mercuric sulphate first. Due to the application of hazardous chemicals and having an analysis time of 2 hours the method is not suitable for online use.
TOD, total oxygen demand
According to its name, this parameter defines the total oxygen demand of the water sample. It is based on the same principle as the COD. Correspondingly, this parameter has existed already for over 40 years. However, it fell into oblivion in Germany. In contrast, the parameter TOD has been standardized as a reference parameter for the assessment of organic pollution in water in the US.
To define the TOD the sample is thermally oxidised in an oven and the emerging oxygen is measured directly in the carrier gas by a NDIR detector. The TOD value can be affected by inorganic compounds. However, these influences are generally very small and thus enables a mathematically compensation. The parameter is particularly suited for the correlation with COD and BOD, since inorganic carbons do not affect the correlation and the non-carbonaceous BOD (nitrogen compounds) are also considered. Due to the similarities of the determination of the TOC, the TOD is well suited for online monitoring.
Overview TOC components
TOC, total organic carbon
The content of TOC in water also reflects the organic contamination. As the name of the parameter already suggests, it is supposed to and has to detect the total organic carbon of the sample. Therefore, the inorganic carbon, literally carbon dioxide dissolved in water and its dissolved ions, have to be excluded from the sample (see Fig. 1).
Generally, the determination of TOC is done by thermal or wet chemical oxidation, so that CO2 is formed, which is subsequently measured by a NDIR detector. TOC measurements are well suited for online measurements since its provides fast and meaningful results depending on the function of the process analyser. The TOC takes a special position in well-known regulatories.
Correlations between COD and TOC
Conventional COD methods are based on the principle of the dichromate oxidation, so that often customary environmental and safety conditions are not met. Furthermore, the method is difficult to implement for the online operation. This leads to an increased tendency to replace the COD by TOC. The background for the legitimate concern is based partly on the ignorance of the TOD method.
Correlations between TOC and COD are defined in the German waste water ordinance (AbwV) and can be determined for each substance. Of course, using such measurements, correlation factors for unknown mixtures can also be detected. However, to be able to use such a factor with online measurements, it is required that the water and its mixture of substances does not change in their composition.
Stating danger, as well as the poor automation of the COD method as main reasons for replacing it with TOC, then in the first instance, according to our knowledge today, the TOD method should be of particular relevance. The technical complexity of a TOD analyser complies with the TOC analyser but without any analytical problems evolved from the inorganic carbon. The analysing times are appropriately similar, the results are present within a few minutes, and additionally, both parameters can even be realised with only one device.
Importance of Sample Preparation
Sample preparation is a crucial criterion for the accuracy and reliability of measuring results. Hence, particles which contain organic carbon should be considered during the measurement [8]. Other particles that do not contribute to the sum parameters, such as sand, may be neglected in the sample preparation.
The LAR FlowSampler is an optimal sampling system that sucks the sample through a stainless steel needle, against the main flow direction, into the analyser. On respecting predetermined specifications the FlowSampler separates big and heavy particles resulting in a sample, which corresponds up to 98% to an expert grabbed sample.
QuickTOCultra with robot-guided injection module – an analyser act as a laboratory
Application-specific measurement systems
The continuous monitoring of various water presents huge challenges for the online measurement. In general, the following rule applies: The more diverse the application, the more different are the requirements for the analysis system.
Common products can only be adjusted or be equipped with modules and multiple furnaces. Often, the second reactor is used for security if the first one does not work or has been clogged by salts. Other analysers are fitted with homogenisers, but due to their low rotation speed these devices work like a sieve.  Instead of putting the sample into a homogeneous condition, particles are filtered out by this step – even though these particles may contain important components. Alternatively, with its Quick-series LAR AG provides specialized analysers that are designed for the applicative requirements of different applications. Thus, the use of a second reactor is superfluous because high salt concentrations can be treated easily with the high-salt option, that enables the handling of salt concentrations up to 30% sodium chloride (NaCl). Depending on the sample matrix, LAR's analysers differ in their injection system.
QuickTOCpurity with loop injection designed for low ranges
For samples with a high particle density and up to 50,000 mg/l TOC, a robotic injection system is used. Here, the amount of tubes and wetted components has been minimized, so the raw waste water samples can be supplied without filtration to the analyser. For samples with low particle density, a loop injection system is used which seals the sample against contamination from the ambient air. In general, the oxidation process of LAR's high temperature analysers is equal – the LAR ultra high temperature oxidation at 1,200°C. At this temperature, all carbon compounds are completely oxidized. Therefore, the use of catalysts is unnecessary.
In many years of close dialogue with customers, an extremely versatile range of products has been developed, which optimally fulfil the requirements of many applications – the LAR Quick-series.
 
[1] Wikipedia: Organische Chemie, de.wikipedia.org/wiki/Organische_Chemie, Aufruf vom 25.07.2013.
[2] Royal Commission on Sewage Disposal, 1898.
[3] DIN EN 1899-1, Ausgabe 1998-05: Bestimmung des Biochemischen Sauerstoffbedarfs in n Tagen nach dem Verdünnungsprinzip (Verdünnungs-BSBn).Wasserbeschaffenheit - Bestimmung des Biochemischen Sauerstoffbedarfs nach n Tagen (BSBn) – Teil 1: Verdünnungs- und Impfverfahren nach Zugabe von Allylthioharnstoff.
[4] DIN EN 1899-2, Ausgabe 1998-05: Wasserbeschaffenheit - Bestimmung des Biochemischen Sauerstoffbedarfs nach n Tagen (BSBn) – Teil 2: Verfahren für unverdünnte Proben.
[5] DIN 38409-41, Ausgabe 1980-12: Deutsche Einheitsverfahren zur Wasser-, Abwasser- und Schlammuntersuchung; Summarische Wirkungs- und Stoffkenngrößen (Gruppe H); Bestimmung des Chemischen Sauerstoffbedarfs (CSB) im Bereich über 15 mg/l (H 41).
[6] ISO 3199, Ausgabe 1975-02: Natriumchlorat für Industriezwecke; Bestimmung des Chloratgehaltes; titrimetrische Dichromat-Methode.
[7] ASTM D 6238, Ausgabe 1998: Standard Test Method for Total Oxygen Demand in Water.
[8] DIN EN 1484, Ausgabe 1997-08: Wasseranalytik - Anleitungen zur Bestimmung des gesamten organischen Kohlenstoffs (TOC) und des gelösten organischen Kohlenstoffs (DOC)

On-site regeneration of transformer oil

$
0
0

On-site regeneration of transformer oil

Regeneration of transformer oil at the transformer’s location is an important preventive measure of transformer servicing.
Transformer life time is, in essence, the life time of its insulation system. The most widely used insulation is liquid insulation (transformer oils) and solid insulation (paper, i.e. cellulose insulation). The oil provides for at least 80% of the electric strength in a transformer. Almost 85% of transformer failures are caused by damaged insulation.
Transformer oil is a good insulator when insulation paper is will impregnated: the oil increases the breakdown voltage of the insulation which it saturates. Low viscosity of the oil allows it to permeate solid insulation and dissipate heat by transferring it to the cooling system. Therefore, liquid insulation is also a cooling liquid. Oxidation stability of the oil allows it to endure high temperatures and prevent significant damage to the insulation system.
Aging or degradation of transformer oil is usually related to oxidation. As oxygen and water appear in the oil, the oil oxidizes even of other conditions are perfect. Contaminants generated by solid insulations also affect the quality of transformer oil. Reactions which occur in the oil between unstable hydrocarbons, oxygen and other catalyst, such as moisture, with such accelerators as heat, lead to oil decomposition (oxidation).
Heat and moisture, along with oxidation, act as primary accelerators of this process and are the largest threat to solid insulation. If the cooling and insulation system is serviced right, insulation system’s life time can be extended from 40 to 60 years. Unfortunately, oil oxidation cannot be entirely eliminated, however, it can be controlled and slowed by oil treatment. One of the most important transformer maintenance procedures is oil analysis scheduled at least annually. Oil analysis is indicative of the overall insulation condition.
Moisture is a combination of free water, water solved in the products of oil degradation, solved and chemically bound water (it is a part of glucose molecules and is necessary for maintaining the mechanical strength of cellulose). It is impossible to completely dehydrate cellulose insulation.
Transformer oil solves more water at higher temperatures. If the mixture of oil and water is cooled, water will settle out of the oil. The oil will permeate solid insulation, or become bound to oil degradation products. Moisture will distribute itself between the oil and the paper. However, this distribution will be uneven: paper absorbs water from the oil and retains it, in the areas of highest voltage.
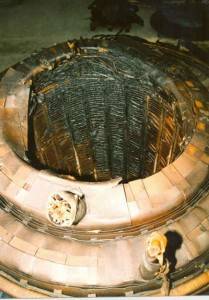
Damage to inside of coil winding stack of oil filled transformer
Contaminants are formed in the process of transformer operation. Oil decay products are acidic, and they attack cellulose and metals; the acids also create soaps, aldehyde and alcohol, which settle on the insulation, tank walls, breathing and cooling systems in the form of sludge. Sludge forms faster in a heavily loaded, hot transformer operated incorrectly. Sludge increases oil viscosity thus reducing its cooling ability, which has further negative effect on transformer life time.
Contamination also causes insulation to shrink, destroys varnish and cellulose material. It is a conductor for discharges and currents; being hygroscopic, it absorbs moisture and leads to insulation overheating. Sediment forms on the core, which increases transformer temperature.
Cellulose material is the weakest link in the insulation system. Since transformer life time is in essence the life time of its cellulose insulation, and since cellulose degradation is irreversible, contaminants must be removed immediately, until they damage the cellulose. A good maintenance program extends its life time significantly.
Normal servicing of power transformer should attain a practical life time of 50 – 75 years. However, the actual condition of insulation defines the difference of real time operation between 20 – 50 years plus the transformer life time. Experience shows that the most common cause for transformer failure is inadequate servicing and incorrect operation.
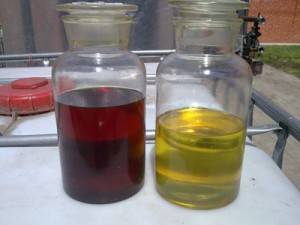
Transformer oil before and after regeneration by UVR 450/16
Transformer oil can be completely regenerated and made as good as new. Insulation oil can be used indefinitely, if it is processed regularly. The prospect of regenerating a batch of very poor quality oil should be balanced against the relatively high cost of acquiring new oil.
Removal of water and keeping the insulation dry is of utmost importance. Moisture accelerates aging. 1% of moisture in cellulose accelerates aging by one order of magnitude in comparison to 0.1% moisture content.

So, what are the main guidelines for preventive maintenance?

Purification of transformer oil, including regeneration, is a method of extending transformer life time.
The objective of this process is to remove aging product from solid insulation and oil before they damage the insulation system (insulation damage may be determined by furan compounds).
A well planned maintenance strategy aims to avoid accumulation of moisture in insulation and make sure that the transformer always operates in a clean environment.
To stop or slow the aging process of transformer insulation, the oil must be kept in the best possible condition. The following measures will help:
  • Constant control of oil condition;
  • Silica gel in the breather must be in good condition (blue). Never allow more than one third of the silica gel volume to change color to pink;
  • Repair oil leaks as soon as one is detected;
  • Start using an oil purification system for dehydration of oil to 10 ppm at most;
  • Do not add oil contaminated with moisture (if the oil was kept in an open vessel);
  • Start drying the oil as soon as moisture content exceeds 20 ppm or the breakdown voltage drops to below 50 kV;
  • Keep a close eye on the oil’s acidity and regenerate the oil when it reaches the critical level of 0.2 mg KOH/g. Best use a Fuller’s earth system with renewable sorbent (Globecore CMM-R is a good choice);
Sometimes oil should be changed (filtered, rinsed, and refilled). This procedure is best performed on site. Oil is drained form the transformer. The interior of transformer tank is rinsed with hot naphthene or regenerated oil to remove sediment concentrations; then the transformer is filled with regenerated oil.
If the transformer is rinsed only through inspection opening, only approximately 10% of the interior surface will be cleaned. In this case, a film of contaminated oil remains on most of the winding surface and the tank’s interior. Keep in mind that up to 10% of the oil in the transformer permeates cellulose insulation. The oil remaining in the insulation and the transformer contains polarized structures and can poison a large amount of new or regenerated oil.
If the top lid is removed for rinsing, approximately 60% of the interior can be cleaned. Better results can be achieved by using a Fuller’s earth regeneration system, such as GlobeCore’s CMM-R, on a live transformer.
A simple replacement of oil does not remove all sediment, which accumulates in the cooling system and between the windings. This sediment will dissolve in new oil and cause oxidation.

How to regenerate and remove contamination on site

Oil may be regenerated directly in working transformer (prior analysis indicates if such possibility exists, especially the DGA test). The oil is pumped from the tank’s lower valve to the regeneration system, where it is purified, regenerated and degassed before going back to the transformer through the transformer expansion tank. The process continues until the oil is restored and complies with standards or other specifications. If CMM-R unit is used, hot oil is regenerated by percolation through fuller’s earth, then filtration and vacuum degassing and dehydration.
The difference between regeneration and purification is that regular purification cannot remove such things as acids, aldehydes, cetones etc, solved in the oil. Therefore, simple purification cannot change the oil color from dark to light clear yellow. Regeneration, however, incorporates filtration and dehydration.
When regenerating oil, the following results may be expected:
  • Moisture content less than 10 ppm;
  • Acidity below 0.02 mg KOH/g oil;
  • Breakdown voltage of at least 70 kV;
  • IFT at least 40 dynes/cm;
  • Tan delta less than 0.003;
  • Contaminants solved or suspended in the oil are removed;
  • Oxidation stability restored;
  • Oil color changed to clear light yellow;
  • Solid insulation breakdown voltage improved.
Despite the removal of solved or suspended solid contaminants, regular regeneration cannot remove sediment. It is necessary to remove sediment if acidity of the oil is above 0.15 mg KOH/g and IFT is less than 24 dynes/cm. Sludge removal involves circulating hot oil through the transformer. The oil is heated to the point when it becomes a solvent for the sludge. If the transformer is operating, vibrations of the windings enhance the process.
Next to consider is shrinking of insulation and dehydration of transformer oil.
Solid insulation may shrink as a result of motion of loaded coil, specifically, under shock loads; shrinking may become a source of premature failure. Shrinking also comes as a result of cellulose degradation. On-site regeneration of transformer oil does not cause insulation shrinking.
Experience shows that if the transformer insulation is super-dry (up to +2% of dry weight), shrinking does not occur. The regeneration process does not aim to dry transformer insulation. It is impossible to dry the insulation within the time of regeneration. High level of dehydration requires significant time.
Moving moisture from insulation by thermal diffusion is a natural process of restoring the balance between the winding insulation and the oil. The process rate depends on the level of water diffusion through solid insulation.

Removal of sediment from transformer core

Insulation forms and accumulates in cellulose fibers. During purification, the oil is heated to the point when sediment becomes soluble in oil. The process guarantees that the solved contaminants will be removed by regeneration and oil will become clean.
Obviously, regeneration and purification is broader than simple oil restoration.

Loss of furan values

Restoration (regeneration or purification) or replacement of transformer oil destroys furan compounds, which are used to measure the degree of polymerization (insulation condition and life time). Furan analysis should be done before the process.
If transformer oil is allowed to degrade beyond salvaging without regeneration or purification, transformer life time decreases significantly. After purification, a new base line for furan compounds control is established. Future furan test must be referenced against this new base line.

Removal of aromatic compounds

Some types of aromatic compounds may have anti-oxidation properties. Most specifications require that the content of polyaromatic hydrocarbonate be equal or less than 3%. Too much aromatic compounds reduce dielectric or impulse strength and imcrease the oil’s ability to solve most of the solid insulation submerged in oil. Oxidation stability of regenerated oil (after 164 hours at 100 degrees C) was 0.006% by weight, which is lower than the highest allowable level of 0.1% by weight.
Before regeneration is started, the whole system, including the hoses, is filled with oil. Old oil and suspended contaminants accumulated in the bottom of the transformer tank are removed from the lower part of the tank. Regenerated, filtered and pure oil enters the transformer via the expansion tank above. This is done to ensure the level of oil in the transformer is unchanged. The oil freely circulates and the contaminants do not reenter the tank. Only the clean, dehydrated, degassed oil returns to the transformer.

Six Steps to Implementing a Plan

$
0
0
Six Steps to Implementing a Plan

It’s a new year and things are going to be different this year.  We spent a little time reviewing our mistakes of the past.  We are resolved – this year will be different.   We have a rock-solid plan.  New ideas, better ideas, discipline of action and a whole lot more are ready to catapult us to the vanguard of our industry.  The team brainstormed, labored and honed our direction to a finely polished point.  Like Alexander the Great, we’ll gaze out and watch the competition crumble before our well-orchestrated attack.  Sound familiar?
We start the year with the greatest of intentions.  Profit planning, sales territory alignment, pricing strategy, targeting and in many instances – a shiny new strategic plan.  That’s January.  Then what happens?  Well, according to Execution: The discipline of getting things done by Larry Bossidy former CEO of Honeywell and business advisor Ram Charan, the typical executive team spends less than four hours making sure the plan works.  Somehow they let planning replace execution in their consciousness. 
This isn’t going to be a lengthy treatise topping the joys of cooking up a plan.  If you don’t believe in planning, you’re probably beyond saving.  Instead, join me as we spend some time talking about how to turn that plan into results – the execution stuff.
To make this discussion real, we’ll come back to one very commonly discussed plan.  
Distributors struggle to maximize their gross margin.  Dozens of trade publication articles, consultative commentaries and presentations exist on the power of adding just one percent more gross margin.  Hundreds of plans for margin improvement can be found in the distribution community.  So, not only is this a great case study – it is real to a great many readers.  We will call this a pricing plan.
Remember this article is not about planning.  It’s about make the plan work.  Six steps to success?  Well there are other factors, but these six ideas will stack the deck in your favor. 
Step 1 – Somebody has to be responsible
If no one has the responsibility and corresponding authority to make the plan come to life, it’s damned from day one.  The adage two heads are better than one doesn’t apply here - committees are even worse.  One specific person must be responsible for seeing the plan through. 

This doesn’t mean one person has to do all of the work – most of the time this is impossible. But a single individual must be held accountable for pushing the plan forward.  Additionally, the power, judgment and authority to make the plan work need to abide with this person.  Judgment is critical - if this individual lacks the acumen to tweak the plan in accordance with changing business landscape, disaster could result.
With pricing plans, we need a single person at the helm.  They must understand selling dynamics, pricing situations and customer needs and possess the judgment factor we spoke of in the last paragraph.  The prestige and authority to stand up to the sales person pushback are a must have.  This cannot be low-level person.
Companies with ongoing success in this category appoint an executive level Pricing Czar to assume responsibility for driving the plan.  Serving as the ultimate authority in questions regarding margin and price, this person carries the full authority of the leadership team to solve disputes and handle pushback. His/her ruling is final.   
Step 2 – Develop metrics throughout the plan
It’s a long road from here to Nirvana – without measures the chances of successful completion drop off substantially.  Mid-course measures become the catalyst for revisiting the plan.  And, based on Bossidy and Charan’s observation – executives spend way too little time revisiting the plan during the year. 

Without a measure, forward progress becomes objective – a matter of conjecture – an opinion.  Opinions sway on mood, recent events and convincing arguments.  Setting milestones– holds everyone to the straight and narrow.
In a pricing plan the most obvious indicator is gross margin.  External forces like fluctuations in season, the economy and trends in commodity prices (copper, steel, oil, etc.) push us to look for additional measures - metrics lying just below the surface.  Information such as pricing exceptions, salesperson compliance to “system pricing” and margin shifts in product lines have proven to be more valuable in tracking progress.
Quite frankly, these are time consuming and difficult for the average company to sort out.  In the world of pricing process, a few thought leaders have emerged.  David Bauders and his Strategic Pricing Associates have built complex software algorithms to automate the metrics with a number of reports which inform the manager on the speed and direction of change.   Truly successful companies insist on this type of regular feedback.
Step 3 – If issues develop, understand the root causes and make adjustments
It’s not enough to know the plan isn’t working.  We’ve got to get to the root cause of the issues.  This can be derived by asking – Why, how, what?  Let’s face it every plan comes with unexpected issues.  Unanticipated conditions are part of the business environment – markets change, competitors react, suppliers fail to deliver and new technologies affect the playing field.  Rather than lamenting failure or worse yet sticking with a bad plan, we must search for the root causes of the issues.  Making wise adjustments to the plan is crucial to long term success.

Ask questions to better understand the situation– things like:

  • Why are we falling behind our milestones?
  • What has changed since we laid out our plan?
  • What must change to get back on track?
  • How can we bring other resources into the equation?
Don’t think generalities – specifics are the name of the game.  Insist on the same from your staff and coworkers.  Drill down to the root causes of the issue via investigation.
Jumping back to the real world and a pricing plan – many companies find they struggle to meet the initial goals of their plan.  On the surface, a person might just assume the competitive nature of “our business” prohibits implementation.  However, deeper drilling may uncover a host of root cause issues.  Here is a short list:

  • Perception of competitive pushback
  • Supply contracts which limit ability to change prices
  • Incorrect system data where the prices are not properly maintained
  • Packaged deals tying prices of many items together
  • Too many product combinations to manage properly
Interviews with companies who have instituted world class pricing plans indicate a willingness to attack each of these root cause issues systematically.  For instance, Industrial Supply Magazine’s Distributor of the Year, Stellar Industrial Supply conducted a series of ongoing employee meetings to combat the competitive pushback issue.  They addressed the root issue and pushed their plan over the goal line.
Step 4 – Insist on individual compliance with the plan
Are there individuals who refuse to follow the plan?  Many a great plan fails because a few dissenters stonewall the execution.  Whether done in the open or covertly underground, these must be addressed. 

Change is difficult and threatens the experienced more than the novice.  It’s not uncommon for a long-term team member to oppose some aspect of the plan.  Except in the most blatant of cases this manifests itself with half-hearted or delayed activities.  For instance, they may sheepishly try the plan once and announce failure.  This is incredibly frustrating and damaging to morale – particularly in selling situations.
In research for a new book The Target Driven Sales Process, we discovered a number of businesses who could not determine whether product introductions failed because of product design flaws or due to poorly executed product launches.  A good many of these managers noted successful salespeople who were conspicuously lacking in their ability to launch any product that falls outside the “mainstream” offering.  
In the world of planning for price improvement – measuring individual compliance appears to be vital for success.  Again referring to the work of David Bauders’ Strategic Pricing Associates; we notice easily accessible compliance reports are a tool for building results.
The Pricing Czar is provided with a report measuring compliance to the pricing strategy by division, sales group, territorial branch, product line and sales person.  The report indicates not only those not expanding the pricing process but delivers “what if” numbers - showing potential assuming various levels of compliance. 
Step 5 – Instruct, educate and coach throughout the plan
Catastrophe awaits those who ignore the human element.  Our plan – no matter how basic – must contain a mechanism for instruction of those involved in execution.  As we contemplate the education piece - let’s remember; human learning requires repetition.  There is a good reason for our repeated expose to the same TV ad or Radio jingle – Madison Avenue has this stuff down to a science.
Launch your plan with an instructional session and repeat that session at points along the way.  Provide metric related updates for the group.  And, for those who lag behind – provide personalized coaching.  Remember – good coaches motivate each person according to that person’s personality.  Some people need encouragement; others a pep talk and finally the laggards described in step 4 may need a shot of something stronger.

Switching back to our pricing plans – we find top-flight companies have well developed educational plans in place.  The very best actually launch the instruction well ahead of any other piece of their plan. 
Interestingly enough, as one explores the pricing system developed by Strategic Pricing Associates, they find a wealth of training information designed to anticipate the issues arising as a company goes through the plan.  Topics like understanding value, the buying habits of various organizations, pricing sensitivity and competitive pressures are rolled out ahead of the very first systemic change. 
This brings us to our final point in developing a plan.
Step 6 – Look to others for implementation tips
No, this isn’t a couched come-on for consulting companies.  Implementation tips flow from a number of places – basically anyone who has been down a similar road.  Folks like benchmarking partners, distributor trade associations, and business networks.  And yes… consultants sometimes fill this role.

Understanding the pot holes on the road to executing your plan eliminates a great deal of frustration and save countless hours spent reinventing the wheel.
Finally a conclusion… 
Whether we are just launching out with a new plan or mid-way through a rough and rocky implementation, following these six steps will maximize our success.  Finally, remember even the best of plans must be tweaked along the way – think implementation, adaptation, implementation.

Weather Report and Forecast For: Kakinada Dated :Nov 12, 2015

$
0
0


Local Weather Report and Forecast For: Kakinada    Dated :Nov 12, 2015
Kakinada
Past 24 Hours Weather Data
Maximum Temp(oC)31.7
Departure from Normal(oC)2
Minimum Temp (oC)22.2
Departure from Normal(oC)-1
24 Hours Rainfall (mm)NIL
Todays Sunset (IST)17;27
Tommorows Sunrise (IST)06;04
Moonset (IST)18;05
Moonrise (IST)06;21
Today's Forecast:sky condition would be partly cloudy. Rain/Thunder showers may occur in parts of city. Max & Min temp,s would be around 32/22 deg cel respectively.
Date Temperature ( o C ) Weather Forecast
Minimum Maximum
13-Nov 22.0 32.0 Partly cloudy sky with possibility of rain or Thunderstorm
14-Nov 22.0 32.0 Partly cloudy sky with possibility of rain or Thunderstorm
15-Nov 22.0 32.0 Partly cloudy sky with possibility of rain or Thunderstorm
16-Nov 23.0 31.0 Mist
17-Nov 23.0 31.0 Mist
18-Nov 23.0 31.0 Mist


Crushing strength depends upon Vacuum condition, free ammonia present in molten urea prill size distribution

$
0
0
Crushing strength depends upon Vacuum condition, free ammonia present in molten urea prill size distribution.The crushing strength of fertilizer particles differs greatly depending on the chemical composition. Mechanical resistance is the ability of the fertilizer to resist the stresses imposed upon them in the handling chain. The mechanical resistance depends on surface structure and particle strength. Dust and fines normally arise during handling from
Water absorption
• Poor surface structure and particle strength
• Low mechanical resistance
• Mechanical stresses in the handling chain
• Wear and tear from equipment (scrapers, screw feeders, grain trimmers etc) See also how to prevent dust formation.
Crushing strength is the minimum pressure needed to crush individual particles. Determining the crushing strength, or hardness, will help determine handling and storage requirements of a chosen granular product.
generally the crushing strength in our unit about 700 gm to 1.2 Kg per prill. The crushing strength of Granule Urea is about 1.3 to 3.2 kg per granual.
The crushing strength widely depends upon moisture & Prills Temp
• MAXIMUM STRENGTH 930 Gram/prill at 0.1777% Moisture.
• Below 0.12% Moisture strength reduced 698 gram/prill.
• Above 0.3% moisture strength=640 g/prill.
• At 40 deg C Maximum strength 850 g/prill
• Below 34 deg C the strength reduced 640 g/p.
• Above 66 deg C the strength reduced 640 g/p.
• OBSERVE THE ABOVE RESULT PRILLS STRENGTH IS MAXIMUM AT TEMPERATURE 40 degC & MOISTURE 0.1777%
 ===============================================
Plant. Product results with in plant battery limits remained in prescribed range but after piling in bulk storage amount of under size increases significantly. We took following actions and their results remained fruitful.
- Our Bulk storage is equipped with "Heating & Ventilation system" which was not in service since commissioning. We make it operative.
- We make operative the ventilation system installed at "Conveyor Belt Circuit" .

In the given case,bulk storage is not equipped with ventilation & heating system. In my opinion following steps will be helpful
1- Speed of Bucket:
Check the design operating speed of bucket against the load of 75 t/hr. from the reference performance curve of bucket. Operate bucket slightly above the prescribed speed keeping in view the available margin for under size in final product. This will help in improving the crushing strength of prills. This practice is also good in case of old buckets.
2- Operating Conditions Of Tower:
Operate tower under slightly pressurized conditions with out going beyond the limit where attrition of prills starts due to inter collusion. This will provide extra air cushion to prills which will facilitate the cooling phenomena and will help in improving the crushing strength of prills.
3-Conveyor Belt Circuit:
- Cover open areas (Hoods) on conveyor belt circuit in order to avoid direct contact of product with atmosphere.
- Carry out product analysis of samples being collected from different belts. This will also help in sorting out the problems in conveyor belt system affecting the product quality.
4- Piling of Product in Bulk Storage:
Make heaps/piles of final product in bulk storage after calculation of appropriate heap/pile height based on
- Crushing strength
- Angle of Repose which is generally 27 degrees for urea prills.
5- Recycling of Sweep Urea from Bulk Storage:
In case of recycling, sweep urea from bulk storage
- Make sure strainer for bucket is installed.
- Increase cleaning frequency of sweep urea tank.
============================================================================
Sequential implementation with appropriate optimization can give good results.


 If your plant is producing prills, please give the following info.
1- what is the operating speed of your prilling bucket. Low speed generally produces product
A) with low crushing strength due to insufficient heat transfer from the core of grain to its surface. Surface due to large area, cools down more rapidly while the inner core remains hot and soft which latterly causes disintegration of product.
B) initially with less amount of under size.
2- How old is the prilling bucket ?
3- Pattern of prilling bucket holes and their condition?
4- Under what conditions you are operating Prilling Tower i.e Vacuum or Pressurized?
5- What are the "ambient conditions" in the vicinity of plant?
6- How far is the bulk storage from plant?
7- Are the conveyor belts being provided with ventilation system & covered in order to avoid direct contact with open atmosphere?
8- Is your bulk storage equipped with central heating and ventilation system?
9- In what pattern, the product is stacked in bulk storage?
10- Recycling of sweep/powdered urea?

UREA -PRODCT STWARDSHIP QUALITY -LIFE CYCLE ASSESSMENT -LCA 14040 Urea CO(NH2)2

$
0
0
UREA -PRODCT STWARDSHIP QUALITY -LIFE CYCLE ASSESSMENT -LCA 14040
Urea CO(NH2)2
Favorable economics of manufacturing, handling, storage, and transportation have made urea a very competitive source of fertilizer N. Worldwide urea use is almost five times that of NH4NO3.
 Granular urea has noteworthy characteristics, including (1) less tendency to stick and cake than NH4NO3, (2) lack of sensitivity to fire and explosion, and (3) less corrosiveness to handling and application equipment. Substantial savings in handling, storage, transportation, and application costs are possible because of urea's high N content.

Biuret LEVELS
The concentration of biuret (NH2-CO-NH-CO-NH2) in urea is of special concern because of its phytotoxicity. Biuret levels of 2% can be tolerated in most fertilizer programs. Because citrus, pineapple, and other crops are sensitive to biuret in urea applied as a foliar spray, less than 0.25% biuret is recommended. Solutions made from urea containing 1.5% biuret are acceptable for foliar application on corn and soybeans. Urea high in biuret should not be placed near or in the seed row.

BEHAVIOR OF UREA IN SOILS
When applied to soil, urea is hydrolyzed by the enzyme urease to NH4+. Depending on soil pH, the NH4+ may form NH3, which can be volatilized at the soil surface, as represented in the following reactions:
CO(NH2)2 + H+ + 2H20 --> 2NH4+ + HC03-
NH4+ --->  NH3 + H+
Urea hydrolysis proceeds rapidly in warm, moist soils, with most of the urea transformed to NH4+ in several days. Urease, an enzyme that catalyzes the hydrolysis of urea, is abundant in soils. Large numbers of bacteria, fungi, and actinomycetes in soils possess urease. Urease activity increases with the size of the soil microbial population and with OM content. The presence of fresh plant residues often results in abundant supplies of urease. Urease activity is greatest in the rhizosphere, where microbial activity is high and where it can accumulate from plant roots. Rhizosphere urease activity varies depending on the plant species and the season of the year. Although temperatures up to 37'C favor urease activity, hydrolysis of urea occurs at temperatures down to 2'C and lower. This evidence of urease functioning at low temperatures, combined with urea's ability to melt ice at temperatures down to I IF (-12C), suggests that a portion of fall or early-winter-applied urea may be converted to NH3 or NH4+ before the spring. The effects of soil moisture on urease activity are generally small in comparison to the influence of temperature and pH. Hydrolysis rates are highest at soil moisture contents optimum for plants. Free NH3 inhibits the enzymatic action of urease. Since significant concentrations of free NH3 can occur at pH values above 7, some temporary inhibition of urease by free NH3 occurs after the addition of urea because soil pH in the immediate vicinity of the urea source may reach values of up to 9.0. High rates of urea fertilization in localized placement could create conditions restrictive to the action of urease.


MANAGEMENT OF UREA FERTIIIZER
Careful management of urea and urea- based fertilizers will reduce the potential for NH3 volatilization losses and in- crease the effectiveness of urea fertilizers.
Surface applications of urea are most efficient when they are washed into the soil or applied to soils with low potential for volatilization. Conditions for best performance of surface-applied urea are cold, dry soils at the time of application and/or the occurrence of significant precipitation, probably more than 0.25 cm (0. I in.), within the first 3 to 6 days following application. Movement of soil moisture containing dissolved NH3 and diffusion of moisture vapor to the soil surface during the drying process probably contribute to NH3 volatilization at or near the soil surface. Incorporation of broadcast urea into soil minimizes NH3 losses by  increasing the volume of soil to retain NH3. Also, NH3 not converted in the soil must diffuse over much greater distances before reaching the atmosphere. If soil and other environmental conditions appear favorable for NH3 volatilization, deep incorporation is preferred over shallow surface tillage. Band placement of urea results in soil changes comparable to those produced by applications of anhydrous NH3. Diffusion of urea from banded applications can be 2.5 cm (I in.) within 2 days of its addition, while appreciable amounts of NH4+ can be observed at distances of 3.8 cm (1.5 in.) from the band. After dilution or dispersion of the band by moisture movement, hydrolysis begins within 3 to 4 days or less under favorable temperature conditions. Placement of urea with the seed at planting should be carefully controlled be- cause of the toxic effects of free NH3 on germinating seedlings. The harmful effects of urea placed in the seed row can be eliminated or greatly reduced by banding at least 2.5 cm (I in.) directly below and/or to the side of the seed row of most crops. Seed placed urea should not exceed 5 to 10 lbs N/a. The effect on germination of urea placed near seeds is influenced by available soil moisture. With adequate soil moisture in medium-textured loam soils at seeding time, urea at 30 lb N/a can be used without reducing germination and crop emergence. However, in low-moisture, coarse-textured (sandy loam) soils, urea at 10 to 20 lb N/a often reduces both germination and crop yields. Seedbed moisture is less critical in fine-textured (clay and clay loam) soils, and urea can usually be drilled in at rates of up to 30 lb N/a. To summarize, the effectiveness of urea depends on the interaction of many factors, which cause some variability in the crop response to urea. However, if managed properly, urea will be about as effective as the other N sources.

Nutrient Management

$
0
0

Nutrient Management


Importance of Nutrients
Paddy requires the following essential nutrients for its normal development:

CarbonNitrogenCalcium
HydrogenPhosphorusMagnesium
OxygenPotassiumSulphur
IronZincChlorine
ManganeseBoron
CopperMolybdenum
Nitrogen, phosphorus and potassium are known as primary plant nutrients; calcium, magnesium and sulphur, as secondary nutrients; iron manganese, copper, zinc, boron, molybdenum and chlorine as trace elements or micro-nutrients. The primary and secondary nutrient elements are known as major elements.  This classification is based on their relative abundance, and not on their relative importance.  The micronutrients are required in small quantities, but they are important as the major elements in plant nutrition.

Nitrogen
K Importance
  1. Nitrogen, the most important nutrient for rice, is universally limiting the rice productivity.
  2. Nitrogen encourages the vegetative development of plants by imparting a healthy green color to the leaves.
  3. It seems that majority of Indica varieties are adapted to relatively low levels of nitrogen in the region of 25 kg N/ha.
  4. Rice plant depends mainly for its nitrogen upon the decomposition of organic matter under anaerobic conditions and in the early stages of growth takes up nitrogen in the form of ammonia which is the stable form of nitrogen in submerged soils.
  5. There are two stages in the growth of rice crop when nitrogen is most needed; early vegetative and panicle initiation stages.
  6. Fertilizing the crop during early vegetative growth promotes tillering leading to higher yield. Application at panicle initiation or early booting stage will help the plant produce more and heavier grains per panicle.

Phosphorus
  1. Phosphorus is particularly important in early growth stages.
  2. It is mobile within the plant and promotes root development (Particularly the development of fibrous roots),tillering and early flowering.
  3. Addition of mineral P fertilizer is required when the rice plants root system is not yet fully developed and the native soil P supply is inadequate.
  4. Phosphorus is remobilized within the plant during later growth stages if sufficient P has been absorbed during early growth.
  5. It also increases resistance to disease and strengthens the stems of cereal plants, thus reducing their tendency to lodge. It offsets the harmful effects of excess nitrogen in the plant.
P Importance

Potassium
K Importance
  1. Potassium enhances the ability of the plants to resist diseases, insect attacks,     cold and other adverse conditions.
  2. It plays an essential part in the formation of starch and in the production and translocation of sugars, and is thus of special value to carbohydrate-rich crops.
  3. Involves in working of enzymes.
  4. Helps in production and movement of photosynthates to sink.
  5. Helps in proper uptake of other nutrients.
  6. Influences tillering or branching of plant and size and weight of grain.
  7. Over 80 per cent of the absorbed potassium by the plant is found in straw. Need for potassium is most likely to occur on sandy soils.

Calcium
  1. Calcium combines with pectin in the plant to form calcium pectate, which is an essential constituent of the cell-wall.
  2. It also promotes the activity of soil bacteria concerned with the fixation of free nitrogen or the formation of nitrates from organic forms of nitrogen.
  3. Furthermore, it is necessary for the development of a good root system.
Ca Importance

Magnesium
Mg Importance
  1. Magnesium is an essential constituent of chlorophyll.
  2. It is usually needed by plant in relatively small quantities. Hence its deficiency in the soil is experienced later than that of potassium.

Sulphur
  1. It involve in chlorophyll production, protein synthesis and plant function and structure.
  2. Sulphur forms an important constituent of straw and plant stalks.

S Importance

Iron
Fe Importance
  1. Iron is necessary for the synthesis of chlorophyll.
  2. Mainly a problem in upland soils.

Zinc
  1. Essential for the transformation of carbohydrates.
  2. Regulates consumption of sugars.
  3. The function of zinc in plants is as a metal activator of enzymes.
  4. Deficiency of zinc in lowland rice occurs in near neural to alkaline soils, particularly in calcareous soils.
  5. Availability of both soil and applied zinc is higher in upland soil than in submerged soil.
  6. Soil submergence causes decrease in zinc concentration in the soil solution.
  7. Rice crop removes 30-40 g Zn per tonne of grain.
Zn Important

Boron
B Importance
  1. Boron facilitates the translocation of sugars by forming sugar borate complex.
  2. It involves in cell differentiation and development since boron is essential for DNA synthesis.
  3. Also involves in fertilization, hormone metabolism etc.

Copper
  1. It is an important constituent of plastocyanin (copper containing protein).
  2. It is also a constituent of several oxidizing enzymes.
  3. Important for reproductive growth.
  4. Aids in root metabolism and helps in the utilization of proteins. 
Cu important

Manganese
Mn important
  1. It is an activator of nitrite reductase and  many respiratory enzymes.
  2. It is necessary for the evolution of oxygen (photolysis) during photosynthesis.
  3. Functions with enzyme systems involved in breakdown of carbohydrates, and nitrogen metabolism.
  4. Soil is a source of manganese.

Silicon
  1. It is an important element for improving plant health and disease resistance.
  2. It has the potential to significantly decrease the susceptibility of certain plants to both biotic and abiotic diseases.
  3. Beneficial for the growth of paddy.
  4. An adequate supply of silica is essential  for paddy to give a good yield by increasing  the strength and rigidity of cells.
  5. Plant roots take up their silica as silicic acid.
  6. It is possible that the amount taken up by paddy is equal to the amount of silicic acid present in the water the roots absorb, so that the greater the amount of water transpired, the greater their uptake of silica.
Si Important
Top

Nutritional Disorders
Nutrient Deficiencies and Toxicities

Nitrogen


N Def

N Tox

LCC
Deficiency Symptoms
  1. Stunted growth and yellowish plants.
  2. Older leaves of whole plants are yellowish green. 
  3. Old leaves sometimes all leaves become light green. 
  4. Deficiency symptoms first appear at the tip and progress along the midrib until the entire leaf is dead.
  5. Tips become chlorotic. Leaves narrow, short, erect and lemon-yellowish green.

Corrective measures
  1. Do not apply large amounts of N to less responsive varieties
  2. Choose suitable plant spacing for each cultivar.
  3. Adjust the number of splits and timing of N applications according to the crop establishment method.
  4. Keep the field flooded to prevent denitrification but avoid N losses from water runoff over bunds immediately after fertilizer application.
  5. Soil application of 25 % excess of recommended N.
  6. Foliar application of Urea 1% at weekly interval till the symptoms disappear

N management in paddy with leaf colour chart (LCC).
  1. Yellowing of leaves in paddy indicates the deficiency of nitrogen, but it is difficult to decide the quantity of nitrogen to be applied based on the extent of yellowing.
  2. The actual requirement of nitrogen by the crop can be correctly assessed by leaf colour chart.
  3. The leaf colour chart consists of 6 -7 green strips, 1st  strip with light green colour and the last  strip (6th  or 7th) with dark green colour, and in between strips (2nd  to 5th) are with varying intensity of green colour.

Use of leaf colour chart
  1. Select fully opened disease free new leaf i.e. third leaf from the top as index leaf in paddy plant for assessing the leaf colour and ten leaves to be selected from ten plants in the field.
  2. Match the colour of the selected leaves by keeping the middle of the leaves on the colour strips of leaf colour chart and assess the colour intensity ( LCC value) during morning hours (8-10 am).
  3. Assess the intensity of leaf colour each time at a particular time by a particular individual.
  4. Take average of two if the leaf colour matches between two colour strips of the chart.
  5. Commence the assessment of  the leaf colour with LCC at 14 DAT in transplanted rice or 21 DAS in direct seeded rice and continue up to flower initiation/heading at an interval of 7-10 days.
  6. Critical LCC value varies with the type of paddy genotypes. LCC critical value is 3.0 in low N response cultures. In Tamilnadu LCC critical value is 3.0 in low N response cultures like White Ponni and 4.0 in other cultivars and hybrids.
  7. Assess the average LCC values of 10 leaf samples. When the average LCC value of ten leaves or when the LCC values of five or more leaves found below the critical LCC limit fixed for that genotype, then top dress nitrogen depending on the crop growth and stage.
  8. If six or more leaves read below the specified threshold value, N can be applied @ 35 kg N/ha in dry season and 30 kg N/ha in wet season per application per ha.  If the value is above the threshold value, there is no need for top dressing during that week.
 Nitrogen toxicity symptoms:

  1. Plants are dark green in colour
  2. Abundant foliage
  3. Restricted root system
  4. Flowering and seed setting may be retarded.

Nitrogen sources
 Farmyard manure, Green manures, Biofertilizers (Rhizobium, AzollaAzospirillum, Azotobacter) Castor cake, Neem cake, Urea, Diammonium phosphate, Ammonium nitrate, Ammonium sulphate.  

Phosphorus
Deficiency symptoms
  1. Plants stunted with reduced tillering.
  2. Leaves narrow, short, very erect ‘dirty’ dark green.
  3. Older leaves turn brownish red and purple colors develop in leaves.
  4. Stems thin and spindly.
  5. Poor tillering/branching.
  6. Poor root growth.

Corrective measures
  1. Application of phosphobacteria to the soil as seed coating or as seedling dip.
  2. Application on P fertilizer 15-30 kg P/ha. 
  3. Rock phosphate broadcast before flooding when soil pH is low.

Phosphorus sources:
Farmyard manure, Biofertilizers (Phosphate solubilizers) Castor cake, Neem cake,Super phosphate (single),Super phosphate (Double),Super phosphate (Triple), Basic slag, Mussori, Diammonium phosphate (SPIC), Ammonium phosphate (Gromor)

Phosphorus toxicity (Injury due to excess P application)
1. Fixed in soil – not available to plants
2. Leads to Zinc deficiency
P Def

P tox

Potassium
K Def

K tox
Deficiency symptoms
  1. Dark green plants with yellowish.
  2. Brown leaf margins and brown necrotic spots on the tips of older leaves.
  3. Rusty brown spots on the panicles and poor grain formation.
  4. Weak stem leads to lodging.

Corrective measures:
  1. Soil application of 25% excess of recommended K.
  2. Foliar application of 1% KCL
  3. Spread and incorporate the straw evenly over the field before burning. Ash from burnt straw heaps should also be spread over the field.

Potassium sources
 Farmyard manure, Castor cake, Neem cake, Muriate of potash (KCl), Potassium     sulphate

Injury due to excess K application
  1. Excess of this element tends to delay maturity
  2. Leads to calcium magnesium and iron deficiencies.

Calcium
Deficiency symptoms

  1. White or bleached, rolled, and curled tips of youngest leaves.
  2. Necrosis along the lateral margins of leaves.
  3. Old leaves turn brown and die.
  4. Stunting and death of growing points

Corrective measures:
  1. Apply farmyard manure or straw (incorporated or burned) to balance Ca removal in soils containing small concentrations of Calcium Fertilizers.
  2. Apply CaCl2 or Ca containing foliar sprays for rapid treatment of severe Ca deficiency.
  3. Apply gypsum in Ca deficient high pH soils,e.g., on sodic & high K soils.
  4. Apply lime on acid soils to raise pH and Ca availability.
  5. Apply pyrites to mitigate the effects of NaHCO3- rich water on Ca uptake.

Calcium sources:
Farmyard manure, Calcium chloride. Gypsum, dolomite, lime, pyrites, single superphosphate or triple superphosphate.

Ca def

Magnesium

Mg Def

Deficiency symptoms:
  1. Leaf chlorotic with white tips.
  2. Pale-colored plants with orange-yellow interveinal chlorosis on older leaves and later on younger leaves.
  3. Chlorosis progresses to yellowing and finally necrosis in older leaves in severe cases wavy and droopy leaves.
  4. Reduced number of spikelets and grain quality.

Corrective measures:
  1. Rapid correction of Mg deficiency symptoms is achieved by applying a soluble Mg source such as kieserite or Mg chloride.
  2. Foliar application of liquid fertilizers containing Mg (e.g.,Mgcl 22%)

Magnesium sources:
Farmyard manure, Magnesium chloride, dolomite.

Sulphur
Deficiency symptoms:
  1. Yellowing or pale green whole plant.
  2. Young leaves chlorotic or light green colored with the tips becoming necrotic.
  3. Lower leaves not showing necrosis.
  4. Leaves pale yellow.
  5. Effect on yield is more pronounced when S deficiency occurs during vegetative growth.

Corrective measures:
  1. Incorporate straw instead of completely removing or burning it. About 40-60% of the S contained in straw is lost during burning.
  2. Carry out dry tillage after harvesting, to increase the rate of sulfide oxidation during the follow period.
  3. Applying 15-20 kg S ha-1 gives a residual effect that can supply the S needed for two subsequent rice crops.

Sulphur sources:
Ammonium sulfate, Single superphosphate, Potassium sulfate, gypsum and S-coated urea.
S def

S tox

Iron
Fe Def

Fe Tox
Deficiency symptoms:

  1. Interveinal yellowing.
  2. Chlorosis of whole leaves and emerging leaves.
  3. Entire plants becomes chlorotic.

Corrective measures:
  1. Apply solid FeSO4 (30 kg Fe/ha) next to rice rows or broadcast.
  2. Foliar applications of FeSO4 (2-3% solution) 2-3 applications at 2 week intervals.
  3. Use acidifying fertilizers (e.g., ammonium sulfate instead of urea) on high-pH soils.
  4. Grow tolerant cultivars for low soil Fe availability.

Iron sources:
Soluble ferrous sulfate (20-33% Fe), ferrous ammonium sulfate (14% Fe), and iron chelates (5 to 14% Fe).

Zinc
Deficiency symptoms:
  1. Dusty brown spots on upper leaves.
  2. Stunted growth of plants.
  3. Decreases  tillering and increase spikelet sterility.
  4. Leaf base of younger leaves become chlorotic brown and blotches/streaks on lower leaves.

Corrective measures:
  1. Broadcast ZnSO4 in nursery seedbed.
  2. Dip seedlings or presoak seeds in 2-4% ZnO suspension.
  3. It is enough to apply 12.5 kg zinc sulphate /ha, if green manure (6.25 t/ha) or enriched FYM, is applied.
  4. Apply 25 kg of zinc sulphate with 50 kg sand before transplanting.
  5. Apply 5-10 kg Zn ha-1 as Zn sulfate, apply 0.5 – 1.5 % ZnSO4/ha as a foliar spray at tillering (25-30 DAT), 2-3 repeated applications at intervals of 10-14 days.
  6. Zn chelates (e.g., Zn-EDTA) can be used for foliar application.

Zinc sources:
Zinc sulfate, Zinc carbonate, Zinc chloride, Zinc chelate, Zinc oxide.

Zinc toxicity symptoms:
Excess zinc commonly produces iron chlorosis in plants.

Zn def

Zn tox

Aluminium
Al Tox
Toxicity symptoms:
  1. Orange-yellow interveinal chlorosis on leaves followed by leaf tip death and leaf margin scorch.
  2. Necrosis of chlorotic areas during severe Al toxicity.
  3. Stunted and deformed roots in susceptible cultivars.
Corrective measures:
  1. Delay planting until pH has increased sufficiently after flooding (to immobilize Al).
  2. Plant Al-tolerant cultivars (IR43, CO 37, and Basmati 370) which accumulate less Al in their foliage and take up and use Ca and P efficiently in the presence of Al.
  3. Apply 1-3 t lime/ha to raise pH.


Boron
Deficiency symptoms:
  1. White and rolled leaf tips of young leaves.
  2. Reduction in plant height.
  3. Death of growing points, but new tillers continue to emerge during severe deficiency.
  4. Plants unable to produce panicles if affected by B deficiency.

Corrective measure:
  1. Avoid excessive leaching (percolation).
  2. Apply B in soluble forms (borax) for rapid treatment of B deficiency (0.5-3 kg B/ ha), broadcast and incorporated before planting, top dressed or as foliar spray during vegetative rice growth.

Boron sources:
Anhydrous borax, Fertilizer borate, borax.

 Toxicity symptoms:
  1. Chlorosis of tips and margins of older leaves as initial symptoms.
  2. Dark brown elliptical spots on discolored areas two to three weeks later followed by browning and drying up.
  3. Necrotic spots prominent at panicle initiation.

Corrective measures:
  1. Plant B-toxicity tolerant varieties (e.g., IR42, IR46, IR48, and IR 54).
  2. Use surface water with a low B content for irrigation. 
  3. Plough when the soil is dry so that B accumulates in the topsoil. Leach with water containing a small amount of B.

B def

B Tox

Copper
Deficiency symptoms:
  1. Leaves develop chlorotic streaks on either side of the midrib.
  2. Dark brown necrotic lesions on leaf tips, Leaves often bluish green and chlorotic near the leaf tip.
  3. New leaves do not unroll and the distal parts of leaves maintain a needle like appearance.
  4. Reduced tillering and increased spikelet sterility

Corrective measures:
  1. Dip seedling roots in 1% CuSO4 suspensions for 1 hr before transplanting.
  2. Avoid overliming of acid soils because it may reduce Cu uptake.
  3. On Cu-deficient soils, apply CuO or CuSO4(5-10 kg Cu/ha at 5-year intervals) for long-term maintenance of available soil Cu (broadcast and incorporate in soil).

Copper sources:
Cupric sulfate, Cu oxide

Manganese
Deficiency symptoms:
  1. Pale greyish green interveinal chlorosis spreads from the tip to the leaf base.
  2. Necrotic brown spots develop later and leaf becomes dark brown.
  3. Newly emerging leaves short, narrow and light green.
  4. Deficient plants shorter, with fewer leaves, weigh less, and smaller root system at tillering.

Corrective measures:
  1. Apply MnSO4 or finely ground MnO (5-20 kg Mn/ha) in bunds along rice rows.
  2. Apply foliar MnSO4 for rapid treatment of Mn deficiency(1-5 kg Mn/ha in about 200 L water/ha).
  3. Use acid-forming fertilizers, e.g., ammonia sulfate [(NH4)2SO4] instead of urea.

Manganese sources: Mn sulfate,Mn chloride

Toxicity symptoms:
  1. Yellowish brown spots between leaf veins, extending to the whole interveinal area.
  2. Brown spots on veins of lower leaf blades and leaf sheaths.
  3. Leaf tips dry out eight weeks after planting.
  4. Chlorosis of younger (upper) leaves, with symptoms similar to those of Fe chlorosis.
  5. Stunted plants, reduced tillering and sterility results in reduced grain yield.

Corrective measures:
  1. Coat seeds with oxidants (e.g., Ca peroxide) to improve germination and seedling emergence by increasing the supply of O2.
  2. Apply lime on acid soils to reduce the concentration of active Mn.
  3. Mn uptake is reduced in the presence of ammonia.

Mn def

Mn tox

Silicon
Si DefDeficiency symptoms:
  1. Leaves and culms become soft and droopy thus increasing mutual shading.
  2. Reduces photosynthetic activity.
  3. Severe Si deficiency reduces the number of panicles m2 and the number of filled spikelets per panicle.
  4. Si-deficient plants are particularly susceptible to lodging.

Corrective measures:
  1. For more rapid correction of Si deficiency, granular silicate fertilizers should be applied: Calcium  silicate 120-200 kg/ha , Potassium silicate 40-60 kg/ha.
  2. In the long term, Si deficiency is prevented by not removing the straw from the field following  harvest. Recycle rice straw (5-6% Si) and rice husks (10% Si).
  3. Avoid applying excessive amounts of N fertilizer, which increases yield and total uptake of N and Si, but also decreases the Si concentration in straw because of excessive biomass growth.
Silicon sources:
Calcium silicate, potassium silicate, blast furnace slag.

Sodium
Toxicity symptoms:
  1. Leaves short, narrow and brittle.
  2. Leaves initially show dark green colour, later become bleached and turn yellow to pink and necrotic

Corrective measures:
Soil application of gypsum at 100-200 kg/ha and leach with water.

Sulphur
Toxicity symptoms:
  1. Interveinal chlorosis of emerging leaves.
  2. Coarse, sparse, dark brown to black roots.
  3. Fresh uprooted rice has poorly developed root systems with many black roots.
  4. Increased occurrence of diseases.
Corrective measures:
  1. Apply K, P, and Mg fertilizers.
  2. Apply Fe (salts, oxides) on low-Fe soils to increase immobilization of H2S as FeS.
  3. Avoid continuous flooding and use intermittent irrigation in soils that contain large concentrations of S.
  4. Carry out dry tillage after harvest to increase S and Fe oxidation during the fallow period.
Top

Organic Manures
(1) Green Manuring
(2) Biofertilizer
(3) Organic Manuring Practices

Green Manuring
Green Manure

Green ManuresSeed rate (kg/ha)Green biomass (t/ha)
Sithagathi (Sesbania speciosa)30 – 4015-18
Dhaincha (Sesbania aculeata)5025
Manila Agathi - Sesbania rostrata4020
Sunnhemp (Crotalaria juncea)25-3513-15
Wild Indigo (Tephrosia purpurea)15-206-7
greenmanure

Green Leaf Manures
GlyricidiaPungam

NeemSesbania grandiflora
  • Glyricidia (Glyricidia maculata Syn. G.sepium)
  • Pungam (Derris indica Syn. Pongamia glabra)
  • Ipomoea cornea
  • Neem (Azadirachta indica)
  • Sesbania grandiflora

Advantages of green Manuring
  1. Green manuring builds up soil structure and improves tilth.
  2. Improves aeration in rice soils by stimulating activities of surface film of algae and bacteria.
  3. Harbour N fixing bacteria, rhizobia in root nodules and fix atmospheric N (60 to 100 kg N/ha).
  4. Promotes formation of crumbs in heavy soils leading to aeration and drainage.
  5. Vitamin and protein content of rice increased.

Biofertilizer
  1. Biofertilizers are ready to use live formulates of such beneficial microorganisms which on application to seed, root or soil mobilize the availability of nutrients by their biological activity in particular, and help to build up the micro-flora and in turn the soil health in general.
  2. Bio-fertilizers are eco friendly and are environmentally safe.
  3. They form not only part of integrated nutrients but are of low cost.
  4. The bio-fertilizers used for rice crop are azolla, Blue green algae,  Azotobacter, Azospirillum, Phosphobacteria, Phosphate solubilisers and Mycorhiza.

Azolla

  1. Azolla is a fresh water fern.
  2. 0.5 -1 t of biomass of azolla /ha is used for paddy in two ways either as green manure before transplanting, or as dual crop in 7 DAT.
  3. It releases the nitrogen to the rice crop only after complete decomposition (8-10 days).
  4. It also enhances the availability of phosphorus than chemical fertilizer on 40th day besides improving the C:N ratio of soils.

Blue green algae
Blue green
  1. These are photosynthetic prokaryotic microorganisms capable of fixing atmospheric nitrogen.
  2. It can be applied to rice crop at 10 kg/ha on 10 DAT. ‘Algalisation’ increases the nitrogen content of both grain and straw besides increasing soil fertility.
  3. It can fix 20-30 kg N/ha.

Azotobacter

  1. Azotobacter is a free living nitrogen fixing bacteria.
  2. It can be applied to rice through seed or seedling or soil.
Azotobacter

Azospirillium
AzospirillumInoculation with Azospirillum promotes early tillering and also the growth of rice and significantly increases filling rate of grain and the grain weight per plant at harvest.


Phosphobacteria
  1. A large proportion of the phosphatic fertilizer applied to soil is fixed by conversion into insoluble forms of phosphorus which is not available to plants.
  2. Only 20-25 per cent of phosphorous is available to plants. This insoluble and unavailable phosphorus remains unutilized by plants in soil.
  3. The bacteria, which dissolve the undissolved form of phosphorus is called  'Phosphobacteria'.
  4. The organic acids produced by phosphobacteria dissolve the insoluble (fixed) form of  phosphorous in soil and make it available to plants.
Phosphobacteria

Azospirillium,Phosphobacteria,Azotobacter
Number of packets/hectare is
Method of applicationNumber of Packets/ha
Seed treatment5
Nursery application10
Seedling dip5
Main field (Soil application)10
Total30

Mycorrhiza
Mychorriza
  1. It occurs naturally in low land and upland rice. It mobilizes the phosphorus required by rice.
  2. It also provides nutrients such as iron, zinc, copper, manganese etc.
  3. Endomycorrhiza are obligate symbionts and can be maintained only on live plants inoculated with spores of a species and collecting the pieces of roots with soil.
  4. The root biomass heavily infected by a specific mycorrhizal fungus serves as the inoculum for subsequent plots.


Phosphate Solubilisers
  1. This type of biofertilizers solubilises phosphates in the soil and render them in available form for low land and upland rice.
  2. Bacteria like Bacillus megatherium var phosphaticum, Bacillus polymixa,  Pseudomonas fluorscens, Pseudomonasstriata fungi like Pencillium digitatum, Aspergillus niger, Aspergillusawamori were found to have a strong phosphate dissolving ability.
  3. For semi-dry rice, hardened seeds are treated with Pseudomonas fluorscens 10g/kg of seed.
Phosphate solubiliser

Methods of application of Biofertilizer
dipseed
  1. Bacterial biofertilizers are supplied as carrier based inoculants.
  2. Peat or lignite is used as carrier material.
  3. Carrier based bacterial inoculants are applied by the following methods.
  4. Seed treatment.
  5. Seedling root dip and
  6. Main field application

Seed Treatment
  1. One package of the inoculant is mixed with 200ml of rice kanji to make slurry.
  2. The seeds required for an acre are mixed in the slurry so as to have a uniform coating of the inoculant over the seeds and then shade dried for 30 minutes.
  3. The shade dried seeds should be sown within 24 hours.
  4. One packet of the inoculant (200g) is sufficient to treat 10 kg of seeds.
seed_ treatment

Seedling Root Dip
seed dip
  1. This method is used for transplanted crops.
  2. Two packets of the inoculant is mixed in 40 litres of water.
  3. The root portion of the seedlings required for an acre is dipped in the mixture for 5 to 10 minutes and then transplanted.

Main field Preparation
Four packets of the inoculant is mixed with 20 kgs of dried powdered farm yard manure and broadcast in one acre of main field just before transplanting. FYM

Combained application of Bacterial Biofertilizers
soilappPhosphobacteria can be mixed with Azospirillum. The inoculants should be mixed in equal quantities and applied as mentioned above.

Organic Manuring practices
TamilNadu
  1. In nursery, apply 1 tonne of fully decomposed FYM or compost to 20 cents nursery and spread the manure uniformly on dry soil.
  2. In main field, apply 12.5 t of FYM or compost or green leaf manure @ 6.25 t/ha.
  3. If green manure is raised @ 20 kg /ha in situ, incorporate it to a depth of 15 cm using a green manure trampler or tractor.
  4. In the place of green manure, press-mud / composted coir-pith can also be used.
FYM_n
Green_ Manure

Kerala
Cowpea_k
  1. Apply organic manure in the form of farmyard manure or compost or green leaf @ of 5 t/ha and incorporate into the soil while ploughing.
  2. Cowpea may be raised as an intercrop in dry seeded low land (semi-dry) rice by sowing 12.5 kg seed/ha along with rice to serve as a source of green manure.
  3. When the rice field gets submerged with the onset of southwest monsoon, cowpea at the age of about six weeks and at active vegetative stage decays and gets self-incorporated in the soil adding substantial quantity of green manure.
  4. Such a system of concurrent growing of cowpea also reduces weed pressure in semi-dry rice.

Karnataka
Drill sown paddy :
  1. Sow sunhemp green manure seeds @10kg/ha mixed with paddy seeds.
  2. Carry out hodta operation (Planking) in standing water after 40 DAS for in situ incorporation of sunhemp in the soil which will decompose easily and early and add to organic matter to the soil maintaining the soil fertility.
    (OR)
  1. Ex situ incorporation of green leaf manuring of Eupatorium/parthenium/cassia and other weeds green material @ 5 t/ha in between the two paddy rows by carrying out hodta operation.
  2. Provides only 50% nutrients to maintain good yield.

Transplanted paddy:
Sow green manure seeds of Sesbania rostrata (@ 25kg/ha) along with the application of entire P2O5 recommended for paddy, eight weeks before transplanting of paddy, then in situ incorporate the green manure crop by carrying out hodta operation ( Planking) seven weeks after sowing. Transplant paddy seedlings after one week of incorporation along with the application of 50% recommended nitrogen for paddy.
Incor_ Sesbania

Sow _sunhemp
Top


Fertilizer Requirements
(1) Fertilizer Requirements
These products are quick acting, even in cool soils and they are inexpensive. They are the most effective means of increasing crop production and supplement nutrient supply in the soil, especially to correct yield-limiting factors.

(1) a)Tamil Nadu
Transplanted Puddled Low Land Rice
Blanket recommendation (Kg/ha) – 150:50:50
tbltransplanted
In nursery, before the last puddling apply basal application of DAP (40 kg) is recommended when the seedlings are to be pulled out in 20-25 days after sowing. For clay soils where root snapping is a problem, 4kg of Gypsum and 1 kg of DAP per cent can be applied at 10 DAS.

Direct wet seeded puddled lowland rice, Dry seeded rainfed un-puddled lowland rice and Rainfed upland rice
Blanket recommendation (Kg/ha) – 50:25:25

tbldirectseed

Semidry System-Dry seeded rice in un-puddled low land
Blanket recommendation (Kg/ha) –:75:25:37.5

tblsemidry

(b) Kerala
tblkerala
Stages of application:

1. For short duration varieties, N is applied in three equal splits viz., basal, active tillering, and active panicle initiation     stages. The recommended P is fully applied as basal. K is applied in two equal splits viz., basal and active panicle     initiation stages.
2. For medium and long duration varieties, N are applied in two equal splits viz., basal and active panicle initiation     stages. The recommended P is fully applied as basal. K is applied in two equal splits viz., basal and active panicle     initiation stages.
3. For direct seeded crop, the basal application should be done one week after sowing.

(c) Karnataka
tblkarnataka
Zone 1 - North Eastern Transition Zone   
Zone 2 - North Eastern Dry Zone
Zone 3 - Northern Dry Zone
Zone 4 - Central Dry Zone
Zone 5 - Eastern Dry Zone
Zone 6 - Southern dry Zone
Zone 7- Southern Transition Zone
Zone 8 - Northern Transition Zone
Zone 9 - Hill Zone
Zone 10 - Coastal Zone


(2) Method of Fertilizer application
Soil application
Basal application
  1. Apply 25 % recommended dose of N and K as basal.
  2. P may be applied fully as basal and incorporated.
  3. Apply 25 kg of zinc sulphate mixed with 50 kg dry sand just before transplanting.
  4. Apply 500 kg of gypsum/ha (as source of Ca and S nutrients) at last ploughing.

Top dressing

Apply 25 % recommended dose of N and K each as top dressing at active tillering, panicle initiation and heading stages.
soil application

Foliar Nutrition in paddy
foliar application of nutrients
  1. In recent year’s soluble fertilizers otherwise known as foliar fertilizers like Polyfeed and Multi 'K' were introduced in rice growing states.
  2. Polyfeed contains 19: 19: 19 NPK with 6 micro-nutrients like iron, manganese, boron, zinc,  copper and molybdenum, while multi K contains 13: 0: 46 NPK.
  3. These fertilizers provide nutrients to the plant by foliar application as these  fertilizers are completely soluble in water.
  4. These fertilizers have no other impurities like sodium and chloride and they are 100 % nutrients and these nutrients are easily absorbed through the leaves.
  5. In certain occasions like prolonged drought, there is no scope to apply fertilizers to the soil for want of moisture. Like wise in flooded conditions due to continuous rains fertilizers could not be applied to the soil. In such special circumstances these soluble fertilizers are must to protect the crop against hunger and this forms a compulsory act of crisis management.
  6. And the foliar application of Speciality fertilizers plays an important role in supplying the nutrients at critical stages of flowering and grain formation.
  7. Under special conditions of drought and waterlogging, apply N as foliar spray.
  8. Urea may be applied as a low volume spray at 15% concentration using power sprayer or at 5% concentration using a high volume sprayer, the quantity applied in one application being limited to 15 kg/ha.
  9. Foliar spray of Urea (10 g/lit) + DAP (20 g/lit) + KCl (10 g/lit) at PI and 10 days later for all  varieties.
  10. If deficiency symptom appears, foliar application of 0.5% Zinc sulphate + 1.0% urea can be given at 15 days interval until the Zn deficiency symptoms disappear.

Growth Regulators
  1. Foliar spray of Brassinosteriods 0.3 ppm at Panicle Initiation and Flowering stages increased the grain yield.
  2. For increasing the rooting under broadcast method of planting, soaking roots in 25 ppm Induction of better rooting for early establishment in rice, root dipping for 16 hours in thiamin solution.
spraying of growth regulator
Top


Integrated Nutrient Management (INM)
greenmanureIntegrated nutrient management (INM) aims at reducing the chemical fertilizer applied and improving its efficiency through combined use of different sources of plant nutrients such as
Fertilizers,
1. Organic manures,
2. Green manures,
3. Crop residues,
4. Biofertilisers and
5.Industrial wastes / soil conditioners in balanced proportions, depending on their availability and suitability in a specific rice ecosystem.

Sources of nutrients:
1. Organic manures / compost – 12.5 t of FYM
2. Green manures / green leaf manures / crop residues - 6.25 t/ha
3. Fertilizers – Apply blanket recommendation as per the ecosystem.

Biofertilizers:
1. Azolla –as green rmanure @ 6t /ha, as dual crop (0.5 t/ha) in 7 DAT
2. Blue green algae - 10 kg/ha on 10 DAT
3. Azotobacter /Azospirillium /Phosphobacteria  - 10 packets (soil application)
4. Azophos – 20 packets (soil application)

Micronutrients:
  1. Apply 25 kg of zinc sulphate mixed with 50 kg dry sand just before transplanting.
  2. It is enough to apply 12.5 kg zinc sulphate /ha, if green manure (6.25 t/ha) or enriched FYM, is  applied.
  3. If deficiency symptom appears, foliar application of 0.5% Zinc sulphate + 1.0% urea can be given at 15 days interval until the Zn deficiency symptoms disappear.
  4. Dip roots of the seedlings in 1% Zinc sulphate solution for one minute before transplanting.

Local Weather Report and Forecast For: Kakinada Dated :Nov 14, 2015

$
0
0

Temperature Map


Local Weather Report and Forecast For: Kakinada    Dated :Nov 14, 2015
Kakinada
Past 24 Hours Weather Data
Maximum Temp(oC)32.0
Departure from Normal(oC)2
Minimum Temp (oC)20.8
Departure from Normal(oC)-2
24 Hours Rainfall (mm)NIL
Todays Sunset (IST)17:26
Tommorows Sunrise (IST)06:05
Moonset (IST)19:41
Moonrise (IST)08:04
Today's Forecast:Sky condition would be generally cloudy. Rain/thundershowers may occur.Maximum & Minimum temperatures would be around 32 and 21 deg.cel respectively.
Date Temperature ( o C ) Weather Forecast
Minimum Maximum
15-Nov 21.0 32.0 Partly cloudy sky with possibility of rain or Thunderstorm
16-Nov 21.0 32.0 Partly cloudy sky with possibility of rain or Thunderstorm
17-Nov 21.0 32.0 Partly cloudy sky with possibility of rain or Thunderstorm
18-Nov 22.0 31.0 Mist
19-Nov 22.0 31.0 Mist
20-Nov 22.0 30.0 Mist


INDIA METEOROLOGICAL DEPARTMENT 
NWP MODELS BASED DISTRICT LEVEL WEATHER PREDICTION
ISSUED ON: 14-11-2015
VALID TILL 08:30 IST OF THE NEXT 5 DAYS

DISTRICT : EAST-GODAVARI STATE : ANDRA-PRADESH
------------------- ------------------- ------------------- ------------------- ------------------- -------------------
PARAMETERS ENSEMBLE FCST
----------------------------------------------------------------------------------------------------
DAY-1 DAY-2 DAY-3 DAY-4 DAY-5
15/11 16/11 17/11 18/11 19/11
------------------- ------------------- ------------------- ------------------- ------------------- -------------------
Rainfall (mm) 0 0 10 25 10
Max Temperature ( deg C) 29 30 29 26 23
Min Temperature ( deg C) 13 14 17 18 15
Total cloud cover (octa) 6 7 8 8 8
Max Relative Humidity (%) 84 77 79 91 80
Min Relative Humidity (%) 40 40 49 62 66
Wind speed (kmph) 007 008 009 011 007
Wind direction (deg) 85 56 63 100 89
------------------ ------------------- ------------------- ------------------- ------------------- -------------------


Month of November, 2015


MaxAvgMinSum
Temperature
Max Temperature32 °C31 °C29 °C
Mean Temperature28 °C27 °C22 °C
Min Temperature26 °C23 °C20 °C
Degree Days
Heating Degree Days (base 65)0000
Cooling Degree Days (base 65)18157215
Growing Degree Days (base 50)333022423
Dew Point
Dew Point26 °C23 °C11 °C
Precipitation
Precipitation3.0 mm0.2 mm0.0 mm3.40 mm
Snowdepth- - - -
Wind
Wind15 km/h3 km/h0 km/h
Gust Wind- - -
Sea Level Pressure
Sea Level Pressure1015 hPa1012 hPa1008 hPa

Monthly Weather History Graph

Monthly Weather History Graph

Text of PM’s address to the British Parliament

$
0
0
Text of PM’s address to the British Parliament

Lord Speaker,
Mr. Speaker,
Mr. Prime Minister

I am delighted to be in London. Even in this globalised world, London is still the standard for our times. The city has embraced the world’s diversity and represents the finest in human achievements. And, I am truly honoured to speak in the British Parliament.

Mr. Speaker, thank you for opening the doors to us, here in this magnificent setting of the Royal Court. I know that the Parliament is not in Session. Prime Minister Cameron looks relaxed and relieved.

But, I want to remind you, Mr. Prime Minister, that you owe me royalty for an election slogan. I know that you are hosting me at the Chequers this evening. But, I also know that you will understand if I am fair to both sides of the floor. Especially since British MPs of Indian Origin are evenly balanced between the Treasury and the Opposition benches. So, I also extend my good wishes to the Labour. Indeed, since these are still early days after the election, my warm congratulations to the Members of the House. And, greetings to the eminent leaders of Britain and great friends of India present here today.

So much of the modern history of India is linked to this building. So much history looms across our relationship. There are others who have spoken forcefully on the debts and dues of history. I will only say that many freedom fighters of India found their calling in the institutions of Britain. And, many makers of modern India, including several of my distinguished predecessors, from Jawaharlal Nehru to Dr. Manmohan Singh, passed through their doors.

There are many things on which it is hard to tell anymore if they are British or Indian: The Jaguar or the Scotland Yard, for example. The Brooke Bond tea or my friend late Lord Ghulam Nun’s curry. And, our strongest debates are whether the Lord’s pitch swings unfairly or the wicket at Eden Gardens cracks too early. And, we love the Bhangra rap from London just as you like the English novel from India.

On the way to this event, Prime Minister Cameron and I paid homage to Mahatma Gandhi outside the Parliament. I was reminded of a question I was asked on a tour abroad. How is it that the statue of Gandhi stands outside the British Parliament? To that question, my answer is: The British are wise enough to recognise his greatness; Indians are generous enough to share him; we are both fortunate enough to have been touched by his life and mission; and, we are both smart enough to use the strengths of our connected histories to power the future of our relationship.

So, I stand here today, not as a visiting Head of Government, given the honour to speak in this temple of democracy. I am here as a representative of a fellow institution and a shared tradition.

And, tomorrow, Prime Minister and I will be at the Wembley. Even in India, every young footballer wants to bend it like Beckham. Wembley will be a celebration of one-half-million threads of life that bind us; one and half million people - proud of their heritage in India; proud of their home in Britain.

It will be an expression of joy for all that we share: values, institutions, political system, sports, culture and art. And, it will be a recognition of our vibrant partnerships and a shared future.

The United Kingdom is the third largest investor in India behind Singapore and Mauritius. India is the third largest source of Foreign Direct Investment projects in the United Kingdom. Indians invest more in Britain than in the rest of European Union combined. It is not because they want to save on interpretation costs, but because they find an environment that is welcoming and familiar.

It takes an Indian icon, Tata, to run a British icon and become your nation’s largest private sector employer.

The UK remains a preferred destination for Indian students. And, I am pleased that an Indian company is taking a thousand British students to India to skill them in Information Technology.

We are working together in the most advanced areas of science and technology. We are finding solutions to the enduring human problems of food and health security, and seeking answers to emerging challenges like climate change.

Our security agencies work together so that our children return home safe and our increasingly networked lives are not prey to the threats on cyber space.

Our Armed Forces exercise with each other, so that they can stand more strongly for the values we represent. This year alone, we have had three exercises together.

And, in the international arena, your support has made it more possible for India to take her rightful place in global institutions and regimes. And, it has helped us both advance our common interests.

Mr. Speaker,

Strong as our partnership is, for a relationship such as ours, we must set higher ambitions. We are two democracies; two strong economies; and, two innovative societies.

We have the comfort of familiarity and the experience of a long partnership. Britain’s resurgence is impressive. Its influence on the future of the global economy remains strong.

And, Mr. Speaker, India is new bright spot of hope and opportunity for the world. It is not just the universal judgment of international institutions. It is not just the logic of numbers: a nation of 1.25 billion people with 800 million under the age of 35 years.

This optimism comes from the energy and enterprise of our youth; eager for change and confident of achieving it. It is the result of bold and sustained measures to reform our laws, policies, institutions and processes.

We are igniting the engines of our manufacturing sector; making our farms more productive and more resilient; making our services more innovative and efficient; moving with urgency on building global skills for our youth; creating a revolution in Startup enterprises; and, building the next generation infrastructure that will have a light footprint on the Earth.

Our momentum comes not just from the growth we pursue, but from the transformation that we seek in the quality of life for every citizen.

Much of India that we dream of still lies ahead of us: housing, power, water and sanitation for all; bank accounts and insurance for every citizen; connected and prosperous villages; and, smart and sustainable cities. These are goals with a definite date, not just a mirage of hope.

And, inspired by Gandhiji, the change has begun with us – the way the government works. There is transparency and accountability in governance. There is boldness and speed in decisions.

Federalism is no longer the fault line of Centre-State relations, but the definition of a new partnership of Team India. Citizens now have the ease of trust, not the burden of proof and process. Businesses find an environment that is open and easy to work in.

In a nation connected by cell phones, Digital India is transforming the interface between Government and people.

So, Mr. Speaker, with apologies to poet T.S. Eliot, we won’t let the shadow fall between the idea and reality.

If you visit India, you will experience the wind of change.

It is reflected in the surge of investments from around the world; in enhanced stability of our economy; in 190 million new bank accounts of hope and inclusion; in the increase in our growth to nearly 7.5% per year; and, in the sharp rise in our ranking on Ease of Doing Business.

And, the motto of Sab Ka Saath, Sab Ka Vikas, is our vision of a nation, in which every citizen belongs, participates and prospers.

It is not just a call for economic inclusion. It is also a celebration of our diversity; the creed for social harmony; and, a commitment to individual liberties and rights.

This is the timeless ethos of our culture; this is the basis of our constitution; and, this will be the foundation of our future.

Mr. Speaker,
Members and Friends,

The progress of India is the destiny of one-sixth of humanity. And, it will also mean a world more confident of its prosperity; and, more secure about its future.

It is also natural and inevitable that our economic relations will grow by leaps and bounds. We will form unbeatable partnerships, if we combine our unique strengths and the size and scale of opportunities in India.

We will see more investment and trade. We will open new doors in the Services sector. We will collaborate more – here and in India - in defence equipment and technology. We will work together on renewable and nuclear energy.

We will explore the mysteries of science and harness the power of technology and innovation. We will realise the opportunities of the digital world. Our youth will learn more from - and with - each other.

But, a relationship as rich as this, with so much promise as ours, cannot be measured only in terms of our mutual prosperity.

Mr. Speaker,

Ours is an age of multiple transitions in the world. We are yet to fully comprehend the future unfolding before us. As in the previous ages, it will be different from the world we know.

So, in the uncharted waters of our uncertain times, we must together help steer a steady course for this world in the direction that mirrors the ideals we share.

For, in that lies not just the success of our two nations, but also the promise of the world that we desire. We have the strength of our partnership and the membership of the United Nations, the Commonwealth and the G-20.

We live in a world where instability in a distant region quickly reaches our doorsteps. We see this in the challenges of radicalization and refugees.

The fault lines are shifting from the boundaries of nations into the web of our societies and the streets of our cities. And, terrorism and extremism are a global force that are larger than their changing names, groups, territories and targets.

The world must speak in one voice and act in unison to combat this challenge of our times. We must adopt a Comprehensive Convention on International Terrorism in the UN without delay. There should be no distinction between terrorist groups or discrimination between nations. There should be a resolve to isolate those who harbour terrorists and willingness to stand with nations that will fight them honestly. And, we need a social movement against extremism in countries where it is most prevalent and, every effort to delink religion and terrorism.

Oceans remain vital for our prosperity. Now, we have to also secure our cyber and outer space. Our interests are aligned across many regions. We have a shared interest in stable, prosperous and integrated South Asia, drawn together in a shared march to prosperity.

We want an Afghanistan that is shaped by the dreams of the great Afghan people, not by irrational fears and overreaching ambitions of others.

A peaceful, stable Indian Ocean Region is vital for global commerce and prosperity. And, the future of Asia Pacific region will have profound impact on all of us. We both have huge stakes in West Asia and the Gulf.

And, in Africa, where, amidst many challenges, we see so many promising signs of courage, wisdom, leadership and enterprise. India has just held an Africa Summit, in which all 55 countries, and 42 leaders participated.

We must also cooperate to launch a low carbon age for a sustainable future for our planet. This is a global responsibility that we must assume in Paris later this month.

The world has crafted a beautiful balance of collective action – common but differentiated responsibility and respective capabilities.

Those who have the means and the know-how must help meet the universal aspiration of humanity for clean energy and a healthy environment. And, when we speak of restraint, we must not only think of curbing fossil fuels, but also moderating our lifestyles.

We must all do our part. For India, a target of 175 GW of additional capacity in renewable energy by 2022 and reduction in emission intensity of 33-35 % by 2030 are just two of the steps of a comprehensive strategy.

I have also proposed to launch during the COP 21 meeting an International Solar Alliance to make solar energy an integral part of our lives, even in the most unconnected villages.

In Britain, you are more likely to use an umbrella against rain than the sun. But, my team defined the membership of the Solar Alliance in more precise terms: you have to be located within the Tropics.

And, we are pleased that the United Kingdom qualifies! So, we look forward to an innovative Britain as a valuable partner in this endeavour. Prime Minister Cameron and I are, indeed, very pleased that cooperation on affordable and accessible clean energy is an important pillar of our relations.

Mr. Speaker,

This is a huge moment for our two great nations. So, we must seize our opportunities, remove the obstacles to cooperation, instill full confidence in our relations and remain sensitive to each other’s interests.

In doing so, we will transform our strategic partnership, and we will make this relationship count as one of the leading global partnerships. Ever so often, in the call of Britain’s most famous Bard that we must seize the tide in the affairs of men, the world has sought the inspiration to act. And, so must we.

But, in defining the purpose of our partnership, we must turn to a great son of India, whose house in London I shall dedicate to the cause of social justice on Saturday. Dr. B. R. Ambedkar, whose 125th birth anniversary we are celebrating now, was not just an architect of India’s Constitution and our parliamentary democracy. He also stood for the upliftment of the weak, the oppressed and the excluded. And, he lifted us all to a higher cause in the service of humanity; to build a future of justice, equality, opportunity and dignity for all humans; and, peace among people.

That is the cause to which India and the United Kingdom have dedicated themselves today.

Thank you very much, thanks a lot.
Viewing all 9450 articles
Browse latest View live