Quantcast
Channel: EHSQL(Environment-Energy ,Health,Safety, Security and Social Ac. ,Quality-Lab) Technical services
Viewing all 8165 articles
Browse latest View live

Types of Heat Stress

$
0
0
Workers who are exposed to extreme heat or work in hot environments may be at risk of heat stress. Exposure to extreme heat can result in occupational illnesses and injuries. Heat stress can result in heat stroke, heat exhaustion, heat cramps, or heat rashes. Heat can also increase the risk of injuries in workers as it may result in sweaty palms, fogged-up safety glasses, and dizziness. Burns may also occur as a result of accidental contact with hot surfaces or steam.
Workers at risk of heat stress include outdoor workers and workers in hot environments such as firefighters, bakery workers, farmers, construction workers, miners, boiler room workers, factory workers, and others. Workers at greater risk of heat stress include those who are 65 years of age or older, are overweight, have heart disease or high blood pressure, or take medications that may be affected by extreme heat.
Prevention of heat stress in workers is important. Employers should provide training to workers so they understand what heat stress is, how it affects their health and safety, and how it can be prevented.

Types of Heat Stress


Heat Stroke

Heat stroke is the most serious heat-related disorder. It occurs when the body becomes unable to control its temperature: the body's temperature rises rapidly, the sweating mechanism fails, and the body is unable to cool down. When heat stroke occurs, the body temperature can rise to 106 degrees Fahrenheit or higher within 10 to 15 minutes. Heat stroke can cause death or permanent disability if emergency treatment is not given.

Symptoms

Symptoms of heat stroke include:
  • Hot, dry skin or profuse sweating
  • Hallucinations
  • Chills
  • Throbbing headache
  • High body temperature
  • Confusion/dizziness
  • Slurred speech

First Aid

Take the following steps to treat a worker with heat stroke:
  • Move the sick worker to a cool shaded area.
  • Cool the worker using methods such as:
    • Soaking their clothes with water.
    • Spraying, sponging, or showering them with water.
    • Fanning their body.

Heat Exhaustion

Heat exhaustion is the body's response to an excessive loss of the water and salt, usually through excessive sweating. Workers most prone to heat exhaustion are those that are elderly, have high blood pressure, and those working in a hot environment.

Symptoms

Symptoms of heat exhaustion include:
  • Heavy sweating
  • Extreme weakness or fatigue
  • Dizziness, confusion
  • Nausea
  • Clammy, moist skin
  • Pale or flushed complexion
  • Muscle cramps
  • Slightly elevated body temperature
  • Fast and shallow breathing

First Aid

Treat a worker suffering from heat exhaustion with the following:
  • Have them rest in a cool, shaded or air-conditioned area.
  • Have them drink plenty of water or other cool, nonalcoholic beverages.
  • Have them take a cool shower, bath, or sponge bath.

Heat Syncope

Heat syncope is a fainting (syncope) episode or dizziness that usually occurs with prolonged standing or sudden rising from a sitting or lying position. Factors that may contribute to heat syncope include dehydration and lack of acclimatization.

Symptoms

Symptoms of heat syncope include:
  • Light-headedness
  • Dizziness
  • Fainting

First Aid

Workers with heat syncope should:
  • Sit or lie down in a cool place when they begin to feel symptoms.
  • Slowly drink water, clear juice, or a sports beverage.

Heat Cramps

Heat cramps usually affect workers who sweat a lot during strenuous activity. This sweating depletes the body's salt and moisture levels. Low salt levels in muscles causes painful cramps. Heat cramps may also be a symptom of heat exhaustion.

Symptoms

Muscle pain or spasms usually in the abdomen, arms, or legs.

First Aid

Workers with heat cramps should:
  • Stop all activity, and sit in a cool place.
  • Drink clear juice or a sports beverage.
  • Do not return to strenuous work for a few hours after the cramps subside because further exertion may lead to heat exhaustion or heat stroke.
  • Seek medical attention if any of the following apply:
    • The worker has heart problems.
    • The worker is on a low-sodium diet.
    • The cramps do not subside within one hour.

Heat Rash

Heat rash is a skin irritation caused by excessive sweating during hot, humid weather.

Symptoms

Symptoms of heat rash include:
  • Heat rash looks like a red cluster of pimples or small blisters.
  • It is more likely to occur on the neck and upper chest, in the groin, under the breasts, and in elbow creases.

First Aid

Workers experiencing heat rash should:
  • Try to work in a cooler, less humid environment when possible.
  • Keep the affected area dry.
  • Dusting powder may be used to increase comfort.

Recommendations for Employers

Employers should take the following steps to protect workers from heat stress:
  • Schedule maintenance and repair jobs in hot areas for cooler months.
  • Schedule hot jobs for the cooler part of the day.
  • Acclimatize workers by exposing them for progressively longer periods to hot work environments.
  • Reduce the physical demands of workers.
  • Use relief workers or assign extra workers for physically demanding jobs.
  • Provide cool water or liquids to workers.
    • Avoid alcohol, and drinks with large amounts of caffeine or sugar.
  • Provide rest periods with water breaks.
  • Provide cool areas for use during break periods.
  • Monitor workers who are at risk of heat stress.
  • Provide heat stress training that includes information about:
    • Worker risk
    • Prevention
    • Symptoms
    • The importance of monitoring yourself and coworkers for symptoms
    • Treatment
    • Personal protective equipment

Recommendations for Workers

Workers should avoid exposure to extreme heat, sun exposure, and high humidity when possible. When these exposures cannot be avoided, workers should take the following steps to prevent heat stress:
  • Wear light-colored, loose-fitting, breathable clothing such as cotton.
    • Avoid non-breathing synthetic clothing.
  • Gradually build up to heavy work.
  • Schedule heavy work during the coolest parts of day.
  • Take more breaks in extreme heat and humidity.
    • Take breaks in the shade or a cool area when possible.
  • Drink water frequently. Drink enough water that you never become thirsty. Approximately 1 cup every 15-20 minutes.
  • Avoid alcohol, and drinks with large amounts of caffeine or sugar.
  • Be aware that protective clothing or personal protective equipment may increase the risk of heat stress.
  • Monitor your physical condition and that of your coworkers.


IMD declares RED ALERT

$
0
0


IMD declares RED ALERT

.

India Meteorological Department (IMD) obsevered the record temperatures in several parts of India and issued a red alert in the country.

So far, 427 died due to sun-stroke in Telugu states, AP and Telangana. IMD department predicted the soaring temperatures to further increase in coming days. The heat waves may continues for three or four more days. IMD suggested  people take necessary precautions before going out in sun.
The winds from North-West India are causing the scorching heat in Vidarbha, Telangana and Rayalseema areas. In addition to heat the humidity is causing more trouble to common man. Hyderabad recorded highest temperatue in past five years.  204 in AP died due to heat waves , while Prakasham alone reported 64 deaths. 223 were killed by sun-stroke in Telangana in past five days including 67 from Nalgonda district.


IMD declares RED ALERT

IMD declares RED ALERT
http://www.sakshipost.com/index.php/news/state/57107-imd-declares-red-alert.html?psource=Feature

 http://www.tupaki.com/news/view/IMD-declares-RED-ALERT-/103048

SAVE YOUR NEAR DEAR AS PER THE IMD ALERT

$
0
0
All India Weather Warning Bulletin

Central
East
Northeast
Northwest
South
West
All India
Home
Back


Local Weather Report and Forecast For: Kakinada Dated :May 23, 2015

$
0
0
Local Weather Report and Forecast For: Kakinada    Dated :May 23, 2015

  • 47 °C Machilipatnam
  • 47 °C Vijayawada - Gannavaram
  • 46 °C Daltonganj
  • 46 °C Ramgundam
  • 46 °C Jaisalmer

Kakinada
Past 24 Hours Weather Data
Maximum Temp(oC)44.7
Departure from Normal(oC)6
Minimum Temp (oC)29.5
Departure from Normal(oC)1
24 Hours Rainfall (mm)NIL
Todays Sunset (IST)18;28
Tommorows Sunrise (IST)05;28
Moonset (IST)22;59
Moonrise (IST)10;00
Today's Forecast:Sky condition would be partly cloudy. Maximum & Minimum temperatures would be around 45 and 30 degrees Celsius respectively.
Date Temperature ( o C ) Weather Forecast
Minimum Maximum
24-May 30.0 45.0 Partly cloudy sky
25-May 30.0 45.0 Mainly clear sky
26-May 30.0 44.0 Partly cloudy sky
27-May 29.0 44.0 Partly cloudy sky with Thundery development
28-May 29.0 43.0 Partly cloudy sky with Thundery development
29-May 29.0 43.0 Partly cloudy sky with Thundery development


ActualAverage Record
Temperature 
Mean Temperature36 °C -  
Max Temperature44 °C - - ()
Min Temperature29 °C - - ()
Cooling Degree Days34  
Growing Degree Days48 (Base 50)  
Moisture 
Dew Point26 °C  
Average Humidity59  
Maximum Humidity83  
Minimum Humidity18  
Precipitation 
Precipitation0.0 mm - - ()
Sea Level Pressure 
Sea Level Pressure1001.50 hPa  
Wind 
Wind Speed3 km/h ()  
Max Wind Speed7 km/h  
Max Gust Speed -   
Visibility7.0 kilometers  
Events    
T = Trace of Precipitation, MM = Missing ValueSource: Averaged Metar Reports

Daily Weather History Graph

Daily Weather History Graph

TODAY FORECAST
 23 MAY

MaxAvgMinSum
Temperature 
Max Temperature44 °C37 °C30 °C
Mean Temperature36 °C32 °C28 °C
Min Temperature29 °C27 °C24 °C
Degree Days 
Heating Degree Days (base 65)0000
Cooling Degree Days (base 65)342619619
Growing Degree Days (base 50)484134975
Dew Point 
Dew Point28 °C26 °C21 °C
Precipitation 
Precipitation14.0 mm0.6 mm0.0 mm14.20 mm
Snowdepth - - - -
Wind 
Wind11 km/h2 km/h0 km/h
Gust Wind - - -
Sea Level Pressure 
Sea Level Pressure1011 hPa1006 hPa999 hPa

Monthly Weather History Graph

Monthly Weather History Graph


Temperature inversions

$
0
0

Temperature inversions

The weather plays an important role in the formation and disappearance of air pollution. During winters, air quality has been observed to decline very quickly after long clear nights with weak winds. Then pollutants from different sources are emitted into the air, but because of poor mixing circumstances near the ground, pollutants released into the atmosphere's lowest layer are trapped at breathing level and can reach unhealthy levels in a few hours.

Surface Inversion
Structure of surface inversion
 
Winters are characterized by short days and low solar activity. The snow-covered ground is cold and its white colour reflects almost all heat coming in. When the sun goes down, the ground loses heat very quickly and this cools the air above the ground. Nights in the summertime are much shorter than nights during the wintertime when cooling of the ground can continue over a longer period of time. Weak winds prevent air mixing near the surface and clear skies increase the rate of cooling at the Earth's surface. Stable conditions inhibit vertical and horizontal mixing near the ground and consequently, favour the development of a strong surface temperature inversion or radiation inversion (see picture above). The condition like this is called an inversion because it is the reverse of a normal air pattern (i.e., warmer air below and cooler air above).

What factors have an affect on inversion?

The shape of the landscape has an impact on both the formation and intensity of inversion. For instance, over flat terrain inversion gradually intensifies if the surface cools. Over valleys cold air will flow down the slopes and settle under the warm air intensifying the inversion. Inversions frequently develop during evenings and nights and can occur at the surface or aloft in the atmosphere. During the daylight hours, surface inversions normally weaken or disappear when the sun warms the ground. In addition, wind speed and rain contribute to how quickly inversion will break up.
Radiation inversions are the most common type of inversion, but there exists other inversions like advection and subsidence inversions as well.

How do inversions impact air quality?

Winter temperature inversions play a significant role in the winter pollution episodes in Nordic urban sites. An inversion can prevent the rise and dispersal of pollutants from the lower layers of the atmosphere, because warm air above cooler air acts like a lid, preventing vertical mixing and trapping the pollution material e.g. at the breathing level. Traffic emissions especially have a great impact on air quality at the breathing level, because they are released near the ground.
The strength and duration of the inversion and elevation of the release compared to the inversion elevation has a large influence on the air quality. Air pollution will continue to accumulate until inversion disappears. Traffic particularly and other sources add more pollutants to the air. A strong and low height inversion will lead to high pollutant levels, while a weak inversion will lead to lower levels. In other words, the smaller is the mixing volume; the higher is the pollution concentration. Inversions are also stronger and more common during the winter months. In summer, inversions are less frequent and weaker.

Smoke leaving a chimney
Picture: Pia Anttila
 

Why tall chimney is usually better than short chimney?

Inversion can influence pollution near the ground as well as the behavior of smoke leaving a chimney. Under normal conditions, smoke plumes from chimneys would rise into the atmosphere and disperse, but in the case when an inversion is aloft, above chimneys, pollutants will be trapped underneath the inversion layer. When this inversion layer disappears, pollution concentrations can subsequently suddenly increase near the surface, if some vertical motion pushes the trapped smoke plume to the ground. To avoid this, many of the shorter chimneys have been replaced with taller ones, because taller chimneys are better able to mix pollutant throughout a greater volume of air. Alternatively, if a pollutant, e.g. a plume from a chimney, is released above the surface inversion layer, it will not have an opportunity to enter the inversion layer. In this case pollution disperses upward but not downward, due to the presence of the surface inversion.

Risk of severe air quality episode

The greatest potential for a severe air quality episode occurs when all the meteorological and other factors mentioned come simultaneously
  • Many sources of air pollution
  • High-pressure area
  • Light surface winds
  • Cooling air above the ground
  • Long, clear night
  • A strong and low inversion

Factors Affecting Air Quality

$
0
0

Factors Affecting Air Quality

The amount and kind of pollutants that are released into the air play a major role in determining the degree of air pollution in a specific area. However, other factors are involved, mainly:
  • topography (terrain), such as mountains and valleys;
  • weather, such as wind, temperature, air turbulence, air pressure, rainfall and cloud cover; and
  • the physical and chemical properties of pollutants. 
  • Introduction

    Poor air quality can result from a combination of factors. Regional air quality is affected by how air behaves as a result of the interaction of topography and weather, and by the emission sources themselves.

    The Red-Dye Example: How Air Behaves

    Let’s consider an analogy using water to help explain how air and air emissions behave. Imagine pouring red dye into the ocean. You’ll see a red pool of water for a few seconds, but it quickly disappears as the waves mix the dye into the huge mass of water. It is a combination of the amount of water, and the vigorous mixing that makes the dye disappear.
    Now imagine pouring that same amount of red dye into a bathtub. The bath water will turn very red because there is far less water than in the ocean, and there is no mixing with a source of clean water to dilute the dye.
    Just as red dye disappears in the ocean, air pollutants mix and disperse quickly in a large airshed because the air flow is not limited by topography but can travel and mix over great distances. This results in good air quality in the airshed.
    Sometimes, however, topography and weather combine to prevent pollutants from mixing and dispersing. In this case the pollutants become trapped within the area, like the red dye in the bathtub that continually builds up with nowhere to go. This results in poor air quality in the airshed.

    Weather, Wind and Geography

    Once pollutants are emitted into the air, the weather largely determines how well they disperse. Turbulence mixes pollutants into the surrounding air. For example, during a hot summer day, the air near the surface can be much warmer than the air above. Sometimes large volumes of this warm air will rise to great heights. This results in vigorous mixing. Wind speed also contributes to how quickly pollutants are carried away from their original source. However, strong winds don't always disperse the pollutants. They can transport pollutants to a larger area, such as the smoke from open burning or forest fires.
    Sometimes the condition of the atmosphere is very still (stable) and there is very little mixing. This occurs when the air near the surface of the earth is cooler than the air above (a temperature inversion). This cooler air is heavier and will not want to move up to mix with the warmer air above. Any pollutants released near the surface will get trapped and build up in the cooler layer of air near the surface. Temperature inversions are very common in B.C., especially in mountain valleys, often forming during calm clear nights with light winds. They can even persist throughout the day during the winter.inversion

    A Temperature Inversion in a Valley ;The arrows symbolize the colder air being pushed down to the surface by warmer air. This inversion and the valley walls trap pollution.


Emission Sources

Pollutants are released into the air from natural and human sources, from point and nonpoint sources. The number and size of emission sources in each area, along with weather conditions and topography, will determine the level of pollutants in the air within an airshed.
Many pollutants undergo chemical reactions when they encounter other pollutants in the air. The products of these chemical reactions are called secondary pollutants, as opposed to primary pollutants that are emitted directly into the atmosphere. Ground-level ozone is an example of a secondary pollutant that forms when nitrogen dioxide (NO2 ) and volatile organic compounds (VOCs) mix in the presence of sunlight.


How We Contribute to Air Pollution and Climate Change

$
0
0

How We Contribute to Air Pollution and Climate Change

The pollutants released into the atmosphere cause local air pollution. However, they also cause regional air pollution, as with huge plumes of smoke covering a large area, and acid rain. Beyond that, we are emitting such a high level of pollutants that they are causing serious global environmental problems: climate change and ozone depletion. The human race has become capable of affecting the atmosphere that encircles the Earth, and the very planet itself.

MAIN (COMMON) POLLUTANTS

Pollutant

Description and Sources

Health Impact

Environment

Particulate Matter (PM)

Dust, soot, and tiny bits of solid material.
PM10— Particles smaller than 10µm (microns) in diameter.
Far too small to see — 1/8th the width of a human hair.
• Road dust; road construction
• Mixing and applying fertilizers/ pesticides
• Forest fires
• Coarse particles irritate the nose and throat, but do not normally penetrate deep into the lungs.• PM is the main source of haze that reduces visibility.
• It takes hours to days for PM10 to settle out of the air.
• Because they are so small, PM2.5 stays in the air much longer than PM10, taking days to weeks to be removed.
• PM can make lakes and other sensitive areas more acidic, causing changes to the nutrient balance and harming aquatic life.

PM2.5–Particles smaller than 2.5µm in diameter• Combustion of fossil fuels and wood (motor vehicles, woodstoves and fireplaces)
• Industrial activity
• Garbage incineration
• Agricultural burning
• Fine particles are small enough to make their way deep into the lungs. They are associated with all sorts of health problems — from a runny nose and coughing, to bronchitis, asthma, emphysema, pneumonia, heart disease, and even premature death.
• PM2.5 is the worst public health problem from air pollution in the province. (Research indicates the number of hospital visits increases on days with increased PM levels).

Ground level Ozone (O3)

Bluish gas with a pungent odour
• At ground level, ozone is formed by chemical reactions between volatile organic compounds (VOCs) and nitrogen dioxide (NO2) in the presence of sunlight.
• VOCs and NO2 are released by burning coal, gasoline, and other fuels; and naturally by plants and trees.
• Exposure for 6-7 hours, even at low concentrations, significantly reduces lung function and causes respiratory inflammation in healthy people during periods of moderate exercise. Can be accompanied by symptoms such as chest pain, coughing, nausea, and pulmonary congestion. Impacts on individuals with pre-existing heart or respiratory conditions can be very serious.
• Ozone exposure can contribute to asthma, and reduced resistance to colds and other infections.
• Ozone can damage plants and trees, leading to reduced yields.
• Leads to lung and respiratory damage in animals.
• Ozone can also be good: the ozone layer above the earth (the stratosphere) protects us from harmful ultraviolet rays.

Other Pollutants

• sulphur dioxide (SO2)
• carbon monoxide (CO)
• nitrogen dioxide (NO2)
• total reduced sulphur (TRS)
• volatile organic compounds (VOCs)
• persistent organic pollutants (POPs)
• lead (Pb)
• polycyclic aromatic hydrocarbons (PAHs)
• dioxins and furans
Most of these pollutants come from combustion and industrial processes or the evaporation of paints and common chemical products.
• The health impacts of these pollutants are varied.
• Sulphur dioxide (SO2), for example, can transform in the atmosphere to sulphuric acid, a major component of acid rain.
• Carbon monoxide is fatal at high concentrations, and causes illness at lower concentrations.
• Dioxins and furans are among the most toxic chemicals in the world.
• While some of these pollutants have local impact on the environment (e.g., lead) or are relatively short lived (NO2) some are long lived (POPs) and can travel the world on wind currents in the upper atmosphere.
 
Processes such as fossil fuel burning in industry, motor vehicles and buildings emit pollutants that cause local and regional pollution. These pollutants include particulate matter (PM) and ground-level ozone (O3) — the key ingredients of smog — along with nitrogen oxides (NOx), sulphur oxides (SOx), volatile organic compounds (VOCs) and carbon monoxide (CO).
The same processes also release greenhouse gases, mainly carbon dioxide (CO2), methane (CH4) and nitrous oxide (N2O), which are linked to global climate change.
In some cases, air pollutants contribute to climate change, and greenhouse gases contribute to air pollution:
  • Air pollutants such as ground-level ozone and soot (a portion of particulate matter) contribute directly to global warming, which is linked to climate change.
  • Methane, one of the most important greenhouse gases, is a major cause of increased ground-level ozone.
Climate change itself may have a direct impact on air quality.

Soaps & Detergents: Chemistry

$
0
0

Soaps & Detergents: Chemistry

chemistry
To understand what is needed to achieve effective cleaning, it is helpful to have a basic knowledge of soap and detergent chemistry.
surfacetensionWater, the liquid commonly used for cleaning, has a property called surface tension. In the body of the water, each molecule is surrounded and attracted by other water molecules. However, at the surface, those molecules are surrounded by other water molecules only on the water side. A tension is created as the water molecules at the surface are pulled into the body of the water. This tension causes water to bead up on surfaces (glass, fabric), which slows wetting of the surface and inhibits the cleaning process. You can see surface tension at work by placing a drop of water onto a counter top. The drop will hold its shape and will not spread.
surfactantIn the cleaning process, surface tension must be reduced so water can spread and wet surfaces. Chemicals that are able to do this effectively are called surface active agents, or surfactants. They are said to make water "wetter."
Surfactants perform other important functions in cleaning, such as loosening, emulsifying sinkdishes(dispersing in water) and holding soil in suspension until it can be rinsed away. Surfactants can also provide alkalinity, which is useful in removing acidic soils.
04ChemSurfactants are classified by their ionic (electrical charge) properties in water: anionic (negative charge), nonionic (no charge), cationic (positive charge) and amphoteric (either positive or negative charge).
Soap is an anionic surfactant. Other anionic as well as nonionic surfactants are the main ingredients in today's detergents. Now let's look closer at the chemistry of surfactants.

Soaps

Soaps are water-soluble sodium or potassium salts of fatty acids. Soaps are made from fats and oils, or their fatty acids, by treating them chemically with a strong alkali.
First let's examine the composition of fats, oils and alkalis; then we'll review the soapmaking process.

Fats and Oils

The fats and oils used in soapmaking come from animal or plant sources. Each fat or oil is made up of a distinctive mixture of several different triglycerides.
In a triglyceride molecule, three fatty acid molecules are attached to one molecule of glycerine. There are many types of triglycerides; each type consists of its own particular combination of fatty acids.
Fatty acids are the components of fats and oils that are used in making soap. They are weak acids composed of two parts:
A carboxylic acid group consisting of one hydrogen (H) atom, two oxygen (O) atoms, and one carbon (C) atom, plus a hydrocarbon chain attached to the carboxylic acid group. Generally, it is made up of a long straight chain of carbon (C) atoms each carrying two hydrogen (H) atoms.
06Chem

Alkali

An alkali is a soluble salt of an alkali metal like sodium or potassium. Originally, the alkalis used in soapmaking were obtained from the ashes of plants, but they are now made commercially. Today, the term alkali describes a substance that chemically is a base (the opposite of an acid) and that reacts with and neutralizes an acid.
The common alkalis used in soapmaking are sodium hydroxide (NaOH), also called caustic soda; and potassium 07Chemhydroxide (KOH), also called caustic potash.

How Soaps are Made

Saponification of fats and oils is the most widely used soapmaking process. This method involves heating fats and oils and reacting them with a liquid alkali to produce soap and water (neat soap) plus glycerine.
08Chem
The other major soapmaking process is the neutralization of fatty acids with an alkali. Fats and oils are hydrolyzed (split) with a high-pressure steam to yield crude fatty acids and glycerine. The fatty acids are then purified by distillation and neutralized with an alkali to produce soap and water (neat soap).
09Chem
When the alkali is sodium hydroxide, a sodium soap is formed. Sodium soaps are "hard" soaps. When the alkali is potassium hydroxide, a potassium soap is formed. Potassium soaps are softer and are found in some liquid hand soaps and shaving creams.
The carboxylate end of the soap molecule is attracted to water. It is called the hydrophilic (water-loving) 10Chemend. The hydrocarbon chain is attracted to oil and grease and repelled by water. It is known as the hydrophobic (water-hating) end.

How Water Hardness Affects Cleaning Action

11ChemAlthough soap is a good cleaning agent, its effectiveness is reduced when used in hard water. Hardness in water is caused by the presence of mineral salts - mostly those of calcium (Ca) and magnesium (Mg), but sometimes also iron (Fe) and manganese (Mn). The mineral salts react with soap to form an insoluble precipitate known as soap film or scum.
Soap film does not rinse away easily. It tends to remain behind and produces visible deposits on clothing and makes fabrics feel stiff. It also attaches to the insides of bathtubs, sinks and washing machines.
Some soap is used up by reacting with hard water minerals to form the film. This reduces the amount of soap available for cleaning. Even when clothes are washed in soft water, some hardness minerals are introduced by the soil on clothes. Soap molecules are not very versatile and cannot be adapted to today's variety of fibers, washing temperatures and water conditions.

Surfactants in Detergents

A detergent is an effective cleaning product because it contains one or more surfactants. Because of their chemical makeup, the surfactants used in detergents can be engineered to perform well under a variety of conditions. Such surfactants are less sensitive than soap to the hardness minerals in water and most will not form a film.
Detergent surfactants were developed in response to a shortage of animal and vegetable fats and oils during World War I and World War II. In addition, a substance that was resistant to hard water was needed to make cleaning more effective. At that time, petroleum was found to be a plentiful source for the manufacture of these surfactants. Today, detergent surfactants are made from a variety of petrochemicals (derived from petroleum) and/or oleochemicals (derived from fats and oils).
Petrochemicals and Oleochemicals12Chem
Like the fatty acids used in soapmaking, both petroleum and fats and oils contain hydrocarbon chains that are repelled by water but attracted to oil and grease in soils. These hydrocarbon chain sources are used to make the water-hating end of the surfactant molecule.
Other Chemicals
Chemicals, such as sulfur trioxide, sulfuric acid and ethylene oxide, are used to produce the water-loving end of the surfactant molecule.
Alkalis
As in soapmaking, an alkali is used to make detergent surfactants. Sodium and potassium hydroxide are the most common alkalis.

How Detergent Surfactants Are Made

Anionic Surfactants13Chem
The chemical reacts with hydrocarbons derived from petroleum or fats and oils to produce new acids similar to fatty acids.
A second reaction adds an alkali to the new acids to produce one type of anionic surfactant molecule.
Nonionic Surfactants
Nonionic surfactant molecules are produced by first converting the hydrocarbon to an alcohol and then reacting the fatty alcohol with ethylene oxide.
14Chem
These nonionic surfactants can be reacted further with sulfur-containing acids to form another type of anionic surfactant.

How Soaps and Detergents Work

15Chem
These types of energy interact and should be in proper balance. Let's look at how they work together.
Let's assume we have oily, greasy soil on clothing. Water alone will not remove this soil. One important reason is that oil and grease present in soil repel the water molecules.
Now let's add soap or detergent. The surfactant's water-hating end is repelled by water but attracted to the oil in the soil. At the same time, the water-loving end is attracted to the water molecules.
These opposing forces loosen the soil and suspend it in the water. Warm or hot water helps dissolve grease and oil in soil. Washing machine agitation or hand rubbing helps pull the soil free.
16Chem

Soaps & Detergents: Human Safety

$
0
0

Soaps & Detergents: Human Safety

00sfty
As consumer needs and lifestyles change, and as new manufacturing processes become available, the soap and detergent industry responds with new products. A commitment to safety is a top priority from the time a company begins working on a new product and continues as long as the product is in the marketplace. Companies evaluate the safety of existing cleaning products by talking with consumers, reviewing scientific developments and monitoring product use data that may affect the safety assessment process.
To determine the safety of a cleaning product ingredient, industry scientists evaluate the toxicity of the ingredient. Toxicity is generally defined as any harmful effect of a chemical on a living organism, i.e., a human, an animal, a plant or a microorganism. Since all chemicals, including water (H2O), are toxic under certain conditions of exposure, scientists must consider a number of factors affecting exposure. These include the duration and frequency of exposure to the ingredient; the concentration of the ingredient at the time of exposure; and the route and manner in which the exposure occurs, e.g., eye, skin or ingestion. This information is essential whether assessing the effect on humans, animals, plants or microorganisms.
01sfty
Because human safety and environmental evaluations consider different types of exposures, they are evaluated by different procedures. The principal steps in the assessment process are, however, the same. They involve:
  • assembling existing data on toxicity and exposure;
  • determining where new information is needed and, if necessary, carrying out appropriate studies; and
  • determining whether predicted exposure levels are below levels that cause significant toxic effects.
This safety evaluation process enables scientists to predict the potential risk, if any, associated with the use of the ingredient or product, and determine if it is safe for consumers and the environment.
02sftyMedical science has long confirmed the important relationship between cleanliness and health. The regular use of cleaning products is fundamental to the health of our society and the well-being of its people.
Because cleaning products are part of our everyday lives, it is essential that they not present a significant risk to health. In considering the human safety of an individual ingredient or product, toxicologists (scientists who assess the safety of a chemical) are concerned with the effects from two types of exposures: intended and unintended. Intended exposures occur with use of a cleaning product according to the manufacturer's directions. Unintended exposures can result from misuse, through improper storage or by accidental contact, such as when a liquid detergent is splashed in the eye.
Hazards from these types of exposures are evaluated from information obtained through 04sfty03sftyacute (short-term) and chronic (long-term) tests and through a review of existing data. Expected exposure routes are considered as part of this evaluation.
Human safety evaluations begin with the specific ingredients and then move on to the whole product. The effects for all ingredients are considered as the product is formulated.
05sftyToxicologists compare the expected exposure to the expected effect during both product manufacture and use. How will workers be exposed in the plant? What is the intended use of the product? Is it to be diluted? Undiluted? Used daily in the home? Weekly in the workplace? Toxicologists also consider the expected effect of an unintended exposure. What is the potential hazard, for example, if a child drinks a product directly from the bottle?

If this human safety evaluation indicates an unacceptable risk, it may be possible to make the risk smaller by changing the manufacturing process; reformulating to reduce or eliminate an ingredient contributing to the toxic effect; or using labeling or a child-resistant closure. If the risk cannot be reduced, the product will not be marketed.
Even though manufacturers formulate cleaning products to ensure that they are safe or 06sftyhave very low risk, human health effects can still result from unintended exposure. To warn consumers about a specific hazard, household cleaning products carry cautionary labeling whenever necessary. For consumers, this is one of the most important features of the label.
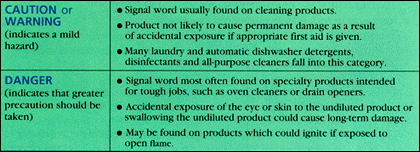

Federal regulations govern how precautionary statements related to human safety are used on household cleaning product labels. The regulations require that statements follow a standard format. There is first a "signal word," followed by a short description of the potential hazard. The following chart shows the signal words - CAUTION or WARNING and DANGER - and what they mean:
07sfty
POISON, which rarely appears on household cleaning products, is the strongest indication of hazard and means that accidental exposure could cause severe medical effects. The term may be found on household lye and on some car care products, such as antifreeze.
Along with the safety evaluation process and cautionary labeling, an extensive consumer education program on the proper use, storage and disposal of cleaning products supports the human safety efforts of the soap and detergent industry. In addition, the industry works closely with poison control centers to assure that, should an accidental exposure occur, treatment information is available to health care providers. Together, these activities enable consumers to use cleaning products with confidence in both their safety and performance.
usehold septic tank systems as well as municipal treatment plants. Two basic steps occur in the treatment of wastewater in both systems. The first step, called primary treatment, consists of the removal of solid material, such as grit or 12sftygrease, from the wastewater by physical means, i.e., settling and flotation in tanks. The second step, called secondary treatment, removes the dissolved material by biological means, i.e., consumption by microorganisms. It is in the secondary treatment stage where the most important process in reducing the exposure concentration of detergent ingredients occurs. This is called biodegradation. Biodegradation describes how organic (carbon-containing) detergent ingredients, like surfactants, enzymes and fragrances, are broken down into carbon 13sftydioxide, water and minerals by the action of microorganisms such as bacteria. At this stage, biodegradation reduces the amount of detergent ingredients discharged into the environment to levels that do not present a risk to fish or other aquatic life. Any small amounts of chemicals which are not biodegraded or removed during sewage treatment are diluted in surface waters, soil and the ocean. They continue to biodegrade or be removed from water by attaching to solids, a process known as adsorption.


S14sftyome inorganic (not carbon-containing) detergent ingredients, such as phosphates, zeolites and some dyes, also attach to solids, and are further treated during processing of the biosolids (sludge) produced in primary and secondary treatment. Biosolids are often used as fertilizers and soil conditioners.
Because of modern treatment methods, only an insignificant amount of the ingredients used to clean clothes, dishes, home and workplace surfaces actually reaches the environment. And that amount is at such levels as to not cause any adverse effects.

Improving Environmental Quality

The soap and detergent industry is committed to understanding the impact of its products and packages on the environment. With this understanding comes the ability to reduce their impact and improve their environmental quality.
Manufacturers of cleaning products have been leaders in reducing packaging waste and encouraging sound waste disposal practices. Advances in technology have resulted in products that are more concentrated, products that combine two functions in one, products with refill packages and packages that use recycled materials. Concentrated products need less energy to manufacture and transport, and require less packaging. Multifunctional products eliminate the need for separate packages. Refill packages allow consumers to reuse primary packages many times, decreasing the amount of packaging used and the volume of trash generated. Plastic and paperboard that would otherwise be thrown away become usable materials through recycling.
15sftyThrough education and community programs, the soap and detergent industry helps consumers learn how to reduce waste and how best to dispose of it. Consumers are reminded that the environmentally wise way of handling any household cleaning product is to buy only the amount that can be used; to use it all up or give it away; and, if it must be disposed, to dispose of it properly. As a rule of thumb, products designed for use with water should be disposed of by pouring down the drain; solid products such as scouring pads should be put into the trash.
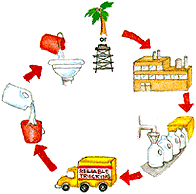
A promising method under development for improving16sfty the environmental quality of a product is life cycle assessment (LCA). LCA describes a "cradle-to-grave" look at all the environmental impacts of a product and its package, from acquiring raw materials through manufacture and distribution to consumer use and disposal. One advantage of LCA is that it can determine whether reducing an environmental impact in one area, such as manufacturing, shifts the impact to another, such as disposal. LCA also helps to identify where environmental improvement efforts should be focused.
Sound scientific information provides the foundation for the soap and detergent industry's commitment to safety. The industry maintains this commitment without compromising product performance, convenience or cost-effectiveness.

Heat wave: over 100 deaths on Saturday alone across AP

$
0
0

Heat wave: over 100 deaths on Saturday alone across AP

  • The NH-5 near Kanakadurgamma Varadhi wears a deserted look with people staying indoors to escape the heat wave conditions in Vijayawada on Saturday. Photo: Ch.Vijaya Bhaskar
    The Hindu
    The NH-5 near Kanakadurgamma Varadhi wears a deserted look with people staying indoors to escape the heat wave conditions in Vijayawada on Saturday. Photo: Ch.Vijaya Bhaskar
  • The NH-5 near Kanakadurgamma Varadhi wears a deserted look with people staying indoors to escape the heat wave conditions in Vijayawada on Saturday.- Photo: Ch.Vijaya Bhaskar
    The NH-5 near Kanakadurgamma Varadhi wears a deserted look with people staying indoors to escape the heat wave conditions in Vijayawada on Saturday.- Photo: Ch.Vijaya Bhaskar
The death toll due to heat mounted alarmingly in Andhra Pradesh with officials confirming 95 deaths while unconfirmed reports said more than 100 succumbed on Saturday alone. Prakasam district is the worst-hit with 40 casualties and Guntur followed with 20 deaths on a single day.
Nearly 200 people lost their lives owing to intense heat wave prevailing in the State for the last three days. Daily wage labourers, homeless people and the elderly were the worst hit. The mounting death toll has put the administration on tenterhooks and Chief Minister N. Chandrababu Naidu reviewed the situation with district collectors in Hyderabad.
Mr. Naidu announced an ex gratia of Rs. 1 lakh to the families of heat wave victims. Incidentally, the officials concerned paid Rs. 50,000 each to victims till Friday. The situation, according to Mr. Naidu, was alarming, as day temperatures were five to six degrees above normal and will continue to remain so for more than a week.
According to the Disaster Management department, 95 deaths were reported on Saturday alone. According to official figures, Prakasam registered highest deaths with 40 succumbing to the intense heat wave followed by Srikakulam (12), Visakhapatnam (15), Vizianagaram (8), Krishna (7), Nellore (6), East Godavari 4, Anantapur and West Godavari (2 each) and Guntur (1).
In Prakasam district, the toll rose to 77 with the 40 fatalities on Saturday. The district has been in the throes of its worst drought in 45 years, District Revenue Officer Noor Basha Qasim said. Most deaths were reported from Addanki, Erraguntlapalem, Markapur and V.V. Palem mandals in the district.
Prakasam Collector Sujatha Sharma said the deaths were due to sudden surge in day temperature and that drinking water camps would be set up across the district from Sunday. Arrangements were being made to distribute ORS sachets at public places free of cost.
Meanwhile, the administration in the districts stepped up relief measures and Krishna District Collector Babu A cancelled the weekly Mee Kosam grievance redressal programme scheduled on Monday due to heat wave conditions in the district. Interestingly, coastal districts registered high temperatures as compared to Rayalaseema districts, usually known for registering high temperatures during the season.
The heat wave continued unabated in Krishna with Nandigama and Vijayawada registering the highest maximum temperature of 47 degrees Celsius each. Bapatla in Guntur recorded 45.9 degrees Celsius followed by Ongole (44.3 degree Celsius). In Rayalaseema region, Anantapur and Kurnool districts recorded 41.2 degree Celsius.

Monday 25 May 2015 KAKINADA Weather Prediction

Weather Report and Forecast For: Kakinada Dated :May 24, 2015

$
0
0


Local Weather Report and Forecast For: Kakinada    Dated :May 24, 2015
Kakinada
Past 24 Hours Weather Data
Maximum Temp(oC)46.7
Departure from Normal(oC)8
Minimum Temp (oC)29.0
Departure from Normal(oC)1
24 Hours Rainfall (mm)NIL
Todays Sunset (IST)18;28
Tommorows Sunrise (IST)05;28
Moonset (IST)23;41
Moonrise (IST)10;50
Today's Forecast:sky condition would be partly cloud. Maximum & Minimum temperature would be around 47 & 30 respectively.
Date Temperature ( o C ) Weather Forecast
Minimum Maximum
25-May 29.0 47.0 Partly cloudy sky
26-May 29.0 47.0 Partly cloudy sky
27-May 29.0 46.0 Partly cloudy sky
28-May 29.0 46.0 Partly cloudy sky with Thundery development
29-May 29.0 45.0 Partly cloudy sky with Thundery development
30-May 29.0 44.0 Partly cloudy sky with possibility of rain or Thunderstorm


W-Underground Report

Actual
Average
Record
Temperature

Mean Temperature
38 °C
-

Max Temperature
46 °C
-
- ()
Min Temperature
29 °C
-
- ()
Cooling Degree Days
35


Growing Degree Days
50 (Base 50)


Moisture

Dew Point
22 °C


Average Humidity
43


Maximum Humidity
76


Minimum Humidity
11


Precipitation

Precipitation
0.0 mm
-
- ()
Sea Level Pressure

Sea Level Pressure
1001.75 hPa


Wind

Wind Speed
2 km/h ()


Max Wind Speed
6 km/h


Max Gust Speed
-


Visibility
7.0 kilometers


Events


T = Trace of Precipitation, MM = Missing Value
Source: Averaged Metar Reports
Daily Weather History Graph


MONTHLY REPORT


MaxAvgMinSum
Temperature
Max Temperature46 °C38 °C31 °C
Mean Temperature38 °C33 °C28 °C
Min Temperature31 °C27 °C24 °C
Degree Days
Heating Degree Days (base 65)0000
Cooling Degree Days (base 65)352619633
Growing Degree Days (base 50)504134989
Dew Point
Dew Point28 °C26 °C14 °C
Precipitation
Precipitation14.0 mm0.6 mm0.0 mm14.20 mm
Snowdepth- - - -
Wind
Wind11 km/h2 km/h0 km/h
Gust Wind- - -
Sea Level Pressure
Sea Level Pressure1011 hPa1006 hPa999 hPa

Monthly Weather History Graph

Monthly Weather History Graph


Setting up of a new Ammonia-Urea Complex at Namrup in Assam on Public Private Partnership (PPP) basis

$
0
0

Ministry of Chemicals and Fertilizers21-May, 2015 18:49 IST
Setting up of a new Ammonia-Urea Complex at Namrup in Assam on Public Private Partnership (PPP) basis

Financial restructuring of Brahmaputra Valley Fertilizer Corporation Limited

The Union Cabinet chaired by the Prime Minister, Shri Narendra Modi, today gave its approval for setting up of a new Ammonia-Urea Complex of 8.64 Lakh Metric Tonnes annual capacity with an estimated investment of Rs. 4500 crore at Namrup in Assam on Public Private Partnership (PPP) route by a Joint Venture (JV). In the proposed JV, a PSU of Department of Fertilizers namely Brahmaputra Valley Fertilizer Corporation Limited (BVFCL), Government of Assam and Oil India Limited (another PSU) shall have 11%, 11% and 26% equity holding respectively and balance 52% by private/public sector entity(ies) which would be inducted through a competitive bidding process.

The Cabinet also approved the financial restructuring of BVFCL by waiving off entire cumulative interest (Rs. 774.61 crore as on 31.03.2015) till date accrued on GOI loans & a loan of Rs. 21.96 crore and conversion of GOI loans of Rs. 594.71 crore as interest free loan. It will enable the BVFCL to participate as equity partner in this project and will sustain the operation of the existing plants during the interim period till the new plant comes into operation.

The setting up of a new Ammonia-Urea Complex will meet the growing demand of urea of North-East, Bihar, West Bengal and Jharkhand. It will also ease the pressure on infrastructure due to long distance transportation of Urea from Western and Central Regions and thereby saving in govt. subsidy on freight. It will accelerate the economic development of the region. The proposed plant will open new avenues for the people of the North-East.

The annual consumption of Urea in the country is approx. 310 LMT, out of which 230 LMT is produced indigenously and rest is imported. To enhance the production of urea indigenously, Govt. has earlier approved the revival of Talcher (Odisha) & Ramagundam (Telangna) units of Fertilizer Corporation of India Limited (FCIL) by PSUs through ‘nomination route’ and Barauni unit of Hindustan Fertilizer Corporation Limited (HFCL) & Gorakhpur unit of FCIL through ‘bidding route’. These four units will produce about 52 lakh MT of urea annually.

The new plant will be highly energy efficient unit of international standard with latest technology and with same amount of natural gas available to the existing units, the production of urea from the new unit will be more than double i.e. 3.6 to 8.64 lakh Metric Tonnes annually. With this, India is likely to start export of urea. Govt. would save about Rs. 600 crore annually due to reduction in cost of production and import substitution. The entire production of urea from this unit shall be neem coated so that benefits of neem coating are available to the farmers of the North-Eastern region also.

***


AKT/SH
(Release ID :121911)

Approval for revival of the Sindri unit of the Fertilizer Corporation India

$
0
0

Ministry of Chemicals and Fertilizers21-May, 2015 18:47 IST
Approval for revival of the Sindri unit of the Fertilizer Corporation India
The Union Cabinet chaired by the Prime Minister, Shri Narendra Modi, today gave its approval for the revival of closed urea unit of Fertilizer Corporation India Limited (FCIL) at Sindri (Jharkhand) with an investment of Rs 6000 crore.

This unit was lying defunct and was not in operation since 2002. Therefore, the unit and other associated facilities were lying unutilized. It is important to mention here that there is no functional urea unit in the Eastern part of the country except two small units at Namrup (Assam).

The annual consumption of urea in the country is approx. 310 LMT, out of which 230 LMT is produced indigenously and rest is imported. To enhance the production of urea indigenously, Govt. has earlier approved the revival of Talcher (Odisha) & Ramagundam (Telangana) units of FCIL by PSUs through ‘nomination route’ and Barauni unit of Hindustan Fertilizer Corporation Limited (HFCL) & Gorakhpur unit of FCIL through ‘Bidding route’. Now Sindri unit is approved for revival through ‘Bidding route’. Earlier, its revival was to be done through PSUs (SAIL & NFL).

The setting up of a new unit at Sindri will meet the growing demand of urea in the States of Bihar, West Bengal and Jharkhand. It will also ease the pressure on railway and road infrastructure due to long distance transportation of urea from Western and Central Regions and thereby saving in govt. subsidy on freight. It will also accelerate the economic development of the region. Apart from growth of regional economy, this unit will create opportunities for 500 direct and 3000 indirect employments.

The CCEA earlier had approved gas pooling for urea sector which will enable the unit to get gas at pooled price on its revival which will make the urea units globally competitive.

***


AKT/SH
(Release ID :121909)

Biodiversity for Sustainable Development’

$
0
0

Ministry of Environment and Forests22-May, 2015 08:55 IST
‘Biodiversity for Sustainable Development’

Environment Minister’s Message on International Day for Biological Diversity
As we celebrate the 2015 International Day for Biological Diversity, let us work together for conserving biodiversity to ensure the future we want for us and our coming generations. For, we have borrowed this earth from our children, and not inherited it from our ancestors.”
The Minister of State (Independent Charge) of Environment, Forest and Climate Change, Shri Prakash Javadekar, has emphasised the need to work together to conserve biodiversity to ensure the future for the present generation and the coming generations. In his message on International Day for Biological Diversity being celebrated today, Shri Javadekar said that this earth has been borrowed from children and not inherited from ancestors. The Minister said that the imperative challenge before India is to imbibe and translate the theme of Biodiversity for Sustainable Development, due to its privileged status as a megabiodiverse country, past and projected demographic transitions and commitment to democracy as a political principle.

International Day for Biological Diversity is celebrated to recognize the pivotal role of biodiversity to life on earth and human well-being, as well as to increase awareness of the importance of biodiversity and the threats to it. It was on this day in 1992 that the text of the Convention of Biodiversity was adopted. This year’s theme is ‘Biodiversity for Sustainable Development’. During the preceding years, Biodiversity and Poverty Alleviation in 2003, Biodiversity: Food, Water and Health for All in 2004, Biodiversity: Life Insurance for our Changing World in 2005, Protect Biodiversity in Drylands in 2006 and Biodiversity and Agriculture in 2008, have been some of the other themes.

The International Day for Biological Diversity is being celebrated all over the country today. The main event is being held in Srinagar, Jammu & Kashmir.

Following is the text of the message:

“Today we celebrate the International Day for Biological Diversity, to recognise the pivotal role of biodiversity to life on earth and human well-being. On this day in 1992, the text of the Convention on Biological Diversity (CBD) was adopted. To mark this, 22nd May has been proclaimed by the United Nations as the International Day for Biological Diversity, to increase awareness about the importance of and threats to biodiversity.

The theme this year, ‘Biodiversity for Sustainable Development’ is very topical, as the international community accelerates its efforts to define the post-2015 agenda, including adopting a set of goals for sustainable development.

This year’s theme reflects the bigger and very crucial paradigm shift that the world has undergone from seeing ‘development’ and ‘environment’ as two ends of a spectrum, where one must be compromised in order to enhance the other, to having development while protecting environment.

Biodiversity, the variety of life on earth, is vital to social and economic development, and is indeed fundamental to our survival. Over the years, retrospective wisdom and the development experience have guided us in favour of the commonsensical understanding that protecting the variety of life forms and their infinitely complex interactions, form the very basis for long-lasting and inclusive development. In other words, environment, or more specifically biodiversity and its invaluable and often irreplaceable ecosystem services, from the air we breathe to the water we drink, are the very foundation on which viable long-term development rests. Former themes for the International Day for Biological Diversity have captured this fact in snippets. Past themes have been: Biodiversity and Poverty Alleviation (2003); Biodiversity: Food, Water and Health for All (2004); Biodiversity: Life Insurance for our Changing World (2005); Protect Biodiversity in Drylands (2006); and Biodiversity and Agriculture (2008) among others.

The challenge before India to imbibe and translate the theme of ‘Biodiversity for Sustainable Development’ is imperative in the light of our privileged status as a megabiodiverse country, past and projected demographic transitions and commitment to democracy as a political principle. These three facets make it non-negotiable that we galvanise the political will, scientific and technological know-how and financial resources to contribute to the agenda set out in the outcome document from the Rio+20 Conference, ‘The future we want’.

Nature has generously endowed our country. With only 2.4% of the world’s land area, India has 7-8% of the recorded species of the world, with over 46,000 species of plants and 91,000 species of animals. India is also an acknowledged centre of crop diversity, and harbours many wild and domesticated animals, fish and millions of microbes and insects. The ecosystem diversity is also unparalleled. These are the strengths to draw upon to meet the goals of ending poverty and hunger; achieving food security and improved nutrition and promoting sustainable agriculture; ensuring healthy lives and promoting well-being for all at all ages; ensuring availability and sustainable management of water and sanitation for all and in making cities and human settlements inclusive, safe, resilient and sustainable. Promoting multiple varieties of staple foodgrains; switching to cropping patterns, wider seed and plant variety choices, water conservation and utilisation patterns, and farming practices that combine the best of traditional wisdom and science with a whole-system perspective; valuing the therapeutic properties and medicinal uses of various parts of plants and animals; all form key aspects of the way ahead.

Communities that are inclusive and resilient are also the only ones that will be safe in the long run. The income-poor in India and the world over face the negative fallouts of depleting and degraded natural resources in disproportionate measure to those who are responsible for such depletion and degradation. Sustainable development rests on a viable and sound natural resource base.


The future we want, thus depends heavily on the restorative and ameliorative action that we engage with, in relation to our wealth in biodiversity today. This challenge can only be met with broad stakeholder participation. From the right knowledge, to the right resources and the right spirit of working together for the common good, may the International Day for Biological Diversity 2015 help us draw on synergies and strengths across sectors to achieve the vision of Biodiversity for Sustainable Development.

The Day is being celebrated all over the country by different States and organisations. The main event is being held in Srinagar in the State of Jammu & Kashmir. In this event, the BIOFIN India project is being formally launched today with the release of a brochure. Another brochure on announcement of India Biodiversity Awards 2016, the third in the series is being released today, along with a release of a publication on good models of biodiversity governance emanating from India Biodiversity Awards 2014. Also being released today is an India Business and Biodiversity Initiative publication on best practices on biodiversity management by some companies.

As we celebrate the 2015 International Day for Biological Diversity, let us work together for conserving biodiversity to ensure the future we want for us and our coming generations. For, we have borrowed this earth from our children, and not inherited it from our ancestors.”

*****


HK
(Release ID :121919)


Weather Report and Forecast For: Kakinada Dated :May 25, 2015

$
0
0

Local Weather Report and Forecast For: Kakinada    Dated :May 25, 2015  SOURCE IMD
Kakinada
Past 24 Hours Weather Data
Maximum Temp(oC)46.1
Departure from Normal(oC)8
Minimum Temp (oC)29.4
Departure from Normal(oC)1
24 Hours Rainfall (mm)NIL
Todays Sunset (IST)18;29
Tommorows Sunrise (IST)05;27
Moonset (IST)-
Moonrise (IST)11;39
Today's Forecast:Sky condition would be partly cloudy. RA/TS may occur in parts of city. Maximum & Minimum temperatures would be around 46 and 30 degrees Celsius respectively.
Date Temperature ( o C ) Weather Forecast
Minimum Maximum
26-May 30.0 46.0 Partly cloudy sky with Thundery development
27-May 30.0 46.0 Partly cloudy sky with Thundery development
28-May 29.0 45.0 Partly cloudy sky with Thundery development
29-May 29.0 45.0 Partly cloudy sky with possibility of rain or Thunderstorm
30-May 29.0 44.0 Partly cloudy sky with possibility of rain or Thunderstorm
31-May 29.0 44.0 Partly cloudy sky with possibility of rain or Thunderstorm

Tuesday prediction


Monday, May 25, 2015 SOURCE WUNDERGROUND

ActualAverage Record
Temperature 
Mean Temperature38 °C -  
Max Temperature46 °C - - ()
Min Temperature29 °C - - ()
Cooling Degree Days34  
Growing Degree Days50 (Base 50)  
Moisture 
Dew Point23 °C  
Average Humidity45  
Maximum Humidity77  
Minimum Humidity16  
Precipitation 
Precipitation0.0 mm - - ()
Sea Level Pressure 
Sea Level Pressure1001.62 hPa  
Wind 
Wind Speed2 km/h ()  
Max Wind Speed9 km/h  
Max Gust Speed -   
Visibility7.0 kilometers  
Events    
T = Trace of Precipitation, MM = Missing ValueSource: Averaged Metar Reports

Daily Weather History Graph

Daily Weather History Graph 


Month of May, 2015


MaxAvgMinSum
Temperature 
Max Temperature46 °C38 °C31 °C
Mean Temperature38 °C33 °C28 °C
Min Temperature31 °C27 °C24 °C
Degree Days 
Heating Degree Days (base 65)0000
Cooling Degree Days (base 65)352719690
Growing Degree Days (base 50)5041341077
Dew Point 
Dew Point28 °C26 °C14 °C
Precipitation 
Precipitation14.0 mm0.6 mm0.0 mm14.20 mm
Snowdepth - - - -
Wind 
Wind11 km/h2 km/h0 km/h
Gust Wind - - -
Sea Level Pressure 
Sea Level Pressure1011 hPa1006 hPa999 hPa

Monthly Weather History Graph

Monthly Weather History Graph


PM's letter to citizens on completion of 1 year of Govt

$
0
0

With best regards,
"Seven Billion Dreams. One Planet. Consume with Care."
(2015)
Dr. AMAR NATH GIRI
EHSQ , NFCL
M.Sc. -Environmental Science,Ph.D -Environmental Science law& DIPLOMA AS - P.G.D.E.P.L,CES, DCA,
EX IIM LUCKNOW FELLOW, EX RESEARCH SCIENTIST
IGIDR-MUMBAI 
9912511918
amarnathgiri@nagarjunagroup.com
http://www.nagarjunagroup.com
http://www.nagarjunafertilizers.com 
EHSQ BLOG : http://dramarnathgiri.blogspot.in/?view=magazine
http://dramarnathgiri.blogspot.in/2013/10/curriculum-vitae-of-dr-amar-nath-giri.html?q=BIO+DATA
http://dramarnathgiri.blogspot.in/2012/05/nagarjuna-management-services.html

---------- Forwarded message ----------
From: Prime Minister's Office<no-reply@sampark.gov.in>
Date: Wed, May 27, 2015 at 12:56 AM
Subject: PM's letter to citizens on completion of 1 year of Govt
To: goswami248@gmail.com


Having trouble reading this email? View it in your mobile/ web browser

My dear fellow citizens!

Service, in our Indian ethos is the ultimate duty – Seva Parmo Dharma. One year ago, you had entrusted me with the responsibility and honour of serving you as your . I have devoted every moment of every day, and every element of my body and spirit, in fulfilling the same with fullest sincerity and honesty.

We assumed office at a time when confidence in the India story was waning. Un-abated corruption and indecisiveness had paralyzed the government. People had been left helpless against ever climbing inflation and economic insecurity. Urgent and decisive action was needed.

We systematically went about addressing these challenges. Runaway prices were immediately brought under control. The languishing economy was rejuvenated, building on stable, policy-driven proactive governance. Discretionary allotment of our precious natural resources to a chosen few was replaced with transparent auctions. Firm steps were taken against Black Money, from setting up a SIT and passing a stringent black money law, to generating international consensus against the same. Uncompromising adherence to the principle of purity, in action as well as intent, ensured a corruption-free government. Significant changes have been brought about in work culture, nurturing a combination of empathy as well as professionalism, systems as well breaking of silos. State governments have been made equal partners in the quest for national development, building the spirit of Team India. Most importantly, we have been able to restore Trust in the government.

Guided by the principle of Antyodaya, our Government is dedicated to the poor, marginalized and those left behind. We are working towards empowering them to become our soldiers in the war against poverty. Numerous measures and schemes have been initiated – from making school toilets to setting up IITs, IIMs and AIIMS; from providing a vaccination cover to our children to initiating a people-driven Swachh Bharat mission; from ensuring a minimum pension to our labourers to providing social security to the common man; from enhancing support to our farmers hit by natural calamities to defending their interests at WTO; from empowering one and all with self attestation to delivering subsidies directly to people’s banks; from universalizing the banking system to funding the unfunded small businesses; from irrigating fields to rejuvenating Ma Ganga; from moving towards 24x7 power to connecting the nation through road and rail; from building homes for the homeless to setting up smart cities, and from connecting the North-East to prioritizing development of Eastern India.


Friends, this is just the beginning. Our objective is to transform quality of life, infrastructure and services. Together we shall build the India of your dreams and that of our freedom fighters. In this, I seek your blessings and continued support.

Always in your Service,
Jai Hind!

Join PM on Facebook
Join PM on Twitter
Interact with PM
Know the PM
Give your Suggestions

Weather Report and Forecast For: Kakinada Dated :May 26, 2015

$
0
0

Local Weather Report and Forecast For: Kakinada    Dated :May 26, 2015
Kakinada
Past 24 Hours Weather Data
Maximum Temp(oC)43.0
Departure from Normal(oC)5
Minimum Temp (oC)30.3
Departure from Normal(oC)2
24 Hours Rainfall (mm)NIL
Todays Sunset (IST)18;29
Tommorows Sunrise (IST)05;27
Moonset (IST)00;20
Moonrise (IST)12;27
Today's Forecast:Sky condition would be generally cloudy. RA/TS may occur Maximum & Minimum temperatures would be around 43 and 29 degrees Celsius respectively.
Date Temperature ( o C ) Weather Forecast
Minimum Maximum
27-May 29.0 43.0 Partly cloudy sky with Thundery development
28-May 30.0 43.0 Partly cloudy sky with Thundery development
29-May 30.0 42.0 Partly cloudy sky with Thundery development
30-May 30.0 42.0 Partly cloudy sky
31-May 30.0 42.0 Partly cloudy sky
01-Jun 30.0 42.0 Partly cloudy sky


PREDICTION OF TODAY


W UNDERGROUND REPORT

Actual
Average
Record
Temperature

Mean Temperature
36 °C
-

Max Temperature
43 °C
-
- ()
Min Temperature
30 °C
-
- ()
Cooling Degree Days
32


Growing Degree Days
48 (Base 50)


Moisture

Dew Point
26 °C


Average Humidity
58


Maximum Humidity
74


Minimum Humidity
28


Precipitation

Precipitation
0.0 mm
-
- ()
Sea Level Pressure

Sea Level Pressure
1001.88 hPa


Wind

Wind Speed
5 km/h ()


Max Wind Speed
9 km/h


Max Gust Speed
-


Visibility
7.0 kilometers


Events


T = Trace of Precipitation, MM = Missing Value
Source: Averaged Metar Reports
Daily Weather History Graph


MaxAvgMinSum
Temperature
Max Temperature46 °C38 °C30 °C
Mean Temperature38 °C33 °C28 °C
Min Temperature30 °C28 °C24 °C
Degree Days
Heating Degree Days (base 65)0000
Cooling Degree Days (base 65)352719721
Growing Degree Days (base 50)5042341124
Dew Point
Dew Point28 °C26 °C14 °C
Precipitation
Precipitation14.0 mm0.5 mm0.0 mm14.20 mm
Snowdepth- - - -
Wind
Wind11 km/h2 km/h0 km/h
Gust Wind- - -
Sea Level Pressure
Sea Level Pressure1011 hPa1006 hPa999 hPa

Monthly Weather History Graph

Monthly Weather History Graph


Heat wave toll at 1242; AP, Telangana account for 1192 deaths=worried

$
0
0

Heat wave toll at 1242; AP, Telangana account for 1192 deaths


As per the latest figures, the toll due to heat wave in Andhra Pradesh stood at 852 while it was 340 in Telangana - together accounting for 1192 deaths.

NEW DELHI: The intense heat wave sweeping through many parts of the country has claimed 1242 lives over the last few days, with Andhra Pradesh and Telangana bearing the brunt as these two states account for most of the deaths.

As per the latest figures, the toll due to heat wave in Andhra Pradesh stood at 852 while it was 340 in Telangana - together accounting for 1192 deaths.

In Telangana, 74 deaths were reported since yesterday.

The heat wave is likely continue for another two days in Telangana and three days in Coastal Andhra Pradesh, said YK Reddy, Director of Meteorological Centre, Hyderabad.

He said the deaths could be taking place due to exposure to heat for long durations.

The plains of Uttar Pradesh continued to reel under scorching heat with mercury in Agra today crossing the 46 degrees mark, making it the hottest place in the state.

The heat wave conditions continued to sweep Haryana and Punjab as well, with maximum temperatures today again hovering between 41-45 degrees celsius at most places.

In Andhra Pradesh, Prakasam district recorded the highest number of deaths at 202. Guntur district saw death of 130 people followed by Visakhapatnam (112), Vizianagaram (78) and Nellore 74.

The toll in other districts was East Godavari-90, West Godavari 10, Krishna 49, Chittore 29, Kadapa 22, Kurnool 17, Anantapur 14, Srikaukulam 25.

The government had issued an alert to doctors to be ready to provide medical assistance to the heat wave-affected people, he said.

In Telangana, Nalgonda recorded the maximum number of deaths at 99, followed by Khammam 72, Karimnagar 45 and Mahabubnagar 37, a senior official of State Disaster Management Department told PTI.

Medak recorded 29 deaths, Adilabad 22, Nizamabad and Warangal 11 each followed by Hyderabad and Ranga Reddy at 7 each, the official said.

43 deaths due to heat wave are reported from Odisha while seven have died in Gujarat.

Weather Report and Forecast For: Kakinada Dated :May 27, 2015

$
0
0
Local Weather Report and Forecast For: Kakinada    Dated :May 27, 2015
Kakinada
Past 24 Hours Weather Data
Maximum Temp(oC)37.2
Departure from Normal(oC)-1
Minimum Temp (oC)29.5
Departure from Normal(oC)1
24 Hours Rainfall (mm)NIL
Todays Sunset (IST)18:29
Tommorows Sunrise (IST)05:27
Moonset (IST)00:58
Moonrise (IST)13:14
Today's Forecast:Sky condition would be partly cloudy. RA/TS may occur in parts of city. Maximum & Minimum temperatures would be around 38 and 29 degrees Celsius respectively.
Date Temperature ( o C ) Weather Forecast
Minimum Maximum
28-May 29.0 39.0 Partly cloudy sky with Thundery development
29-May 29.0 38.0 Partly cloudy sky with Thundery development
30-May 29.0 38.0 Partly cloudy sky
31-May 28.0 38.0 Partly cloudy sky
01-Jun 28.0 38.0 Partly cloudy sky
02-Jun 28.0 38.0 Partly cloudy sky


ActualAverage Record
Temperature 
Mean Temperature33 °C -  
Max Temperature37 °C - - ()
Min Temperature29 °C - - ()
Cooling Degree Days27  
Growing Degree Days42 (Base 50)  
Moisture 
Dew Point28 °C  
Average Humidity70  
Maximum Humidity82  
Minimum Humidity56  
Precipitation 
Precipitation0.0 mm - - ()
Sea Level Pressure 
Sea Level Pressure1002.62 hPa  
Wind 
Wind Speed2 km/h ()  
Max Wind Speed6 km/h  
Max Gust Speed -   
Visibility7.0 kilometers  
Events    
T = Trace of Precipitation, MM = Missing ValueSource: Averaged Metar Reports

Daily Weather History Graph

Daily Weather History Graph


MaxAvgMinSum
Temperature 
Max Temperature46 °C38 °C30 °C
Mean Temperature38 °C33 °C28 °C
Min Temperature30 °C28 °C24 °C
Degree Days 
Heating Degree Days (base 65)0000
Cooling Degree Days (base 65)352719747
Growing Degree Days (base 50)5042341165
Dew Point 
Dew Point29 °C26 °C14 °C
Precipitation 
Precipitation14.0 mm0.5 mm0.0 mm14.20 mm
Snowdepth - - - -
Wind 
Wind11 km/h2 km/h0 km/h
Gust Wind - - -
Sea Level Pressure 
Sea Level Pressure1011 hPa1006 hPa999 hPa

Monthly Weather History Graph

Monthly Weather History Graph


Viewing all 8165 articles
Browse latest View live