Quantcast
Channel: EHSQL(Environment-Energy ,Health,Safety, Security and Social Ac. ,Quality-Lab) Technical services
Viewing all 8075 articles
Browse latest View live

Constitutional provision and the environmental protection

$
0
0
The Constitution of India came into force on 26th January, 1950. Originally, the constitution contains no specific provisions for environmental protection. However, certain specific provision have been incorporated by the Constitution (Forty Second Amendment) Act, 1976 and subsequent amendments. Indian Constitution is one of the very few constitutions in t he world, which provides for specific provision for the protection and improvement of the Environment.
The constitution, being the fundamental law of the land has a binding force on citizens, non – citizens as well as the State. The Fundamental Rights and the Directive Principles of the State Policy underline our national commitment to protect and improve the environment. The courts in India have also given a new interpretation to the constitutional provision relating to protection and improvement of the environment (the intended meaning of the environment in the constitution) may be explained with reference to the following head:
1. The Constitution Forty Second Amendment.
2. Federal System of Govt. (Distribution of Legislative Power).
3. Fundamental Rights.
4. Directive Principles of State Policy; and
5. Fundamental
1. Constitution Forty Second Amendment: - In 1976, under the leadership of the then Prime Minister, Smt. Indira Gandhi, the Constitution (Forty Second Amendment) Act was passed and the provisions relating to the protection of environment for the first time were incorporated by adding a new provision Article 48-A in the Chapter, Directive Principles of State Policy.
According to Article 48-A “the State shall Endeavour to protect and improve the environment and to safeguard the forests and wildlife of the country”.
Further, a new provision Article 51-A in the form of “Fundamental Duties” was also incorporated by the 42nd Amendment. According to the sub-clause (g) of Art. 51-A, “it shall be the duty of every citizen of India to protect and improve the natural environment including forests, lakes, rivers and wildlife and to have compassion for living creatures”. The above two provision impose two-fold responsibilities. On the one hand, it gives directive to the State for protection and improvement of environment, and on the other hand it casts/imposes a duty on every citizen to help in the preservation of natural environment.
2. Federal System of Government (Distribution of Legislative Power):-
From environmental point of view, allocation of legislative authority is very important. The constitution of India deals exhaustively with legislative powers pertaining to environmental law. The legislative powers under the scheme of the constitution is divided into three lists viz., the Union List or List – I, the State List or List –II, the Concurrent List or List – III. Part – XI (Arts. 245-263) of the constitution provides for the distribution of legislative powers between the union and the states. Article 246 distributes the subjects of legislative power in these three lists between the Centre and the States. The union list contains 97 subjects and the Parliament alone has the power to legislate. The State List contains 66 subjects and the States have power to legislate. However, in respect of Concurrent List, which contains 52 subjects, both the Parliament and the State Legislatures have the power to legislate. There are about 200 Central and State Legislation on environmental protection. The most important environmental legislation, passed by the parliament under Art. 249 of the Constitution are The Water (Prevention and Control of Pollution) Act, 1974; The Air (Prevention and Control of Pollution) Act, 1974; The Air (Prevention and Control of Pollution) Act, 1981; and the Environment (Protection) Act, 1986.
3. Fundamental Rights:- Part –III of the Constitution, containing Arts. 12 to 35, deals with fundamental rights. Articles 15(2)(b); Art. 21 and Art. 24 provide for specific provision for environmental protection.
Article 15(2)(b):- According to Art. 15(2)(b), “No citizen shall, on grounds only of religion, race, caste, sex, place of birth or any of them be subjected to any disability, liability, restriction or condition with regard to: the use of wells, bathing ghats, roads and places of public resort, maintained wholly or partly out for state funds or dedicated to the use of general public:. In simple words, Art. 15(2) prohibits discrimination on the ground of sex, race, religion, caste, place of birth etc. to make use of the public places the general public. The public places, which are part and parcel of the human environment should be made available to the public. The preamble to our constitution ensures socialistic pattern of the society and decent standard of life, which can be pollution free environment.
Article 21:- According to Article 21 of the constitution, “no person shall be deprived of his life or personal liberty except according to procedure established by law”.
Article 21 is the heart of the fundamental rights and has received expanded meaning from time to time after the decision of the Supreme Court in Maneka Gandhi vs. Union of India, (AIR 1978 SC 597). Art. 21 guarantees a fundamental right to life –a life of dignity to be lived in a proper environment, free of danger of disease and infection. The right to live in a healthy environment as part of Art. 21 of the Constitution was first recognized in the case of.
Rural Litigation and Entitlement Kendra vs. State of U.P., AIR 1988 SC 2187 (Popularly known as Dehradun Quarrying Case).
It is the first case of this kind in India, involving issues relating to environment and ecological balance. The R.L. & E. Kendra and others in a letter to the Supreme Court complained about the illegal / unauthorized mining in the Missouri, Dehradun belt. As a result, the ecology of the surrounding area was adversely affected and it led to the environmental disorder.
The Supreme Court treated the letter as writ petition under Art. 32 of the Constitution and directed to stop the excavation (illegal mining) under the Environment (Protection) Act, 1986. The respondents contended / argued that the write petition was registered in 1983 and the Environment (Protection) Act was passed in 1986 and hence the criminal proceedings cannot be initiated with retrospective effect. The court rejected the contention of the respondents and held that the provisions of procedural law shall apply to ordinary criminal cases and not to the environmental cases. The court directed the Central and State Governments to take necessary steps to prevent illegal mining and to re-afforesation in the area of mining.
In M.C. Mehta vs. Union of India, AIR 1987 SC 1086 (Popularly known as “Oleum Gas Leak Case”) – The Supreme Court treated the right to live in pollution free environment as a part of fundamental right to life under Art. 21 of the Constitution. Further the A.P. High Court in T. Damodar Rao vs. S.O., Municipal Corporation, Hyderabad, (AIR 1987 A.P. 171) laid down that right to live in healthy environment was specially declared to be part of Art. 21 to the Constitution.
Article 24: Article 24 of the Constitution speaks about exploitation of child labour. It says that “No child below the age of 14 years shall be employed to wok in any factory or mine or engaged in any other hazardous employment” this provisions is certainly in the interest of public health and part of the environment. Further, Art. 39 (e) and 39 (f) under Directive Principles of State Policy provide for the protection of the health and strength of children below the age of 14 years.
In people’s Union for Democratic Rights vs. Union of India, (AIR 1982 SC 1473), the Supreme Court held that the prohibition under Art. 24 could be enforced against any one, be it the State or private individual.
In pursuance of this obligation, parliament enacted the Child Labour (prohibition and Regulation) Act, 1986. The Act prohibits specifically the employment of children in certain industries.
4. Directive Principles of State Policy:- Part IV of the Constitution, Containing Articles 36 to 51, deals with Directive Principles of State Policy. The directive principles form the fundamental feature and are designed to achieve socio economic goals.
Art. 39 (a), which was inserted by the Constitution 42nd Amendment) Act, 1976 provides for Equal Justice and Free Legal Aid. It promotes justice on the basis of equal opportunities. It imposes an imperative duty upon the State to provide free legal aid to the poor litigant so as to secure him equal protection of laws against his well – to – do opponent.
1. Equal right of men and women to adequate means of livelihood.
2. Distribution of ownership and control of the material resources community to the common good.
3. To ensure that the economic system should not result in concentration of wealth and means of production to the common detriment.
4. Equal pay for equal work for both men and women.
5. To protect health and strength of workers and tender age of children and to ensure that they are not forced by economic necessity to entire avocations unsuited to their age or strength; and
6. That children are given opportunities and facilities to develop in a healthy manner and in conditions of freedom and dignity and that childhood and youth are protected against exploitation and against moral and material abandonment.
Article 39(b):- The expression ‘material source’ under Art. 39 (b) means all things, which are capable producing wealth for the community. In includes those, which are already vested in the State but also in the hands of private individuals. Further, the expression ‘distribution’ in Art. 39 (b) does not mean that one’s property is taken over and is distributed to others. It also includes nationalization which is an effective means to prevent concentration of wealth in a few hands so as to benefit the society at large.
Article 39(1):- Art. 39(1) was amended by the Constitution (42nd Amendment) Act, 1976 with a view to emphasize the constructive role of the State with regard to children.
Article 47:- Art. 47 provides that the State shall regard the raising of the level of nutrition and the standard of living of its people and the improvement of public health as among its primary duties. The improvement of public health also includes the protection and improvement of environment without which public health cannot be assured.
Article 48:- It deals with organization of agriculture and animal husbandry. Art. 48 directs the State to take steps to organize agriculture and animal husbandry on modern and scientific lines. In particular, it should take steps for preserving and improving the breeds and prohibiting the slaughter of cows and calves and other milch and draught cattle.
Article 49:-It deals with protection of monuments and places and objects of national importance. Art. 49 requires the State to protect c-very monument or place or object of artistic or historic interest (declared by or under law made by parliament to be of national importance) from spoliation, disfigurement, destruction, removal, disposal or export.
5. Fundamental Duties (51-A):- Art. 51-A was added under the Constitution (42nd Amendment) Act. 1976, which deals with 'Fundamental Duties' under Part IV-A. Art. 51 -A enlists ten fundamental duties designed for restructuring and building a welfare society 'State
Art. 51 -A(g) specifically deals with the fundamental duty with respect to environment. It provides "it shall be the duty of every citizen of India to protect and improve the natural environment including forests, lakes, rivers and wild life and to have compassion for living creatures. (To put it simply Art. 51-A(g) refers to the fundamental duty of every citizen to protect and improve 'natural environment'.

Properties of Ammonia

$
0
0
Properties of Ammonia
Ammonia
Ammonia
Ammonia is a chemical consisting of one atom of nitrogen and three atoms of hydrogen. It is designated in chemical notation as NH3. Ammonia is extremely soluble in water and is frequently used as a water solution called aqua ammonia. Ammonia chemically combines with water to form ammonium hydroxide. Household ammonia is a diluted water solution containing 5 to 10 percent ammonia. On the other hand, anhydrous ammonia is essentially pure (over 99 percent) ammonia. "Anhydrous" is a Greek word meaning "without water;" therefore, anhydrous ammonia in ammonia without water.
Refrigerant grade anhydrous ammonia is a clear, colorless liquid or gas, free from visible impurities. It is at least 99.95 percent pure ammonia. Water cannot have a content above 33 parts per million (ppm) and oil cannot have a content above 2 ppm. Preserving the purity of the ammonia is essential to ensure proper function of the refrigeration system.
  • Keeping Ammonia Pure
  • Physical Properties
  • Chemical Properties
  • Health Effects


Keeping Ammonia Pure
Impurities can enter the ammonia system:
  • While charging the system.

  • Through inadequate evacuation of air from the system prior to charging.

  • From valve stem packing.

  • From piping repairs.

  • From piping leaks.

  • From the normal breakdown of ammonia.
Potential Hazards:
  • Release of ammonia due to excess water within the system freezing, which causes broken pipes and equipment.

  • Ineffective refrigeration due to excess oil within the system, causing the system to work harder than necessary, thus stressing the system components.

  • Oxygen levels of more than a few ppm in liquid ammonia or a few thousand ppm in gaseous ammonia can promote stress corrosion cracking in steels.

    • This may result in a catastrophic failure of bulk storage vessels.

    • This may result in ammonia weeping from a crack within the refrigeration system.

    • Stress corrosion cracking proceeds more rapidly at high temperatures.
Possible Controls:
  • Provide employees information pertaining to the hazards of ammonia. [29 CFR 1910.119(d)(1)]

    • Ensure ammonia being introduced to the system is refrigerant grade.

    • See Physical and Chemical properties of ammonia for more information.
  • Conduct a process hazard analysis. [29 CFR 1910.119(e)]

  • Provide operating procedures [29 CFR 1910.119(f)] to ensure proper operation of the system.

    • Follow operating procedures for charging the system to prevent impurities from being introduced.
       
  • Provide training specific to the handling of ammonia. [29 CFR 1910.119(g)]

  • Conduct a pre-startup safety review prior to introducing ammonia when the equipment is new or modified significantly enough to require a change in the process safety information. [29 CFR 1910.119(i)]

    • Ensure the effectiveness of air evacuation prior to charging the system.
       
  • Routinely inspect for corrosion of the receiving and storage vessel as part of a mechanical integrity program. [29 CFR 1910.119(j)]

    • Install a non-condensable gas (oil and water) separator (purge units) into the system.

      • Maintain the purge unit according to manufactures specifications.
         
    • Test and analyze the ammonia periodically for oxygen and water content.

    • Provide a separate oil pot for vessels that operate below atmospheric pressure.
  • Establish and implement written procedures to manage changes to equipment, procedures, and to facilities. [29 CFR 1910.119(l)]

  • Investigate incidents. [29 CFR 1910.119(m)]

    • Investigate accidents and near misses that could have resulted in a release of ammonia.
  • Establish and implement an emergency action plan in case of release. [29 CFR 1910.119(n)]

Additional References:
  • Bulletin No. 108. Guidelines for Water Contamination in Ammonia Refrigeration Systems. International Institute for Ammonia Refrigeration (IIAR), (1986). Offers insights on where the water can come from and how to minimize continued infiltration. Provides an analytical approach to quantifying water concentrations, and recommends apparatus to remove the water.. See the Table of Contents.

  • Bulletin No. 110. Guidelines for Start-Up, Inspection, and Maintenance of Ammonia Mechanical Refrigerating Systems. International Institute for Ammonia Refrigeration (IIAR), (1993, March). Covers ammonia characteristics and hazards, inspection and maintenance of equipment, start-up issues, reference standards, safety equipment, and log book record-keeping. See the Table of Contents.


Physical Properties
Anhydrous ammonia is a clear liquid that boils at a temperature of -28°F. In refrigeration systems, the liquid is stored in closed containers under pressure. When the pressure is released, the liquid evaporates rapidly, generally forming an invisible vapor or gas. The rapid evaporation causes the temperature of the liquid to drop until it reaches the normal boiling point of -28°F, a similar effect occurs when water evaporates off the skin, thus cooling it. This is why ammonia is used in refrigeration systems.

Liquid anhydrous ammonia weighs less than water. About eight gallons of ammonia weighs the same as five gallons of water.

Liquid and gas ammonia expand and contract with changes in pressure and temperature. For example, if liquid anhydrous ammonia is in a partially filled, closed container it is heated from 0°F to 68°F, the volume of the liquid will increase by about 10 percent. If the tank is 90 percent full at 0°F, it will become 99 percent full at 68°F. At the same time, the pressure in the container will increase from 16 pounds per square inch (psi) to 110 psi.

Liquid ammonia will expand by 850 times when evaporating:

Anhydrous ammonia gas is considerably lighter than air and will rise in dry air. However, because of ammonias tremendous affinity for water, it reacts immediately with the humidity in the air and may remain close to the ground.

The odor threshold for ammonia is between 5 - 50 parts per million (ppm) of air. The permissible exposure limit (PEL) is 50 ppm averaged over an 8 hour shift. It is recommended that if an employee can smell it they ought to back off and determine if they need to be using respiratory protection.
Summary of properties:
Boiling Point
-28°F
Weight per gallon of liquid at -28°F
5.69 pounds
Weight per gallon of liquid at 60°F
5.15 pounds
Specific gravity of the liquid (water=1)
0.619
Specific gravity of the gas (air=1)
0.588
Flammable limits in air
16-25%
Ignition temperature
1204°F
Vapor pressure at 0°F
16 psi
Vapor pressure at 68°F
110 psi
Vapor pressure at 100°F
198 psi
One cubic foot of liquid at 60°F expands to
850 cubic foot of gas


Chemical Properties
Anhydrous ammonia is easily absorbed by water. At 68°F, about 700 volumes of vapor can be dissolved in one volume of water to make a solution containing 34 percent ammonia by weight. Ammonia in water solution is called aqua ammonia or ammonium hydroxide.

Ammonia, especially in the presence of moisture, reacts with and corrodes copper, zinc, and many alloys. Only iron, steel, certain rubbers and plastics, and specific nonferrous alloys resistant to ammonia should be used for fabrications of anhydrous ammonia containers, fittings, and piping.

Ammonia will combine with mercury to form a fulminate which is an unstable explosive compound.

Anhydrous ammonia is classified by the Department of Transportation as nonflammable. However, ammonia vapor in high concentrations (16 to 25 percent by weight in air) will burn. It is unlikely that such concentrations will occur except in confined spaces or in the proximity of large spills. The fire hazard from ammonia is increased by the presence of oil or other combustible materials.

Anhydrous ammonia is an alkali.


Health Effects
Ammonia is not, strictly speaking, a poison and repeated exposure to it produces no additive (chronic) effects on the human body. However, even in small concentrations in the air it can be extremely irritating to the eyes, throat, and breathing passages.

Anhydrous ammonia primarily affects three areas of the body:
  • Eyes
  • Lungs
  • Skin
Eyes
Everything from mild irritation to destruction of the eye can occur depending on whether a spray or gas is involved. Ammonia penetrates the eye more rapidly than other alkalis.
Lungs
In the lungs, liquid anhydrous ammonia causes destruction of delicate respiratory tissue.
Exposure to ammonia vapor may cause:
  • Convulsive coughing.
  • Difficult or painful breathing.
  • Pulmonary congestion.
  • Death.
Skin
Skin damage depends upon the length and concentration of exposure and can range from mild irritation, to a darkened freeze-dry burn, to tissue destruction. Because liquid ammonia boils at -28°F, the expanding gas has the potential to freeze anything in its path of release, including human flesh and organs.
Because water can absorb ammonia so readily, it is a factor that contributes to human toxicity. Ammonia will keep spreading across contacted skin until the chemical is diluted by skin moisture.
Alkalis effect tissue differently than acids, which tend to burn and seal off a wound. Alkalis, such as ammonia cause liquidization of tissue and turn tissue into a sticky "goo" and mix with this tissue, causing further damage. As a result, anhydrous ammonia burns keep spreading until the chemical is diluted.
In addition to liquidization, super-cooled anhydrous ammonia spray causes a freeze dry effect like frost bite when it hits the skin. The spray is also capable of freezing clothing to skin so that if the clothing is removed incorrectly whole sections of skin can be torn off.
High concentrations in the air can also dissolve in the moisture of the skin or perspiration and result in a corrosive action on the skin and mucous membranes.
First Aid
Decontaminate the victim as quickly as possible.
  • First, flush the eyes with clean water. Then flush the whole body or the exposed area with generous amounts of water; includes the hair, ears, under chin, and armpits. Any water source is acceptable; such as showers, hoses, or stock tanks.

  • Remove contaminated clothing, but only after careful flushing and warming to prevent the previously mentioned problem of skin sticking to the clothing.

Rainwater harvesting:-

$
0
0
Rainwater harvesting:-

Rainwater harvesting is the accumulation and deposition of rainwater for reuse before it reaches the aquifer. Uses include water for garden, water for livestock, water for irrigation, etc. In many places the water collected is just redirected to a deep pit with percolation. The harvested water can be used for drinking water as well if the storage is a tank that can be accessed and cleaned when needed.

Advantage of Rain Water Harvesting:-

Rainwater harvesting provides an independent water supply during regional water restrictions and in developed countries is often used to supplement the main supply. It provides water when there is a drought, prevents flooding of low-lying areas, replenishes the ground water table, and enables dug wells and bore wells to yield in a sustained manner. It also helps in the availability of clean water by reducing the salinity and the presence of iron salts.

- Makes use of a natural resource and reduces flooding, storm water runoff, erosion, and contamination of surface water with pesticides, sediment, metals, and fertilizers.

- Excellent source of water for landscape irrigation, with no chemicals such as fluoride and chlorine, and no dissolved salts and minerals from the soil.

- Home systems can be relatively simple to install and operate May reduce your water bill.

- Promotes both water and energy conservation.

- No filtration system required for landscape irrigation.
Photo: Rainwater harvesting:-  Rainwater harvesting is the accumulation and deposition of rainwater for reuse before it reaches the aquifer. Uses include water for garden, water for livestock, water for irrigation, etc. In many places the water collected is just redirected to a deep pit with percolation. The harvested water can be used for drinking water as well if the storage is a tank that can be accessed and cleaned when needed.  Advantage of Rain Water Harvesting:-  Rainwater harvesting provides an independent water supply during regional water restrictions and in developed countries is often used to supplement the main supply. It provides water when there is a drought, prevents flooding of low-lying areas, replenishes the ground water table, and enables dug wells and bore wells to yield in a sustained manner. It also helps in the availability of clean water by reducing the salinity and the presence of iron salts.  - Makes use of a natural resource and reduces flooding, storm water runoff, erosion, and contamination of surface water with pesticides, sediment, metals, and fertilizers.  - Excellent source of water for landscape irrigation, with no chemicals such as fluoride and chlorine, and no dissolved salts and minerals from the soil.  - Home systems can be relatively simple to install and operate May reduce your water bill.  - Promotes both water and energy conservation.  - No filtration system required for landscape irrigation.

FLUE GAS -Flue gas composition

$
0
0
Flue gas is the combustion product gas from a fireplace, oven, furnace, boiler or steam generator that exits to the atmosphere via a ''flue'' which may be a pipe, channel or chimney. The flue is most commonly referred to as a "flue gas stack" by engineers or a "smokestack" by lay people.

Flue gases are produced when natural gas, fuel oil, coal, wood or any other fuel is combusted in an industrial furnace, a steam generator in a fossil fuel power plant or other combustion sources.

Flue gas composition

Flue gas is usually composed of carbon dioxide (CO2) and water vapor as well as nitrogen and excess oxygen remaining from the intake combustion air. It may also contain a small percentage of air pollutants such as particulate matter, carbon monoxide, nitrogen oxides, sulfur oxides and mercury. Typically, more than two-thirds of the flue gas is nitrogen.

The table below provides the amount of flue gas (on a dry basis as well as a wet basis) generated by burning a typical fuel gas, fuel oil or coal. The flue gas amounts were obtained by stoichiometric calculations using the indicated typical excess combustion air percentages:
Flue_Gas_Generation.png
Given the amount of gas, oil or coal fuel burned in a combustion device, then the flue gas generation data (i.e., m³/GJ of fuel) in the above table provides a basis for estimating the amount of flue gas generated.

Flue gas treatment

At power plants, flue gas is often treated with a series of chemical processes and scrubbers, which remove pollutants. Electrostatic precipitators or fabric filters remove particulate matter and flue gas desulfurization removes the sulfur dioxide (SO2) produced by burning fossil fuels, particularly coal.

Nitrogen oxides emissions are reduced either by modifications to the combustion process to prevent their formation, or by catalytic reaction with ammonia or urea. In either case, the aim is to produce nitrogen gas, rather than nitrogen oxides.

In the United States, there is also a rapid deployment of technologies to remove mercury from flue gas - typically by adsorption on sorbents or by capture in inert solids as part of the flue gas desulfurization product.

Technologies for the removal and capture of carbon dioxide from flue gases are now under active research and development as a means of reducing the emissions of so-called ''greenhouse gas''. 


ANALYSIS OF FLUE GASES

The object of a flue gas analysis is the determination of the completeness of the combustion of the carbon in the fuel, and the amount and distribution of the heat losses due to incomplete combustion. The quantities actually determined by an analysis are the relative proportions by volume, of carbon dioxide (CO2), oxygen (O), and carbon monoxide (CO), the determinations being made in this order.
The variations of the percentages of these gases in an analysis is best illustrated in the consideration of the complete combustion of pure carbon, a pound of which requires 2.67 pounds of oxygen,[28] or 32 cubic feet at 60 degrees Fahrenheit. The gaseous product of such combustion will occupy, when cooled, the same volume as the oxygen, namely, 32 cubic feet. The air supplied for the combustion is made up of 20.91 per cent oxygen and 79.09 per cent nitrogen by volume. The carbon united with the oxygen in the form of carbon dioxide will have the same volume as the oxygen in the air originally supplied. The volume of the nitrogen when cooled will be the same as in the air supplied, as it undergoes no change. Hence for complete combustion of one pound of carbon, where no excess of air is supplied, an analysis of the products of combustion will show the following percentages by volume:
 Actual Volume
for One Pound Carbon
Cubic Feet
 Per Cent
by Volume
Carbon Dioxide  32=  20.91
Oxygen    0=    0.00
Nitrogen121=  79.09
 –––––– –––––––––––
Air required for one pound Carbon153=100.00
For 50 per cent excess air the volume will be as follows:
153 × 1½ = 229.5 cubic feet of air per pound of carbon.
 Actual Volume
for One Pound Carbon
Cubic Feet
 Per Cent
by Volume
 
Carbon Dioxide  32    =  13.91}=20.91 per cent
Oxygen  16    =    7.00
Nitrogen181.5=  79.09 
 –––––––––– ––––––––––– 
Air required for one pound Carbon229.5=100.00 
For 100 per cent excess air the volume will be as follows:
153 × 2 = 306 cubic feet of air per pound of carbon.
 Actual Volume
for One Pound Carbon
Cubic Feet
 Per Cent
by Volume
 
Carbon Dioxide  32=  10.45}=20.91 per cent
Oxygen  32=  10.45
Nitrogen242=  79.09 
 –––––– ––––––––––– 
Air required for one pound Carbon306=100.00 
In each case the volume of oxygen which combines with the carbon is equal to (cubic feet of air × 20.91 per cent)—32 cubic feet.
[Pg 156]
It will be seen that no matter what the excess of air supplied, the actual amount of carbon dioxide per pound of carbon remains the same, while the percentage by volume decreases as the excess of air increases. The actual volume of oxygen and the percentage by volume increases with the excess of air, and the percentage of oxygen is, therefore, an indication of the amount of excess air. In each case the sum of the percentages of CO2 and O is the same, 20.9. Although the volume of nitrogen increases with the excess of air, its percentage by volume remains the same as it undergoes no change while combustion takes place; its percentage for any amount of air excess, therefore, will be the same after combustion as before, if cooled to the same temperature. It must be borne in mind that the above conditions hold only for the perfect combustion of a pound of pure carbon.
Carbon monoxide (CO) produced by the imperfect combustion of carbon, will occupy twice the volume of the oxygen entering into its composition and will increase the volume of the flue gases over that of the air supplied for combustion in the proportion of
1 to
100 + ½ the per cent CO
–––––––––––––––––––––––––––––––––––––––
100
When pure carbon is the fuel, the sum of the percentages by volume of carbon dioxide, oxygen and one-half of the carbon monoxide, must be in the same ratio to the nitrogen in the flue gases as is the oxygen to the nitrogen in the air supplied, that is, 20.91 to 79.09. When burning coal, however, the percentage of nitrogen is obtained by subtracting the sum of the percentages by volume of the other gases from 100. Thus if an analysis shows 12.5 per cent CO2, 6.5 per cent O, and 0.6 per cent CO, the percentage of nitrogen which ordinarily is the only other constituent of the gas which need be considered, is found as follows:
100 - (12.5 + 6.5 + 0.6) = 80.4 per cent.
The action of the hydrogen in the volatile constituents of the fuel is to increase the apparent percentage of the nitrogen in the flue gases. This is due to the fact that the water vapor formed by the combustion of the hydrogen will condense at a temperature at which the analysis is made, while the nitrogen which accompanied the oxygen with which the hydrogen originally combined maintains its gaseous form and passes into the sampling apparatus with the other gases. For this reason coals containing high percentages of volatile matter will produce a larger quantity of water vapor, and thus increase the apparent percentage of nitrogen.
Air Required and Supplied—When the ultimate analysis of a fuel is known, the air required for complete combustion with no excess can be found as shown in the chapter on combustion, or from the following approximate formula:

Pounds of air required per pound of fuel = 34.56(
C
––––
3
 + (H - 
O
––––
8
) + 
S
––––
8
)[29]            (11)
where C, H and O equal the percentage by weight of carbon, hydrogen and oxygen in the fuel divided by 100.
[Pg 157]
When the flue gas analysis is known, the total, amount of air supplied is:

Pounds of air supplied per pound of fuel = 3.036(
N
–––––––––––––––––
CO2 + CO
) × C[30]            (12)
where N, CO2 and CO are the percentages by volume of nitrogen, carbon dioxide and carbon monoxide in the flue gases, and C the percentage by weight of carbon which is burned from the fuel and passes up the stack as flue gas. This percentage of C which is burned must be distinguished from the percentage of C as found by an ultimate analysis of the fuel. To find the percentage of C which is burned, deduct from the total percentage of carbon as found in the ultimate analysis, the percentage of unconsumed carbon found in the ash. This latter quantity is the difference between the percentage of ash found by an analysis and that as determined by a boiler test. It is usually assumed that the entire combustible element in the ash is carbon, which assumption is practically correct. Thus if the ash in a boiler test were 16 per cent and by an analysis contained 25 per cent of carbon, the percentage of unconsumed carbon would be 16 × .25 = 4 per cent of the total coal burned. If the coal contained by ultimate analysis 80 per cent of carbon the percentage burned, and of which the products of combustion pass up the chimney would be 80 - 4 = 76 per cent, which is the correct figure to use in calculating the total amount of air supplied by formula (12).
The weight of flue gases resulting from the combustion of a pound of dry coal will be the sum of the weights of the air per pound of coal and the combustible per pound of coal, the latter being equal to one minus the percentage of ash as found in the boiler test. The weight of flue gases per pound of dry fuel may, however, be computed directly from the analyses, as shown later, and the direct computation is that ordinarily used.
The ratio of the air actually supplied per pound of fuel to that theoretically required to burn it is:

3.036(
N
–––––––––––––––––
CO2 + CO
) × C
            (13)
–––––––––––––––––––––––––––––––––––––––––––––
34.56(
C
–––
3
 + H - 
O
–––
8
)
in which the letters have the same significance as in formulae (11) and (12).
The ratio of the air supplied per pound of combustible to the amount theoretically required is:

N
––––––––––––––––––––––––––––––––––
N - 3.782(O - ½CO)
            (14)
which is derived as follows:
The N in the flue gas is the content of nitrogen in the whole amount of air supplied. The oxygen in the flue gas is that contained in the air supplied and which was not utilized in combustion. This oxygen was accompanied by 3.782 times its volume of nitrogen. The total amount of excess oxygen in the flue gases is (O - ½CO); hence N - 3.782(O - ½CO) represents the nitrogen content in the air actually required for combustion and N ÷ (N - 3.782[O - ½CO]) is the [Pg 158] ratio of the air supplied to that required. This ratio minus one will be the proportion of excess air.

The heat lost in the flue gases is L = 0.24 W (T - t)            (15)
 
WhereL=B. t. u. lost per pound of fuel,
W=weight of flue gases in pounds per pound of dry coal,
T=temperature of flue gases,
t=temperature of atmosphere,
0.24=specific heat of the flue gases.
The weight of flue gases, W, per pound of carbon can be computed directly from the flue gas analysis from the formula:

11 CO2 + 8 O + 7 (CO + N)
–––––––––––––––––––––––––––––––––––––––––––––
3 (CO2 + CO)
            (16)
where CO2, O, CO, and N are the percentages by volume as determined by the flue gas analysis of carbon dioxide, oxygen, carbon monoxide and nitrogen.
The weight of flue gas per pound of dry coal will be the weight determined by this formula multiplied by the percentage of carbon in the coal from an ultimate analysis.
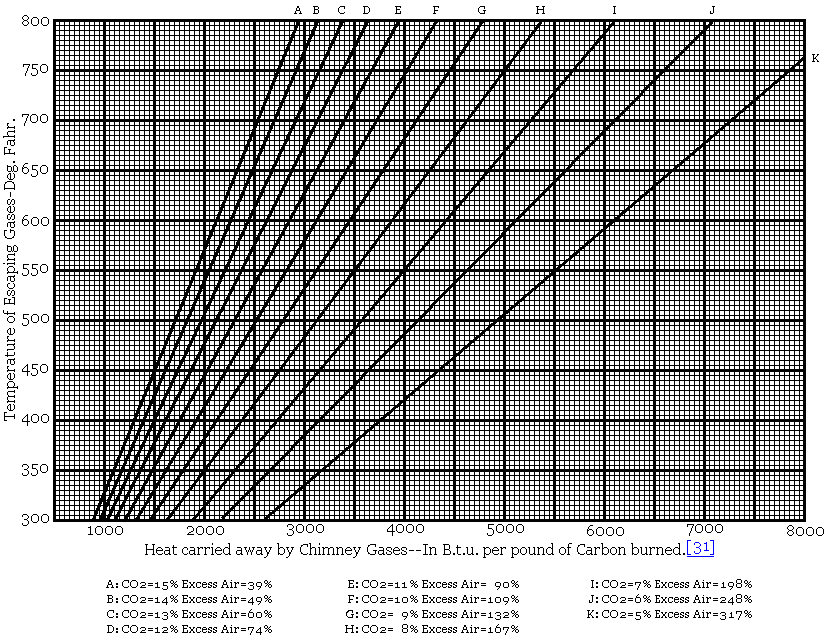
Footnote31Graph of Heat Loss

Fig. 20. Loss Due to Heat Carried Away by Chimney Gases for Varying Percentages of Carbon Dioxide.
Based on Boiler Room Temperature = 80 Degrees Fahrenheit.
Nitrogen in Flue Gas = 80.5 Per Cent. Carbon Monoxide in Flue Gas = 0. Per Cent

Fig. 20 represents graphically the loss due to heat carried away by dry chimney gases for varying percentages of CO2, and different temperatures of exit gases.
[Pg 159]
The heat lost, due to the fact that the carbon in the fuel is not completely burned and carbon monoxide is present in the flue gases, in B. t. u. per pound of fuel burned is:

L' = 10,150 × (
CO
–––––––––––––––––
CO + CO2
)            (17)
where, as before, CO and CO2 are the percentages by volume in the flue gases and C is the proportion by weight of carbon which is burned and passes up the stack.
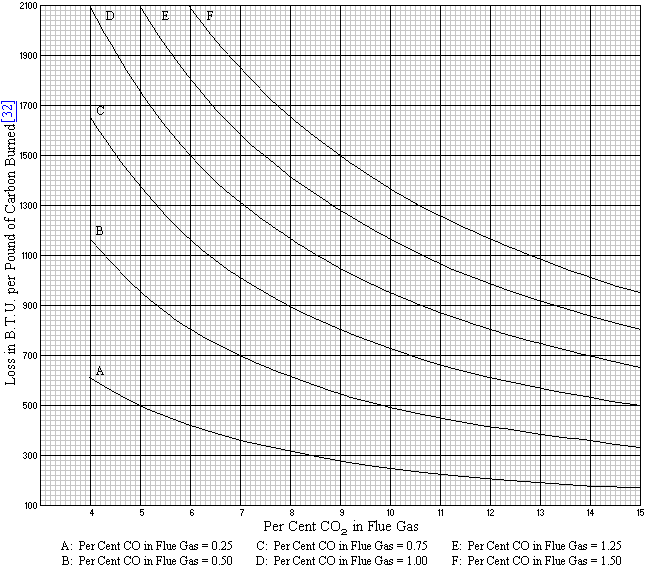
Fig. 21 represents graphically the loss due to such carbon in the fuel as is not completely burned but escapes up the stack in the form of carbon monoxide.
Footnote32Graph of Heat Loss

Fig. 21. Loss Due to Unconsumed Carbon Contained in the CO in the Flue Gases

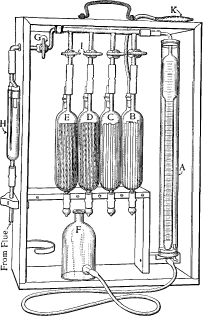
Apparatus for Flue Gas Analysis—The Orsat apparatus, illustrated in Fig. 22, is generally used for analyzing flue gases. The burette A is graduated in cubic centimeters up to 100, and is surrounded by a water jacket to prevent any change in temperature from affecting the density of the gas being analyzed.
For accurate work it is advisable to use four pipettes, B, C, D, E, the first containing a solution of caustic potash for the absorption of carbon dioxide, the second an alkaline solution of pyrogallol for the absorption of oxygen, and the remaining two an acid solution of cuprous chloride for absorbing the carbon monoxide. Each pipette contains a number of glass tubes, to which some of the solution clings, thus facilitating [Pg 160] the absorption of the gas. In the pipettes D and E, copper wire is placed in these tubes to re-energize the solution as it becomes weakened. The rear half of each pipette is fitted with a rubber bag, one of which is shown at K, to protect the solution from the action of the air. The solution in each pipette should be drawn up to the mark on the capillary tube.
Orsat Apparatus

Fig. 22. Orsat Apparatus

The gas is drawn into the burette through the U-tube H, which is filled with spun glass, or similar material, to clean the gas. To discharge any air or gas in the apparatus, the cock G is opened to the air and the bottle F is raised until the water in the burette reaches the 100 cubic centimeters mark. The cock G is then turned so as to close the air opening and allow gas to be drawn through H, the bottle F being lowered for this purpose. The gas is drawn into the burette to a point below the zero mark, the cock G then being opened to the air and the excess gas expelled until the level of the water in F and in A are at the zero mark. This operation is necessary in order to obtain the zero reading at atmospheric pressure.
The apparatus should be carefully tested for leakage as well as all connections leading thereto. Simple tests can be made; for example: If after the cock G is closed, the bottle F is placed on top of the frame for a short time and again brought to the zero mark, the level of the water in A is above the zero mark, a leak is indicated.
Before taking a final sample for analysis, the burette A should be filled with gas and emptied once or twice, to make sure that all the apparatus is filled with the new gas. The cock G is then closed and the cock I in the pipette B is opened and the gas driven over into B by raising the bottle F. The gas is drawn back into A by lowering F and when the solution in B has reached the mark in the capillary tube, the cock I is closed and a reading is taken on the burette, the level of the water in the bottle F being brought to the same level as the water in A. The operation is repeated until a constant reading is obtained, the number of cubic centimeters being the percentage of CO2 in the flue gases.
The gas is then driven over into the pipette C and a similar operation is carried out. The difference between the resulting reading and the first reading gives the percentage of oxygen in the flue gases.
The next operation is to drive the gas into the pipette D, the gas being given a final wash in E, and then passed into the pipette C to neutralize any hydrochloric acid fumes which may have been given off by the cuprous chloride solution, which, especially if it be old, may give off such fumes, thus increasing the volume of the gases and making the reading on the burette less than the true amount.
The process must be carried out in the order named, as the pyrogallol solution will also absorb carbon dioxide, while the cuprous chloride solution will also absorb oxygen.
[Pg 161]
As the pressure of the gases in the flue is less than the atmospheric pressure, they will not of themselves flow through the pipe connecting the flue to the apparatus. The gas may be drawn into the pipe in the way already described for filling the apparatus, but this is a tedious method. For rapid work a rubber bulb aspirator connected to the air outlet of the cock G will enable a new supply of gas to be drawn into the pipe, the apparatus then being filled as already described. Another form of aspirator draws the gas from the flue in a constant stream, thus insuring a fresh supply for each sample.
The analysis made by the Orsat apparatus is volumetric; if the analysis by weight is required, it can be found from the volumetric analysis as follows:
Multiply the percentages by volume by either the densities or the molecular weight of each gas, and divide the products by the sum of all the products; the quotients will be the percentages by weight. For most work sufficient accuracy is secured by using the even values of the molecular weights.
The even values of the molecular weights of the gases appearing in an analysis by an Orsat are:
Carbon Dioxide    44
Carbon Monoxide    28
Oxygen    32
Nitrogen    28
Table 33 indicates the method of converting a volumetric flue gas analysis into an analysis by weight.
TABLE 33

CONVERSION OF A FLUE GAS ANALYSIS BY VOLUME TO ONE BY WEIGHT
GasAnalysis by Volume
Per Cent
Molecular WeightVolume times
Molecular Weight
Analysis by Weight
Per Cent
Carbon DioxideCO2  12.212+(2×16)  536.8
  536.8
–––––––––––
3022.8
 =   17.7    
Carbon MonoxideCO      .412+16    11.2
    11.2
–––––––––––
3022.8
 =       .4    
OxygenO    6.92×16  220.8
  220.8
–––––––––––
3022.8
 =     7.3    
NitrogenN  80.52×142254.0
2254.0
–––––––––––
3022.8
 =   74.6    
Total100.0 3022.8
100.0    
Application of Formulae and Rules—Pocahontas coal is burned in the furnace, a partial ultimate analysis being:
 Per Cent
Carbon82.1  
Hydrogen4.25
Oxygen2.6  
Sulphur1.6  
Ash6.0  
B. t. u., per pound dry14500  
[Pg 162]
The flue gas analysis shows:
 Per Cent
CO210.7  
O9.0  
CO0.0  
N (by difference)80.3  
Determine: The flue gas analysis by weight (see Table 33), the amount of air required for perfect combustion, the actual weight of air per pound of fuel, the weight of flue gas per pound of coal, the heat lost in the chimney gases if the temperature of these is 500 degrees Fahrenheit, and the ratio of the air supplied to that theoretically required.
Solution: The theoretical weight of air required for perfect combustion, per pound of fuel, from formula (11) will be,
W = 34.56
(
.821
–––––––
3
 + (.0425 - 
.026
–––––––
8
) + 
.016
–––––––
8
)
 = 10.88 pounds.
If the amount of carbon which is burned and passes away as flue gas is 80 per cent, which would allow for 2.1 per cent of unburned carbon in terms of the total weight of dry fuel burned, the weight of dry gas per pound of carbon burned will be from formula (16):
W = 
11 × 10.7 + 8 × 9.0 + 7(0 + 80.3)
–––––––––––––––––––––––––––––––––––––––––––––––––––––
3 (10.7 + 0)
 = 23.42 pounds
and the weight of flue gas per pound of coal burned will be .80 × 23.42 = 18.74 pounds.
The heat lost in the flue gases per pound of coal burned will be from formula (15) and the value 18.74 just determined.
Loss = .24 × 18.74 × (500 - 60) = 1979 B. t. u.
The percentage of heat lost in the flue gases will be 1979 ÷ 14500 = 13.6 per cent.
The ratio of air supplied per pound of coal to that theoretically required will be 18.74 ÷ 10.88 = 1.72 per cent.
The ratio of air supplied per pound of combustible to that required will be from formula (14):
.803
–––––––––––––––––––––––––––––––––––––––
.803 - 3.782(.09 - ½ × 0)
 = 1.73
The ratio based on combustible will be greater than the ratio based on fuel if there is unconsumed carbon in the ash.
Unreliability of CO2 Readings Taken Alone—It is generally assumed that high CO2 readings are indicative of good combustion and hence of high efficiency. This is true only in the sense that such high readings do indicate the small amount of excess air that usually accompanies good combustion, and for this reason high CO2 readings alone are not considered entirely reliable. Wherever an automatic CO2 recorder is used, it should be checked from time to time and the analysis carried further with a view to ascertaining whether there is CO present. As the percentage of CO2 in these gases increases, there is a tendency toward the presence of CO, which, of course, cannot be shown by a CO2recorder, and which is often difficult to detect with an Orsat apparatus. The greatest care should be taken in preparing the cuprous chloride solution in making analyses and it must be known to be fresh and capable of absorbing CO. [Pg 163] In one instance that came to our attention, in using an Orsat apparatus where the cuprous chloride solution was believed to be fresh, no CO was indicated in the flue gases but on passing the same sample into a Hempel apparatus, a considerable percentage was found. It is not safe, therefore, to assume without question from a high CO2 reading that the combustion is correspondingly good, and the question of excess air alone should be distinguished from that of good combustion. The effect of a small quantity of CO, say one per cent, present in the flue gases will have a negligible influence on the quantity of excess air, but the presence of such an amount would mean a loss due to the incomplete combustion of the carbon in the fuel of possibly 4.5 per cent of the total heat in the fuel burned. When this is considered, the importance of a complete flue gas analysis is apparent.
Table 34 gives the densities of various gases together with other data that will be of service in gas analysis work.
TABLE 34

DENSITY OF GASES AT 32 DEGREES FAHRENHEIT AND ATMOSPHERIC PRESSURE
ADAPTED FROM SMITHSONIAN TABLES
GasChemical
Symbol
Specific Gravity
Air=1
Weight of
One Cubic Foot
Pounds
Volume of
One Pound
Cubic Feet
Relative Density, Hydrogen = 1
ExactApproximate
OxygenO1.053  .08922    11.20815.8716
NitrogenN0.9673.07829    12.77313.9214
HydrogenH0.0696.005621177.90    1.00  1
Carbon DioxideCO21.5291.12269      8.15121.8322
Carbon MonoxideCO0.9672.07807    12.80913.8914
MethaneCH40.5576.04470    22.371  7.95  8
EthaneC2H61.075  .08379    11.93514.9115
AcetyleneC2H20.920  .07254    13.78512.9113
Sulphur DioxideSO22.2639.17862      5.59831.9632
Air1.0000.08071    12.390

[Pg 164] [Pl 164]


FOOTNOTES

[28] See Table 31, page 151.
[29] This formula is equivalent to (10) given in chapter on combustion. 34.56 = theoretical air required for combustion of one pound of H (see Table 31).
[30] For degree of accuracy of this formula, see Transactions, A. S. M. E., Volume XXI, 1900, page 94.
[31] For loss per pound of coal multiply by per cent of carbon in coal by ultimate analysis.
[32] For loss per pound of coal multiply by per cent of carbon in coal by ultimate analysis.

Compressors: Time for an oil change?

$
0
0

Compressors: Time for an oil change?


Lubricating oils developed specifically for ammonia refrigeration compressors can enhance reliability and reduce operating costs as Nick McDonald, market development officer of Kluber Lubrication GB explains

Compressors: Time for an oil change?

DURING recent years there have been an increasing number of problems with the lubrication of ammonia refrigeration compressors, which have affected the reliability and efficiency of the entire refrigeration plant. On the one hand, the lubricating oil has to meet higher demands: oil-fill quantities have been reduced while temperature, pressure and speed have increased.

Moreover, plant operators are trying to achieve extended maintenance intervals to reduce costs. On the other hand, the oils in use (mainly naphthenic mineral oils) are not always in a position to meet these requirements. However, today there are specially developed lubricating oils available, which fulfil the above requirements and assist in the prevention of potential problems.

Black oil and residue formation

The intense contact between the ammonia and the lubricating oil in refrigeration compressors constitutes a great challenge. The unsaturated hydrocarbons and the sulphur compounds contained in mineral oils may react with the aggressive refrigerant ammonia. Due to this chemical reaction the oil gradually becomes darker until, eventually, it turns black.

The reaction products, which are insoluble in the oil, remain in the compressor or the refrigeration cycle (mainly in the evaporator and the condenser) as residues or sludge. These residues may bring down refrigeration plant efficiency (due to reduced heat transfer in the heat exchangers) and noticeably affect operational reliability. Experience shows that blackening and acidification of the oil can be accelerated in particular by the presence of air and water in the refrigeration cycle (up to 3% of water is possible). In addition to that, abrasive wear caused by oil sludge may directly attack various compressor components. Also, the oil filter and separator are under increased strain and are more susceptible to clogging. All this leads to a reduced lifetime of the components, a drop in efficiency and increased operating costs.

A solution can be found in the use of hydrogenated mineral oils or synthetic lubricating oils.

Klüber has taken the mineral oil route with Klüber Summit RHT-68, a paraffinic, hydrogenated mineral oil developed for use on ammonia refrigeration plants with evaporator temperatures down to -36ºC. The hydrogenation of the base oil (also called hydrotreating) removes unsaturated and sulphur compounds from the oil. Thus, the oil is being cleaned and becomes less reactive with ammonia. Changing from a naphthenic mineral oil to this type of oil constitutes no problem at all. The same goes for Klüber Summit RPA-68, a fully synthetic lubricating oil based on polyalphaolefine (PAO) and alkylbenzene. This oil was developed especially for low evaporator temperatures down to -55ºC when, due to their high pour point, mineral oils are no longer capable of flowing. Finally, Klüber Summit R-200, is not only suitable for use with ammonia, but can also be applied in combination with CO2, propane or butane. As a fully synthetic polyalphaolefine lubricating oil, it is NSF registered for use in the food processing industry and is suitable for evaporator temperatures down to -55ºC.

Both synthetic products contain very chemically-stable base oils. Their high resistance to reaction with ammonia prevents blackening of the oils, a phenomenon that is very common with conventional mineral oils, and undesirable residue formation in the evaporator.

High oil consumption of the compressor

The quantity of oil carried over from the compression chamber into the refrigeration cycle, the so-called oil carry-over, depends, among others, on the evaporation tendency (vapour pressure) of the oil at the relevant discharge temperature (sometimes clearly above 100ºC).

A high oil carry-over, caused by the comparatively high evaporation rate of a naphthenic mineral oil, may lead to excessive oil consumption and increased maintenance requirements due to frequent oil top-up. Both phenomena lead to increased operating costs.

Here, too, hydrogenated or fully synthetic oils offer a satisfactory solution: highly refined, chemically-stable base oils clearly reduce oil carry-over as compared to conventional mineral oils, thus contributing to a reduction in oil consumption of the compressor.

A practical example illustrates the potential savings: a refrigeration compressor charged with 200 litres of mineral oil operated for around 7,000 service hours per year. The operator had to replenish around 300 litres of oil per year, about 1.5 times the filling quantity. When changing to a hydrogenated mineral oil, the refill quantity was reduced by up to 70%.

Reduced oil change intervals

As it is the low-molecular constituents of the mineral oil which evaporate the fastest in the compression chamber, oil viscosity gradually increases over a period of time. Apart from the viscosity increase, blackening of the oil and sludge and residue formation may be other reasons for excessive ageing of the oil. All this inevitably leads to frequent oil changes, which interrupt normal operation and can be very costly. Highly refined and specially formulated mineral and synthetic oils do not contain these volatile oil constituents.

Therefore, oil viscosity remains stable over a long period of time, permitting oil change intervals of up to four or five times longer. The operator of a refrigeration compressor, which was lubricated with naphthenic oil (ISO VG 68), measured a viscosity increase of the oil from 68 to 105mm2/s after only 2,000 service hours. Changing over to synthetic oil enabled him to extend oil lifetime to six times that of the mineral oil fill.

Compatibility with seals

Despite the undeniable advantages offered by synthetic oils, there is still a lot of uncertainty regarding changeover to these oils, with concerns for compatibility with seals for example. Naphthenic oils often cause seals to swell, while some synthetic oils (in particular PAOs) have the contrary effect and may lead to seal shrinkage. In ammonia refrigeration compressors in particular, where neoprene seals are often used, leakage may occur following changeover from a naphthenic lubricating oil to a polyalphaolefine.

In this instance, Klüber Lubrication offers a special oil, which considerably simplifies changeover: a polyalphaolefine mixed with alkylbenzene, where the shrinking effect of one constituent is neutralised by the swelling effect of the other, achieving a neutral behaviour towards sealing materials.

Greater care has to be taken when changing from a naphthenic oil to a pure PAO with seal shrinking effect. Pure PAOs, such as Klüber Summit R 200 may cause a seal which has swollen in contact with the naphtenic oil to shrink, which may lead to leakage at O-rings in the housing or at face and shaft sealing rings. When changing over to Klüber Summit R 200 (one reason to choose this product may be its NSF approval for the food processing industry), operators are advised to renew any O-rings, face seals or shaft sealing rings.

Oil changeover

Klüber Lubrication offers tailor-made lubricants for refrigeration compressor and, on request, also provides support for oil changeover. The first step consists of a detailed oil analysis of the oil presently used, which gives an indication as to the current state of the refrigeration plant and may highlight “hidden” problems. Once the best solution for the particular customer has been determined, a service team can assist in the oil changeover on the plant.

The procedure depends largely on the degree of oil contamination and/or the compressor. Usually it is sufficient to simply drain the oil, replace filters and oil separators and to remove any residual oil from the pipes, housings and filters before filling with the new oil. For heavily contaminated screw compressors, Klüber offers an oil-based cleaning concentrate which is added to the compressor oil in a 10% concentration 60 hours before the planned oil change.

The compressor continues to operate during these 60 hours, and residues and deposits are dissolved by the cleaning agent. The compressor does not have to be dismantled for cleaning.

Also, after the changeover to new oil, Klüber Lubrication can provide further support. Together with the customer, Klüber lubrication’s specialists can inspect used oil samples at regular intervals. Should any problems occur, the situation is analysed and counter measures can be taken immediately. Always, the objective is to reduce maintenance costs and achieve the best possible availability and reliability of a refrigeration plant.

Summary

Changing over from naphthenic mineral oils to the new generation of hydrogenated mineral oils and fully synthetic lubricating oils offers many advantages. In many cases, these lubricants enable untroubled and reliable operation of refrigeration compressors without frequent interruptions due to unavoidable cleaning or maintenance. Worn parts are replaced less frequently and filter costs are reduced. Oil change intervals, on the other hand, are noticeably extended by up to six times longer and oil consumption decreased by as much as 70%.

And last but not least, due to the absence of oil-related residues, the efficiency of the refrigeration plant as a whole should increase. A successful changeover, however, requires a high degree of experience and know-how. Therefore, a competent oil supplier should advise the customer, provide a tailor-made solution and support them during the entire changeover period.


BVA 717P AMMONIA Oil
BVA 717P is a specially designed lubricant for use in ammonia refrigeration systems. It is a highly stable fluid, specially formulated so that it does not react with ammonia. The technology used in this fluid is used by many OEM refrigeration system manufacturers as their factory & service fluids.
BVA 717P specialized formulation, together with it's two stage hydrocracked base stocks, gives it excellent oxidation resistance, high viscosity, film strength at operating temperatures, fast separation from ammonia and excellent demiscibility.
BVA 717P almost colorless appearance, low volatility and almost complete absence of aromatics and high flash point contribute to safer operation of plant refrigeration equipment.
BVA717P ammonia refrigeration fluid is recommended for all compressor lubricants in ammonia refrigeration systems. It's non sludging and oxidation resistant properties make it the perfect choice for ammonia systems.
haz
Sub Categories
TYPICAL SPECSBVA 717P-68
Viscosity at 100 ° F SUS
Viscosity at 210 ° F SUS
Viscosity at 40 °C cSt
Viscosity Index
Flash Point ° F COC
Pour Point ° F
Di Electric KV
Specific Gravity @ 60° F
300
53
64
97
440
- 36
35

0.86

Natural Gas Facts

$
0
0

Natural Gas Facts

Natural Gas, what is it?
Well to start off with it comes from the ground and it’s shapeless, odorless, and colorless. Now you might be thinking, that’s boring, and you’d be right if we ended the conversation there, but we’ve got more to say. It’s explosive, and when it burns it releases water vaper and carbon dioxide. Why is this important to know? Because other fuels such as coal and oil release many potentially harmful chemicals into the air, whereas natural gas has few emissions.
What makes up Natural Gas?
The main components of natural gas is methane which makes up about  70 – 90 %. Then you’ll find ethane, propane, and butane all making up between 0 – 20 %. Next comes carbon dioxide which is between 0 – 8%, oxygen 0 – 0.2%, nitrogen 0 -5%,  and hydrogen sulphine 0 -5%.
You might be wondering at this point which one of the above elements is the one that smells like rotten eggs? And the answer is (drum roll), none of them! What? You heard me right, the smell that is often associated with natural gas is an odorant called mercaptan and this is added to the gas so that if there is a leak it can be detected quickly.  Remember at the beginning of this article we stated that natural gas in it’s purest form is odorless and colorless.
How is Natural Gas formed?
Would you be amazed if I told you the process started a very long time ago? Some say it takes millions of years for natural gas to be formed. That’s right, the remains of animals, plants and microorganisms that are compressed in the earth at extremely high pressure, for a really long time. This is also known as Thermogenic Methane. This is just one way natural gas can be formed. If you’d like to learn of a couple other ways feel free to google Biogenic methane and/or Abiogenic Processes.

The History of Natural Gas
Throughout the ages natural gas has baffled audiences across the world. You can find stories about mythical fire emitting from the earths crust in places like Greece, India, and China. As you can imagine , as the lightning struck the ground in an area that had natural gas seeping out and WHAMO, FIRE! This caused some people to be in such awe that they began worshiping it as something divine.
When did mankind start using this seeping of Natural Gas to their advantage? 
Around 500 BC the Chinese used bamboo shoots to pipe the natural gas from one place to another so that they could boil seawater for drinkin purposes. It took another 2285 years before mankind used natural gas for commercial purposes. Where did this happen? In the then known world power, Britain. What did the Brits use it for you might ask? They used it to light houses and streetlights. The USA first saw the use of this kind of natural gas produced from coal in the early 1800′s in the city of Baltimore, Maryland.
Who gets the title as the father of Natural Gas in America?
Well, the first person to dig a well trying to obtain natural gas was William Hart in Fredonia, NY. He noticed gas leaking through the earths crust into a creek. This caused bubbles to rise and Harts mind to kick into gear and capitalize on what later became known as Fredonia Gas Light Company.

Environmental Benefits of Natural Gas

$
0
0

Environmental Benefits of Natural Gas 

Background

Natural gas, the cleanest fossil fuel, is a highly efficient form of energy. It is composed chiefly of methane; the simple chemical composition of natural gas is a molecule of one carbon atom and four hydrogen atoms (CH4). When methane is burned completely, the principal products of combustion are carbon dioxide and water vapor.
Natural gasʼs advantages over other fuels include the following: it has fewer impurities, it is less chemically complex, and its combustion generally results in less pollution. In most applications, using natural gas produces less of the following substances than oil or coal: carbon dioxide (CO2), which is the primary greenhouse gas; sulfur dioxide, which is the primary precursor of acid rain; nitrogen oxides, which is the primary precursor of smog; and particulate matter, which can affect health and visibility; than oil or coal. Technological progress allows cleaner energy production than ever for all fuels, although the inherent cleanliness of gas means that environmental controls on gas equipment, if required, tend to be far less expensive than those for other fuels.
Comparison of Air Emissions from Fossil Fuels(Pounds of air emissions produced per billion Btu of energy)
Emission
NATURAL GAS
OILCOAL
Carbon Dioxide117,000
164,000
208,000


SOURCE: Energy Information Administration - www.eia.doe.gov
Natural gas also is helping America develop clean alternative energy sources in various ways, such as the following:
  • Natural gas is used to make fertilizer   AMMONIA . CO2   & ethanol.
  • Natural gas is used to make methane for hydrogen.
  •  Hydrogen is used to eliminate soot for cleaner diesel fuel.
  • Electric utilities use natural gas to generate clean power.
  • Natural gas is a raw material that goes into lightweight cars, wind power blades, solar panels and energy-efficient materials.

Spain Train Crash | Train Derailment Spain - 80+ Killed, Hundreds Injured

$
0
0

Excessive speed is being blamed for a train crash in northwestern Spain which killed at least 80 people. The train is said to have been travelling at twice the recommended speed. It was going from Madrid to Ferrol. Al Jazeera's Jonah Hull has this report from the scene of the crash in Santiago de Compostela.

What is International Tiger Day?

$
0
0

What is International Tiger Day?

International Tiger Day is held annualy on July 29 to give worldwide attention to the reservation of tigers. It is both an awareness day as a celebration. It was founded at the Saint Petersburg Tiger Summit in 2010. This was done because at that moment wild tigers were too close to extinction. Many animal welfare organisations pledged to help these wonderful creatures and are still helping to raise funds to reach this goal. The goal of Tiger Day is to promote the protection and expansion of the wilde tigers habitats and to gain support through awareness for tiger conservation.
We have lost 97% of all wild tigers in a bit over 100 years. Instead of 100,000, as few as 3,200 live in the wild today. A number of Tiger species have already been extinct.
Tigers may be one of the most admired animals, but they are also vulnerable to extinction.

At this rate, all tigers living in the wild could be extinct in 5 years!

Tigerday2

How did this happen?


India pays for environment degradation through 1.10 lakh lives

$
0
0
India pays for environment degradation through 1.10 lakh lives
CB Bureau, New Delhi July 29, 2013
The outdoor pollution alone kills 1.09 lakh adults and 7,513 children every year in India, while about six per cent (nearly Rs 3.75 lakh crore) of the country’s gross domestic product (GDP) is getting lost due to a ruining environment. The numbers were flagged in the recently released World Bank study that was commissioned by the central government.

The research by the bank indicates how urban centres, which supposedly are symbols of growth, are choking the country. The report claims that air pollution significantly burdens the country’s economy, followed by cropland degradation and water pollution. It estimates that outdoor air pollution accounts for 29 per cent of the total pollution, followed by indoor air pollution (23 per cent), cropland degradation (19 per cent), water supply and sanitation (14 per cent), pasture (11 per cent) and forest degradation (4 per cent).
Titled 'Diagnostic Assessment of Select Environmental Challenges in India,' it is the first-ever national-level economic assessment of environmental degradation. It focuses primarily on particulate matter (PM10) from burning of fossil fuels, which has serious health consequences amounting up to three per cent of the country’s GDP losses due to lack of access to clean water supply, sanitation and hygiene besides natural resources depletion. The indoor air pollution is mainly due to burning of wood, mainly in rural India.
‘Grow now and clean up later will not be environmentally sustainable for India in the long run. We believe that a low-emission, resource-efficient greening of the economy is possible at a very low cost in terms of GDP growth,’said Muthukumara S Mani, senior environmental economist at the World Bank and lead author of the report.
‘The productive part of the population that gets impacted from air pollution is in cities. If you can save them, it is going to add up in terms of productivity, in terms of GDP,’ Mani added.
Citing an example of how small steps can help in improving the situation in a big way, Mani said, ‘Improving the efficiency of a power plant, which is a major cause of air pollution in India, by simply washing the coal is a simple and inexpensive process. This not only improves the efficiency of coal, but also save a lot of lives.'

617 Indian sanctuaries get just Rs 1 lakh each per month

$
0
0
NEW DELHI: How's this for skewered priorities: Over 617 national parks and wildlife sanctuaries that are home to several critically endangered species like the Great Indian Bustard and the Snow Leopard get a mere Rs 75 crore or Rs 1 lakh each per month, on an average, while the 43 reserves for the big cat get a whopping Rs 165 crore.

Going by the financial allocation for management of protected areas, each of the 102 national parks and 515 wildlife sanctuaries get only around Rs 12 lakh annually - around Rs 1 lakh per month.

According to the environment ministry, this is despite a Planning Commission promise to double the allocation from the present Rs 75 crore annual to Rs 150 crore.

India's network of 664 protected areas extend over 4.9 percent of the country's geographical area. The network comprises 102 national parks, 515 wildlife sanctuaries, 47 conservation reserves - including 43 tiger reserves - and four community reserves.

"At present, we only get around Rs 75 crore annually for managing 617 protected areas across all states," a senior environment ministry official told IANS on condition of anonymity.

"Even if we leave the 100 protected areas in the Andaman and Nicobar region - for most of them being islands - there are still around 517 which need sufficient investment for maintenance, upkeep and smooth running," the official said.

The ministry official said that during meetings to finalise the allocations for the 12th Five-Year Plan (2012-17), the Planning commission had promised to double the Rs 75 crore allocation. "The Planning Commission has given us Rs 150 crore per year on paper but when it came to allocation, Rs 75 crore only came," the official said.

What adds to the ministry's woes is that it has not just to manage the protected areas but has to take up wildlife conservation programmes of other endangered species from the same amount.

"It is a lose-lose situation for us. We are able to focus neither on maintenance of protected areas nor on species conservation. State governments do contribute some amount for upkeep of protected areas but that is not something substantial," the official added.

During a meeting of the National Board for Wildlife last year, Prime Minister Manmohan Singh, who heads the board, had emphasised the need to focus on the conservation of other endangered animals and not just tigers.

The much celebrated tiger conservation programme covering 43 tiger reserves gets over Rs 160 crore per year.

The matter to give importance to other species has been raised several times in the meeting of the Standing Committee on the National Wildlife Board.

Divyabhanusinh Chavda, president, WWF-India, said: "While the 43 tiger reserves were allocated a total of Rs 778 crore during the 11th Five Year Plan and Rs 167.70 crore during the current financial year of the 12th Five Year Plan, the total allocation for all wildlife conservation in the country other than Project Tiger, Project Elephant and control of wildlife crime is a mere Rs 75 crore in the current financial year.

"This is a meagre amount to protect the last remaining habitats of India's most critically endangered species such as the Jerdon's Courser, the Great Indian Bustard, the Snow Leopard, the Kashmir Stag and the Manipur Deer," he added.

How to Select and Service Turbine Oils

$
0
0

How to Select and Service Turbine Oils


The question “How long will this turbine oil last?” should be answered with the sound engineering response of “it depends.” Turbine oil suppliers can give fairly wide-ranging estimates, say 5 to 15 years, in gas turbine applications. Any attempt to create a more exact estimate requires consideration of so many variables that it becomes somewhat useless. Water, heat, contamination, operating hours and maintenance practices will have a significant impact on turbine oil longevity. There is no denying that properly tested and maintained, higher quality turbine oils will provide longer life than poorly tested and maintained, lower quality products. Following is a discussion of new turbine oil performance characteristics that will promote longer, trouble-free service.
More than 100 tons of steel, rotating at 3600 rpm, is supported by plain bearings on a cushion of oil that is thinner than a human hair. In power plants around the world, the same fluid dynamics take place day-in and day-out without much notice. Lost revenue at seasonal peaks can be counted in millions of dollars. An average utility sells electricity for about $50/MW hr during nonpeak periods, and as much as $1,000/MW hr during peak periods. Poor selection and maintenance of turbine oil can result in production losses exceeding $500,000 per day.
When selecting a turbine oil for steam, gas, hydro and aero-derivative turbines, oil supplier services and commitment to the customer should be evaluated as part of the selection process.
Have the Right Tool for the Job
It is important to have an understanding of the physical and chemical characteristics of turbine oils compared to other lubricating oils before embarking upon the selection process.

Steam, gas and hydro turbines operate on a family of lubricating oils known as R&O oils (Rust & Oxidation inhibited oil). Turbine equipment geometry, operating cycles, maintenance practices, operating temperatures and potential for system contamination present unique lubricating oil demands versus other lubricating oils like gasoline and diesel engine applications.
Utility steam and gas turbine sump capacities can range in size from 1,000 to 20,000 gallons, which drives the economic incentive for a long-life lubricating oil. Low turbine oil makeup rates (approximately five percent per year) also contribute to the need for high-quality, long-life lubricants. Without significant oil contamination issues, turbine oil life is primarily dictated by oxidation stability. Oxidation stability is adversely affected by heat, water aeration and particulate contamination. Antioxidants, rust inhibitors and demulsibility additives are blended with premium quality base stock oil to extend oil life. Lube oil coolers, water removal systems and filters are installed in turbine lubrication systems for the same purpose.
Unlike most gasoline and diesel engine oil applications, turbine oil is formulated to shed water and allow solid particles to settle where they can be removed through sump drains or kidney loop filtration systems during operation. To aid in contaminant separation, most turbine oils are not additized with high levels of detergents or dispersants that clean and carry away contaminants. Turbine oils are not exposed to fuel or soot and therefore do not need to be drained and replaced on a frequent basis.
Recommended Performance Characteristics of Turbine Oil Vary by Application
Steam Turbines
A well-maintained steam turbine oil with moderate makeup rates should last 20 to 30 years. When a steam turbine oil fails early through oxidation, it is often due to water contamination. Water reduces oxidation stability and supports rust formation, which among other negative effects, acts as an oxidation catalyst.

Varying amounts of water will constantly be introduced to the steam turbine lubrication systems through gland seal leakage. Because the turbine shaft passes through the turbine casing, low-pressure steam seals are needed to minimize steam leakage or air ingress leakage to the vacuum condenser. Water or condensed steam is generally channeled away from the lubrication system but inevitably, some water will penetrate the casing and enter the lube oil system. Gland seal condition, gland sealing steam pressure and the condition of the gland seal exhauster will impact the amount of water introduced to the lubrication system. Typically, vapor extraction systems and high-velocity downward flowing oil create a vacuum which can draw steam past shaft seals into the bearing and oil system. Water can also be introduced through lube oil cooler failures, improper powerhouse cleaning practices, water contamination of makeup oil and condensed ambient moisture.
In many cases, the impact of poor oil-water separation can be offset with the right combination and quality of additives including antioxidants, rust inhibitors and demulsibility improvers.
Excess water may also be removed on a continuous basis through the use of water traps, centrifuges, coalescers, tank headspace dehydrators and/or vacuum dehydrators. If turbine oil demulsibility has failed, exposure to water-related lube oil oxidation is then tied to the performance of water separation systems.
Heat will also cause reduced turbine oil life through increased oxidation. In utility steam turbine applications, it is common to experience bearing temperatures of 120ºF to 160ºF (49ºC to 71ºC) and lube oil sump temperatures of 120ºF (49ºC). The impact of heat is generally understood to double the oxidation rate for every 18 degrees above 140ºF (10 degrees above 60ºC).
A conventional mineral oil will start to rapidly oxidize at temperatures above 180ºF (82ºC). Most tin-babbited journal bearings will begin to fail at 250ºF (121ºC), which is well above the temperature limit of conventional turbine oils. High-quality antioxidants can delay thermal oxidation but excess heat and water must be minimized to gain long turbine oil life.
Gas Turbines
For most large gas turbine frame units, high operating temperature is the leading cause of premature turbine oil failure. The drive for higher turbine efficiencies and firing temperatures in gas turbines has been the main incentive for the trend toward more thermally robust turbine oils. Today’s large frame units operate with bearing temperatures in the range of 160ºF to 250ºF (71ºC to 121ºC). Next-generation frame units are reported to operate at even higher temperatures. Gas turbine OEMs have increased their suggested limits on RPVOT - ASTM D2272 (Rotation Pressure Vessel Oxidation Test) and TOST - ASTM D943 (Turbine Oil Oxidation Stability) performance to meet these higher operating temperatures.

As new-generation gas turbines are introduced into the utility market, changes in operating cycles are also introducing new lubrication hurdles. Lubrication issues specific to gas turbines that operate in cyclic service started to appear in the mid-1990s. Higher bearing temperatures and cyclic operation lead to fouling of system hydraulics that delayed equipment start-up. Properly formulated hydrocracked turbine oils were developed to remedy this problem and to extend gas turbine oil drain intervals. Products such as Exxon Teresstic GTC and Mobil DTE 832 have demonstrated excellent performance for almost five years of service life in cyclically operated gas turbines where conventional mineral oils often failed in one to two years.
Hydro Turbines
Hydro turbines typically use ISO 46 or 68 R&O oils. Demulsibility and hydrolytic stability are the key performance parameters that impact turbine oil life due to the constant presence of water. Ambient temperature swings in hydroelectric service also make viscosity stability, as measured by viscosity index, an important performance criterion.

Aero-Derivative Gas Turbines
Aero-derivative gas turbines present unique turbine oil challenges that call for oils with much higher oxidation stability. Of primary concern is the fact that the lube oil in aero-derivative turbines is in direct contact with metal surfaces ranging from 400ºF to 600ºF (204ºC to 316ºC). Sump lube oil temperatures can range from 160ºF to 250ºF (71ºC to 121ºC). These compact gas turbines utilize the oil to lubricate and to transfer heat back to the lube oil sump. In addition, their cyclical operation imparts significant thermal and oxidative stress on the lubricating oil. These most challenging conditions dictate the use of high purity synthetic lubricating oils. Average lube oil makeup rates of .15 gallons per hour will help rejuvenate the turbo oil under these difficult conditions.

Current technology turbine oils for land-based power generation turbines are described as 5 cSt turbo oils. Aero-derivative turbines operate with much smaller lube oil sumps, typically 50 gallons or less. The turbine rotor is run at higher speeds, 8,000 to 20,000 rpm, and is supported by rolling element bearings.
Synthetic turbo oils are formulated to meet the demands of military aircraft gas turbo engines identified in Military Specification format. These MIL specifications are written to ensure that similar quality and fully compatible oils are available throughout the world and as referenced in OEM lubrication specifications.
Type II turbo oils were commercialized in the early 1960s to meet demands from the U.S. Navy for improved performance, which created MIL - L (PRF) - 23699. The majority of aero-derivatives in power generation today deploy these Type II, MIL - L (PRF) - 23699, polyol ester base stock, synthetic turbo oils. These Type II oils offer significant performance advantages over the earlier Type I diester-based synthetic turbo oils.
Enhanced Type II turbo oils were commercialized in the early 1980s to meet the demands from the U.S. Navy for better high-temperature stability. This led to the creation of the new specification MIL - L (PRF) - 23699 HTS. In 1993, Mobil JetOil 291 was commercialized as the first fourth-generation turbo oil to satisfy present and advanced high temperature and high load conditions of jet oils. Improvements continue to be made in turbo oil lubricant technology.
Generator bearing sets typically use an ISO 32 R&O or hydraulic oil. The lower pour points of a hydraulic vs. an R&O oil may dictate the use of a hydraulic oil in cold environments.
Writing a Turbine Oil Procurement Standard
Steam, gas and hydro turbine oils are a blend of highly refined or hydroprocessed petroleum base oils, usually ISO VG 32 and 46 or 68. Lubricant suppliers have developed turbine oils to meet the varying demands of turbines in propulsion and power generation applications.

These formulations were developed to meet turbine OEM specifications. Many turbine OEMs have moved away from specific turbine oil brand name approvals due to enhanced technologies in their turbines and corresponding improvements in turbine oils. OEMs have identified suggested or recommended lube oil performance test criteria and typically stipulate that an oil known to perform successfully in the field may still be used even if all recommended values have not been satisfied. Industry standard lube oil bench tests can provide great insight into the performance and life expectancy of turbine oils. However, turbine OEMs and oil suppliers generally agree that past successful performance of a particular oil under similar conditions is the best overall representation of quality and performance.
Regardless of the type or service of a turbine oil, the quality of the base stocks and additive chemistry will be a major factor in its longevity. High-quality base stocks are characterized by higher percentage saturates, lower percentage aromatics, and lower sulfur and nitrogen levels. The performance of additives must be extensively tested. They must also be blended into the oil in a tightly controlled process.
The key to a superior turbine oil is property retention. Some turbine oil formulations have been found to present good lab test data, but can experience premature oxidation because of additive dropout and base stock oxidation. Again, lube oil laboratory analysis can support your efforts to determine turbine oil longevity, but direct field experience should take precedence. Note, turbine oil suppliers will offer typical lube oil analysis data to help assess predicted performance. Typical data is used because lubricating oils vary slightly from batch to batch because of minor base stock variations.
Utility steam and gas turbine oils can be either conventional mineral-based (Group 1) or hydroprocessed (Group 2). High-quality conventional mineral-based oils have performed well in both steam and gas turbine service for more than 30 years. The trend toward higher efficiency, cyclically operated gas turbines has spurred the development of hydroprocessed, Group 2, turbine oils.
Most hydroprocessed turbine oils will have better initial RPVOT and TOST performance than conventional turbine oils. This oxidation stability performance advantage is suited for heavy-duty gas turbine applications.
The oxidation performance advantages of a hydroprocessed turbine oil may not be necessary in many less demanding steam and gas turbine applications. Conventional mineral-based oils are known to have better solvency than hydroprocessed oils which can provide better additive package retention and increased ability to dissolve oxidation products that could otherwise potentially lead to varnish and sludge.
Compatibility testing between turbine oil brands should also be addressed when writing a turbine oil specification for systems not available for a complete drain and flush. Clashing additive chemistries or poor in-service oil quality may prohibit the mixing of different and incompatible turbine oils. Your oil supplier should provide compatibility testing to confirm suitability for continued service. This testing should address the condition of the in-service oil compared to various possible blends with the proposed new oil. The in-service oil should be tested for suitability for continued service. Then a 50/50 blend should be tested for oxidation stability (RPVOT ASTM D2272), demulsibility (ASTM D1401), foam (ASTM D892, Sequence 2) and the absence of additive package dropout as witnessed in a seven-day storage compatibility test.
Turbine Lube Oil System Flushing
Turbine lube oil system flushing and initial filtration should be addressed in conjunction with the selection of the turbine oil. Lubrication system flushing may be either a displacement flush after a drain and fill, or a high velocity flush for initial turbine oil fills. A displacement flush is performed concurrently during turbine oil replacement and a high velocity flush is designed to remove contaminants entering from transport and commissioning a new turbine.

Displacement flushes using a separate flush oil are done to remove residual oil oxidation product that is not removed by draining or vacuum. A displacement flush is conducted by utilizing lubrication system circulation pumps without any modification to normal oil circulation flow paths, except for potential kidney loop filtration. This flush is typically done based on a time interval vs. cleanliness (particle levels) to facilitate the removal of soluble and insoluble contaminants that would not typically be removed by system filters.
Most turbine OEMs offer high velocity flushing and filtering guidelines. Some contractors and oil suppliers also offer flushing and filtering guidelines. Often during turbine commissioning, these guidelines are scaled back to reduce cost and time. There are common elements of a high-velocity flush that are generally supported by interested parties. There are also some procedural concerns that may differ and should be addressed on a risk vs. reward basis.
Common elements of mutual agreement in high-velocity flushing are as follows:
  • Supply and storage tanks should be clean, dry and odor-free. Diesel flushing is not acceptable.
  • Two to three times normal fluid velocity achieved with external high-volume pumps or by sequential segmentation flushing through bearing jumpers.
  • Removal of oil after flush is completed to inspect and manually clean (lint-free rags) turbine lube oil system internal surfaces.
  • High-efficiency by-pass system hydraulics to eliminate the risk of fine particle damage.
Possible supplemental or alternative elements of a high-velocity flush are as follows:
  • Use of a separate flush oil to remove oil soluble contaminants that can impact foam, demulsibility and oxidation stability
  • Need to filter the initial oil charge at a level consistent with the filtration specification
  • Thermal cycling of oil during the flush
  • Pipe line vibrators and the use of rubber mallets at pipe elbows
  • Installing special cleanliness test strainers and sampling ports
  • Desired cleanliness criteria for flush buy-off
  • Lab ISO 17/16/14 to 16/14/11 acceptable particulate range
  • Use of on-site optical particle counters
  • 100-mesh strainer, no particles detectable by naked eye
  • Millipore patch test
Up-front planning and meetings with construction, start-up, oil supplier and the end user should be scheduled in advance to build consensus on these flushing procedures.
A good practice for turbine oil performance documentation is to take a 1-gallon sample from the supply tank and then a second gallon sample from the turbine reservoir after 24 hours of operation. The recommended testing is consistent with turbine oil condition assessment testing:
  • Suitability for Continued Use (Annual)
  • Viscosity ASTM D445
  • RPVOT ASTM D2272
  • Water by Karl Fischer Titration ASTM D1744
  • Acid Number ASTM D664
  • ISO Cleanliness Code 4406
  • Rust ASTM D665 A
  • Demulsibility ASTM D1401
  • Foam ASTM D892 Sequence 2
  • ICP Metals
Past experience, turbine OEM recommendations, customer testimonials and oil supplier reputation are key elements to be considered in the selection of a turbine oil. Proper initial selection of turbine oil and continued conditioned-based maintenance should set the stage for years of trouble-free service. In many plants, Murphy’s Law strikes at the worst time. This is when you will truly appreciate a turbine oil with superior performance characteristics and an oil supplier with extensive technical support.
References
1. AISE Association of Iron and Steel Engineers. (1996). The Lubrication Engineers Manual - Second Edition. Pittsburgh, PA.

2. Bloch, H. P. (2000). Practical Lubrication for Industrial Facilities. Lithburn, GA: The Fairmont Press.
3. Exxon Mobil Corporation. Turbine Inspection Manual. Fairfax, VA.
4. Swift, S.T., Butler D.K., and Dewald W. (2001).
Turbine Oil Quality and Field Applications Requirements. Turbine Lubrication in the 21st Century ASTM STP 1407. West Conshohocken, PA.

5. ASTM. (1997). Standard Practice for In-Service Monitoring of Mineral Turbine Oils for Steam and Gas Turbines ASTM D4378-97. Annual Book of ASTM Standards Vol. 05.01.

Managing Lubricant Viscosity to Maintain Compressor Health

$
0
0

Managing Lubricant Viscosity to Maintain Compressor Health


If you’re running one of the approximately 140 working refineries in the United States, the last thing you need is an unplanned shutdown. But a production standstill is exactly what is at risk if you don’t keep an eye on the viscosity of the lubricating oil used in any of the rotary compressors in the plant, with the highest risk of these being the gas compressors. One minute all processes are up and running, and the next there’s a bearing failure and production stops.
It’s not just the cost of lost production either. A compressor failure in a single part of the refinery can cost tens of thousands of dollars a day in lost revenue, with similar amounts to rebuild a compressor, and hundreds of thousands of dollars for a replacement. There’s also the cost of maintaining spares.
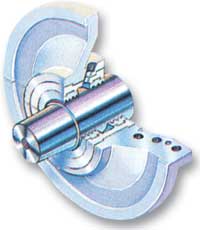
Clearly managing lubricant viscosity is critical to maintaining compressor health, but it is a common practice to monitor lubricant viscosity in each major compressor once a month by sending a sample to a lab for testing. For compressors where lubricant comes in contact with methane and other light hydrocarbon gases, the lubricant’s viscosity can break down much more quickly, increasing the risk of failure. Through hard luck, refiners also have found that real-time temperature monitoring is inadequate to monitor lubricant viscosity.
A major Gulf Coast refinery claims it has solved the problem by moving to real-time monitoring of lube oil viscosity in critical compressors.
“We recognized that in-line viscometers are the best way to know what is happening to the lube oil in our large screw compressors,” says the plant manager. “Further, we have found in-line lubrication viscosity monitoring offers a cost-effective way to keep track of compressor health.”
The true measure of the health of a lubricant’s viscosity can only be gauged when measured in its natural position with gas vapors dissolved in the lubricant. In addition, monitoring lubricant temperature isn’t sufficient to protect compressor bearings, especially in applications where process starts and stops can occur.
What’s needed is in-line viscosity monitoring to help provide plant operators with real-time data on lubricant viscosity. There is a solution for refinery managers working to keep plants online and producing. New, inexpensive and rugged in-line viscometers are able to monitor real-time changes in lubricant viscosity, offering a cost-effective way to keep track of compressor health in real time.

Refineries and Compressors

Rotary compressors are used throughout oil refineries in applications ranging from vapor recovery to gas-processing operations. Screw and scroll compressors make up a significant portion of this equipment.
Screw compressors use two reciprocal screws to compress gases. Gas is fed into the compressor by suction and moved through the threads by the rotating screws. Compression takes place as the clearance between the threads decreases, forcing the compressed gas to exit at the end of the screws.
Scroll compressors, often known as spiral compressors, use two interleaved spiral vanes to move and compress fluids and gases. Typically found in intermediate and end-product applications, scroll compressors are valued for their reliability and smooth operation.

The Importance of Lubricant Viscosity

In both types of compressors, lube oil is used to seal the compressor from gas leaks, lubricate moving parts and manage temperature during operation. The condition of lubricant oil is a critical factor in extending a compressor’s bearing life and overall reliability. Monitoring and managing lubricant viscosity can prevent costly breakdowns due to bearing failure. Viscosity also plays a role in energy efficiency, as demand for more efficient compressors is driving the use of lower-viscosity lubricants.
A range of lube oils, typically synthetic in composition, is available for use in compressors. Water resistance, thermal stability, long life, resistance to oxidation and resistance to absorption of process gases are all important characteristics. While the goal is a lubricant with a long and useful life, harsh environments, contaminants and even humidity in the refinery’s external environment can greatly reduce lube oil’s useable lifespan.
Monitoring lube oil viscosity is the best way to prevent bearing wear and compressor failure. While some plants may monitor as infrequently as once a month, rapid changes in viscosity occur, and the results can be severe.

Changes in Viscosity and Consequent Risks

Compressor lube oils are formulated to work well and remain stable at high temperatures and pressures. Hydro-treated mineral oils are used for their low gas solubility (1 to 5 percent). Synthetic compressor lubricants are used depending on the process and how much gas dilution is present. PAO (Polyalphaolefin) oils, for example, have excellent water and oxidation resistance. PAG (Polyalkaline Glycol) oils, which do not readily absorb gases, are used in applications where process gases are compressed.
Many factors can affect lube oil viscosity. These include oxidation, dilution, contamination, bubbles and temperature changes.
Oxidation occurs when churning lube oil foams, exposing more oil to surface air and causing oxidation that lowers viscosity and threatens useful lubricant life.
Dilution is the result when lubricant oil is diluted with gas such as methane, dropping viscosity.
Bubbles form as foaming oil churns against the screws or vanes of the compressor, instantly dropping the viscosity of the oil.
In contamination, vapors from hydrocarbons being processed can mix with lube oil. This light hydrocarbon and methane contamination – sometimes called “a witches’ brew” – makes measuring viscosity challenging.
Significant changes in temperature can occur – typically at start-up – that affect the viscosity of the underlying lube oil as well as any contaminants, further aggravating the situation.
A range of compressor failures can result. Bearings, both rotary and thrust, can fail, which in turn cause wear on the rotor assembly. Replacing bearings is less costly than a total rebuild or replacement. Either way, the plant faces downtime.
The unpredictability of viscosity changes means monthly checks are not enough to prevent bearing failure and subsequent plant downtime. Some compressor customers are designing in-line viscometers into compressors to monitor real-time viscosity changes that happen between standard oil lab analyses, viewing this “preventative” approach as an ideal way to ensure bearing life and minimize the costs associated with unscheduled downtime.

Process Viscometer Approaches

Not all process viscometers are created equal. Several instruments employ an innovative sensor technology that uses an oscillating piston and electromagnetic sensors. Other process viscometer technology approaches include falling piston, falling sphere, glass-capillary, U-tube and vibration designs.
In all cases, plant managers should look for certain characteristics for in-line lubricant viscosity measurement, such as menu-driven electronic controls, self-cleaning sensors, built-in temperature detection, multiple output signals, automatic viscosity control, data logging, quick-change memory settings, security and alerts.
Menu-driven electronic controls can be powerful and easy to use, while a self-cleaning sensor uses the in-line fluid to clean the sensor as it is taking measurements to reduce unscheduled maintenance.
With built-in temperature detection, the sensor should show temperature as an analog reading.
For automatic viscosity control, look for a sensor that is pre-set but reconfigurable. The sensor should be able to “learn” how much control is needed for each fluid setting.
Security and alerts are designed to prevent unauthorized changes and sound an alarm when set points are reached so operators can take action quickly.
With multiple output signals, the sensors should display temperature and temperature-compensated viscosity readings.
For process lines that run more than one fluid, quick-change memory settings simplify the process of changing settings.
In data logging, the date and time code should be automatically logged, creating an audit trail and simplifying performance and quality-trend measurement.
About the Author
Robert Kasameyer is the president and CEO of Cambridge Viscosity Inc., a global leader in fluid viscosity measurement. The company’s major applications include life sciences and pharmaceuticals as well as oil and gas exploration, oil analysis, chemical processing and coating. Kasameyer holds a BSME from Tufts University and an MBA from Harvard University.

Compressor Lubrication Best Practices

$
0
0

Compressor Lubrication Best Practices


A compressor is a type of machine that elevates the pressure of a compressible process fluid, typically air, or a host of other gases. Dynamic compressors are based on the principle of imparting velocity to a gas stream and then converting this velocity energy into pressure energy. In contrast, positive displacement compressors confine a certain inlet volume of gas in a given space and subsequently elevate this trapped amount of gas to some higher pressure level. The overwhelming majority of compressors in either the dynamic (axial/centrifugal) or positive displacement (reciprocating and screw-type) category incorporate moving components.
Nearly all compressors require a form of lubricant to either cool, seal or lubricate internal components. Only static jet compressors (ejectors) and late 20th- and early 21st-century oil-free machines with rotors suspended in magnetic or air bearings are exempt from the need for some type of lubrication. This article deals with the lubrication of dynamic compressors (Figure 1).
Key Components
Dynamic compressors have a few key components that require a coolant/lubricant: gears, bearings and seals. To date, the majority of dynamic compressors continue to utilize oil film-lubricated seals, as illustrated in Figures 2d, 3a and 3b. Only labyrinth seals (Figures 2a and 2b) or gas-lubricated seals (Figure 3c) operate without a liquid film separating the faces. On the more conventional liquid- lubricated seals, the bearing and sealing lubricant are often the same.
Figure 2a
Figure 2b
Figure 2c
Figure 2d
Figure 2. Traditional Compressor Seal Designs
(Dresser-Roots Co., Connersville, IN)

Figure 3a

Figure 3b


Figure 3c
Figure 3. Modern Compressor Seal Configurations
(Demag-DeLaval, Trenton, NJ)
Lubricating Oil System Operation
The lube oil system (Figure 4) supplies oil to the compressor and driver bearings and to the gears and couplings. The lube oil is drawn from the reservoir by the pumps and is fed under pressure through coolers and filters to the bearings. Upon leaving the bearings, the oil drains back to the reservoir.
The reservoir is designed to permit circulation of its entire fluid volume between eight to 12 times per hour. Oil reservoirs often have thermal sensors for monitoring temperature levels during start-up and constant operations.
Reservoirs also often have oil temperature controls that provide for preheating during cold start-up conditions and cooling to prevent overheating during peak operating cycles. The reservoir may be pressurized or vented.
When in operation, the compressor lubricant oil is normally circulated by the main oil pump. An auxiliary pump serves as a standby. These two pumps generally have different types of drive or power sources. When both are driven electrically, they are connected to separate supply feeders. On compressors with step-up gearboxes, the main oil pump may be driven mechanically from the gearbox, and the auxiliary pump operates during the start-up and run-down phases of the compressor train. Relief valves protect both pumps from the effects of excessively high pressures. Check-valves prevent reverse flow of oil through the stationary pump.
Heat generated by friction in the bearings is transferred to the cooling medium in the oil coolers. Air-cooled oil coolers may be employed as an alternative to water-cooled oil coolers. The former have long been used in regions where water is in short supply. A pressure-regulating valve is controlled by the pressure downstream of the filters and maintains constant oil pressure by regulating the quantity of bypassed oil.
A pressure switch activates the auxiliary oil pump. If the oil pressure falls below a preset limit, a second pressure switch shuts down the compressor train. Filters clean the lube oil before it reaches the lubrication points and a differential pressure gauge monitors the degree of fouling (flow restriction) of the filters.
The flow of oil to each bearing is regulated individually by orifices, particularly important for lubrication points requiring different pressures. Lube oil for the driver and other mechanical components is taken from branch lines. For instance, when a hydraulic shaft position indicator is used, it is supplied with oil from the lube oil system.
Temperatures and pressures are measured at all important locations in the system, including temperatures from oil sumps, return lines from bearings, gears and other mechanical components. Temperatures and pressures are often recorded on the suction and discharge sides of each compression stage to offer the operator a sense of the health of the system. The readings can be taken locally or transmitted to a monitoring station.
Compressor Seals
In general, the mechanical contact or oil face seal (Figure 3a) employs a spring-loaded stationary carbon ring in sliding contact with a rotating ring manufactured from high-quality material with a special finish. This type of seal is also effective when the compressor is at standstill and the oil pumps have been shut down.
The main components of oil bushing seals (Figure 3b) are two stationary, but radially free-to-move (floating ring) breakdown bushings with small diametral clearances opposite a shaft sleeve (Figure 3b). The floating ring clearance controls the flow of the seal liquid cooling the seal.
Floating carbon ring seals (not shown) successfully combine some of the best features of all of the above. They, too, require seal face lubrication.
Seal Oil System Operations
The seal oil, or seal liquid system (Figure 5) supplies the mechanical contact and floating ring seals with an adequate flow of seal liquid at all times, correctly ensuring proper function. An effective seal is provided at the settle-out pressure when the compressor is not running. The seal oil system may be combined with the lube oil system if the gas does not adversely affect the lubricating qualities of the oil, or provided the oil made unserviceable by the gas does not return into the oil system.
There are two methods of combining lube oil and seal oil systems: booster or combined systems. In the booster system, the oil pressure is raised to the pressure required for lubrication purposes and then part of it is raised further to the pressure needed for sealing. Alternatively, in the combined system, all the oil is initially raised to the required pressure and flow, then reduced to system component requirements.
The hardware and operation of each of these types of oil systems are identical or nearly identical. Mechanical face seals and floating ring seals are supplied with seal oil at a defined differential pressure above the reference gas pressure (pressure within the inner seal drain). The flow of seal oil is regulated by a differential pressure-regulating valve, which changes the pressure of the seal oil relative to changes in system gas pressure or, as shown in Figure 5, by a level-control valve that maintains a constant level in the overhead tank.
The oil in the overhead tank is in contact with the reference gas pressure via a separate line, with a static head providing the required pressure differential. In addition, the oil in the overhead tank compensates for pressure fluctuations and serves as a rundown supply if pressure is lost. If the level in the tank falls excessively, a level switch shuts down the compressor. A moderate oil temperature is maintained by a constant flow of oil through the overhead tank.
For the mechanical contact seal system, a regulating valve maintains the reference gas and the seal oil at a constant differential pressure. As the name indicates, the mechanical contact seal serves as a mechanical standstill seal when the compressor plant is shut down.
The seal oil is split into two streams in the compressor seals. Most of the flow returns under gravity to the reservoir. A small quantity passes through the inner seal ring to the inner drain, where it is exposed to the gas pressure.
This oil, mixed with the buffer gas, flows to the separator system, which consists of a separator and a condensate trap on each side. The separated gas flows to either the flare stack or to the suction side of the compressor while the oil flows into a tank for further degassing.
If oil is used as sealing liquid and can be used again, degassing is accelerated by heating or by air or nitrogen sparging. Sparging units perform on-stream purification of oil which can keep lubricants serviceable for long time periods. Only if the oil becomes unusable is it led away for separate treatment or disposal. The quantity of oil passing through the inner drain in a modern centrifugal compressors is small and ranges from 5 to 50 liters per day on new machines.
Compressor Lubricants
The overwhelming majority of compressors are best served by premium-grade turbine oils with ISO viscosity grades of 32 or 46. However, there are many different types of compressors and each manufacturer is likely to recommend lubricants that have been used on a test stand and at controlled user facilities.
Premium-grade ISO VG 32 turbine oils are used more often than the heavier viscosity grades. The typical viscosity index is 97, with a pour point around -37ºC (-35ºF). Oxidation stability (per ASTM D943) should exceed 5,000 hours and the flash point (per ASTM D92, COC) should be 206ºC, or 403ºF. These lubricants must provide the following:
  • Long life without need for changeout
  • Prevention of acidity, sludge, deposit formation
  • Excellent protection against rust and corrosion, even during shutdown
  • Good demulsibility to shed water that enters the lubrication system
  • Easy filterability without additive depletion
  • Good foam control
It is not uncommon to operate these systems for many years on the initial fill of lubricant, in some cases beyond 30 years. These long-term lifecycles are associated with premium-grade product selection, large sumps, reasonably good contamination control and the occasional top-off “sweetening” effect on the oil in use.
Extended lifecycles on turbine, turbo-compressor and other R&O type oils used in these applications are also facilitated by the relatively simple additive structure of the product, which minimizes kinds of complications associated with complex additive systems like those found in EP gear lubricants.
Editor’s Note
Condensed, by permission, from ISBN 0-88173-296-6, Bloch, Heinz P. Practical Lubrication for Industrial Facilities. Lilburn, Ga: The Fairmont Press, 2000.

Environmental Ecology


Oil Viscosity - How It's Measured and Reported

$
0
0

Oil Viscosity - How It's Measured and Reported

 
According to the Society of Tribologists and Lubrication Engineers (STLE), viscosity is one of an oil’s most important physical properties. It is often one of the first parameters measured by most oil analysis labs because of its importance to oil condition and lubrication. But what do we really mean when we talk about an oil’s viscosity?
A lubricating oil’s viscosity is typically measured and defined in two ways, either based on its kinematic viscosity or its absolute (dynamic) viscosity. While the descriptions may seem similar, there are important distinctions between the two.
An oil’s kinematic viscosity is defined as its resistance to flow and shear due to gravity. Imagine filling a beaker with turbine oil and another with a thick gear oil. Which one will flow faster from the beaker if it is tipped on its side? The turbine oil will flow faster because the relative flow rates are governed by the oil’s kinematic viscosity.
Now let’s consider absolute viscosity. To measure absolute viscosity, insert a metal rod into the same two beakers. Use the rod to stir the oil, and then measure the force required to stir each oil at the same rate. The force required to stir the gear oil will be greater than the force required to stir the turbine oil. Based on this observation, it might be tempting to say that the gear oil requires more force to stir because it has a higher viscosity than the turbine oil. However, it is the oil’s resistance to flow and shear due to internal friction that is being measured in this example, so it is more correct to say that the gear oil has a higher absolute viscosity than the turbine oil because more force is required to stir the gear oil.
For Newtonian fluids, absolute and kinematic viscosity are related by the oil’s specific gravity. However, for other oils, such as those containing polymeric viscosity index (VI) improvers, or heavily contaminated or degraded fluids, this relationship does not hold true, and can lead to errors if we are not aware of the differences between absolute and kinematic viscosity. For a more detailed discussion on absolute versus kinematic viscosity, refer to the article “Understanding Absolute and Kinematic Viscosity” by Drew Troyer.
Figure 1. Capillary Tube Viscometer
Capillary Tube Viscometer Test Method
The most common method of determining kinematic viscosity in the lab utilizes the capillary tube viscometer (Figure 1). In this method, the oil sample is placed into a glass capillary U-tube and the sample is drawn through the tube using suction until it reaches the start position indicated on the tube’s side. The suction is then released, allowing the sample to flow back through the tube under gravity. The narrow capillary section of the tube controls the oil’s flow rate; more viscous grades of oil take longer to flow than thinner grades of oil. This procedure is described in ASTM D445 and ISO 3104.
Because the flow-rate is governed by resistance of the oil flowing under gravity through the capillary tube, this test actually measures an oil’s kinematic viscosity. The viscosity is typically reported in centistokes (cSt), equivalent to mm2/s in SI units, and is calculated from the time it takes oil to flow from the starting point to the stopping point using a calibration constant supplied for each tube.
In most commercial oil analysis labs, the capillary tube viscometer method described in ASTM D445 (ISO 3104) is modified and automated using a number of commercially available automatic viscometers. When used correctly, these viscometers are capable of reproducing a similar level of accuracy produced by the capillary tube manual viscometer method.
Stating an oil’s viscosity is meaningless unless the temperature at which the viscosity was measured is defined. Typically, the viscosity is reported at one of two temperatures, either 40°C (100°F) or 100°C (212°F). For most industrial oils, it is common to measure kinematic viscosity at 40°C because this is the basis for the ISO viscosity grading system (ISO 3448). Likewise, most engine oils are typically measured at 100°C because the SAE engine oil classification system (SAE J300) is referenced to the kinematic viscosity at 100°C (Table 1). Additionally, 100°C reduces the rise of measurement interference for engine oil soot contamination.
Figure 2. Rotary Viscometer
Rotary Viscometer Test Method
A less common method of determining an oil’s viscosity utilizes a rotary viscometer. In this test method, the oil is placed in a glass tube, housed in an insulated block at a fixed temperature (Figure 2). A metal spindle is then rotated in the oil at a fixed rpm, and the torque required to rotate the spindle is measured. Based on the internal resistance to rotation provided by the shear stress of the oil, the oil’s absolute viscosity can be determined. Absolute viscosity is reported in centipoise (cP), equivalent to mPa·s in SI units. This method is commonly referred to as the Brookfield method and is described in ASTM D2983.
While less common than kinematic viscosity, absolute viscosity and the Brookfield viscometer are used in formulating engine oils. For example, the “W” designation, which is used to denote oils that are suitable for use at colder temperatures, is based in part on the Brookfield viscosity at various temperatures (Table 2).
Based on SAE J300, a multigrade engine oil that is designated as SAE 15W-40 must therefore conform to the kinematic viscosity limits at elevated temperatures according to Table 1 and the minimum requirements for cold cranking as shown in Table 2.
Viscosity Index
One other important property of an oil is viscosity index (VI). The viscosity index is a unitless number, used to indicate the temperature dependence of an oil’s kinematic viscosity. It is based on comparing the kinematic viscosity of the test oil at 40°C, with the kinematic viscosity of two reference oils - one of which has a VI of 0, the other with a VI of 100 (Figure 3) - each having the same viscosity at 100ºC as the test oil. Tables for calculating VI from the measured kinematic viscosity of an oil at 40°C and 100°C are referenced in ASTM D2270.

Figure 3. Determination of Viscosity Index (VI)
Figure 3 shows that an oil that has a smaller change in kinematic viscosity with temperature will have a higher VI than an oil with a greater viscosity change across the same temperature range.
For most paraffinic, solvent-refined mineral-based industrial oils, typical VIs fall in the range of 90 to 105. However, many highly refined mineral oils, synthetics and VI improved oils have VIs that will exceed 100. In fact, PAO-type synthetic oils typically have VIs in the range 130 to 150.
Viscosity Monitoring and Trending
Monitoring and trending viscosity is perhaps one of the most important components of any oil analysis program. Even small changes in viscosity can be magnified at operating temperatures to the extent that an oil is no longer able to provide adequate lubrication. Typical industrial oil limits are set at ±5 percent for caution, and ±10 percent for critical, although severe- duty applications and extremely critical systems should have even tighter targets.
A significant reduction in viscosity can result in:
  • Loss of oil film causing excessive wear
  • Increased mechanical friction causing excessive energy consumption n Heat generation due to mechanical friction n Internal or external leakage
  • Increased sensitivity to particle con- tamination due to reduced oil film
  • Oil film failure at high temperatures, high loads or during start-ups or coast-downs.
Likewise, too high a viscosity can cause:
  • Excessive heat generation resulting in oil oxidation, sludge and varnish build-up
  • Gaseous cavitation due to inadequate oil flow to pumps and bearings
  • Lubrication starvation due to inadequate oil flow
  • Oil whip in journal bearings
  • Excess energy consumption to over- come fluid friction
  • Poor air detrainment or demulsibility
  • Poor cold-start pumpability.
Whenever a significant change in viscosity is observed, the root cause of the problem should always be investigated and corrected. Changes in viscosity can be the result of a change in the base oil chemistry (a change in the oil’s molecular structure), or due to an ingressed contaminant (Table 3).
Viscosity changes may require additional tests, such as: acid number (AN) or Fourier transform infrared spectroscopy (FTIR), to confirm incipient oxidation; contaminant testing to identify signs of water, soot or glycol ingress; or other less commonly used tests, such as the ultracentrifuge test or gas chromatography (GC), to identify a change in the base oil chemistry.
Viscosity is an important physical property that must be monitored and controlled carefully because of its impact on the oil and the oil’s impact on equipment life. Whether measuring viscosity onsite using one of many onsite oil analysis instruments capable of determining viscosity changes accurately, or whether sending samples routinely to an outside lab, it is important to learn how viscosity is determined, and how changes can impact equipment reliability. A proactive approach must be taken to determine the condition of the equipment’s lifeblood - the oil!

Measuring Viscosity with Onsite Viscometers

$
0
0

Measuring Viscosity with Onsite Viscometers


“We are using an onsite viscometer to measure viscosity at 40 degrees C. At the same time, our lube supplier is testing samples from the same system regularly. However, our viscosity numbers are often up to 10 percent different from the lube suppliers. What are we doing wrong?”
Because the viscosity of an oil is probably its single most important property, it makes sense to measure viscosity frequently, using onsite test equipment. However, like all onsite equipment, it’s important to understand how these instruments work and their relative strengths and weaknesses.
When it comes to viscosity, there are two determinable parameters — absolute and kinematic viscosity. Kinematic viscosity measures the resistance of an oil to flow and shear under gravity, such as oil flowing through a funnel. Absolute viscosity, on the other hand, determines an oil’s internal resistance to flow and shear. To visualize absolute viscosity, imagine the force needed to stir an oil using a metal rod.
The viscosity reported by your lube supplier and oil analysis lab is likely the kinematic viscosity.  There are two main reasons why your onsite measurements may not correlate directly with the lab data.
First, most onsite test equipment actually measures absolute viscosity, but calculates the kinematic viscosity by dividing absolute viscosity by density.  Because the onsite viscometers don’t actually measure density but rather estimate it from the oil’s spec sheets, an error can occur when translating absolute viscosity into kinematic viscosity.  The measure of the absolute viscosity is correct, but because the density of the oil is only estimated, the conversion to kinematic viscosity can become overstated. Contamination and oxidation, among other things, can cause a rise in the density of used oil.
Second, if your onsite instrument does not heat the oil to 40 degrees C, and most do not, you are likely determining the oil’s viscosity at the temperature of the onsite lab (typically in the 20 to 25 degrees C range), and extrapolating, again using a software algorithm to determine the viscosity at 40 degrees C. This extrapolation can also introduce errors into the reported measurement due to changes in viscosity index of the used oil.
Despite these limitations (which actually are not negatives), used properly, onsite viscometers make very valuable additions to any onsite test program.  As a general rule, always baseline your new oils using your own onsite viscometer to determine nonconforming used oil viscosities quickly and simply.

Lubricant and How It is Made

$
0
0
A lubricant is a substance introduced to reduce friction between moving surfaces. It may also have the function of transporting foreign particles. The property of reducing friction is known as lubricity. (Slipperiness)

A good lubricant possesses the following characteristics: High boiling point. Low freezing point. High viscosity index. Thermal stability. Hydraulic Stability Demulsibility
* Corrosion prevention. High resistance to oxidation.

One of the single largest applications for lubricants, in the form of motor oil, is protecting the internal combustion engines in motor vehicles and powered equipment.

Typically lubricants contain 90% base oil (most often petroleum fractions, called mineral oils) and less than 10% additives. Vegetable oils or synthetic liquids such as hydrogenated polyolefins, esters, silicones, fluorocarbons and many others are sometimes used as base oils. Additives deliver reduced friction and wear, increased viscosity, improved viscosity index, resistance to corrosion and oxidation, aging or contamination, etc.

Lubricants such as 2-cycle oil are added to fuels like gasoline which has low lubricity. Sulfur impurities in fuels also provide some lubrication properties, which has to be taken in account when switching to a low-sulfur diesel; biodiesel is a popular diesel fuel additive providing additional lubricity.

Non-liquid lubricants include grease, powders (dry graphite, PTFE, Molybdenum disulfide, tungsten disulfide, etc.), PTFE tape used in plumbing, air cushion and others. Dry lubricants such as graphite, molybdenum disulfide and tungsten disulfide also offer lubrication at temperatures (up to 350 °C) higher than liquid and oil-based lubricants are able to operate. Limited interest has been shown in low friction properties of compacted oxide glaze layers formed at several hundred degrees Celsius in metallic sliding systems, however, practical use is still many years away due to their physically unstable nature.

Another approach to reducing friction and wear is to use bearings such as ball bearings, roller bearings or air bearings, which in turn require internal lubrication themselves, or to use sound, in the case of acoustic lubrication.

In addition to industrial applications, lubricants are used for many other purposes. Other uses include cooking (oils and fats in use in frying pans, in baking to prevent food sticking), bio-medical applications on humans (e.g. lubricants for artificial joints), ultrasound examination, internal examinations for males and females, and the use of personal lubricant for sexual purposes.

Oil spill in Thailand’s sea reaches tourist island

$
0
0

Oil spill in Thailand’s sea reaches tourist island 

About 50 tons of crude oil that spilled into the sea off Rayong province Saturday have now trashed the shore of Prao Bay on Samet Island.

THAILAND OUT

An aerial view shows the crude oil after it washed ashore at a beach, right in front of Ko Samet Island.

BANGKOK — An oil spill that leaked from a pipeline has reached a popular tourist island in Thailand’s eastern sea despite continuous attempts to clean it up over the weekend, officials said Monday.
About 50 tons of crude oil spilled into the sea off Rayong province Saturday morning after a leak sprung in a pipeline operated by PTT Global Chemical Plc, a subsidiary of state-owned oil and gas company PTT Plc.
In this photo taken Saturday, July 27, 2013, a cleaning vessel clears the oil after about 50 tons of crude oil leaked rom a pipe into the sea off Rayong province, eastern Thailand.

In this photo taken Saturday, July 27, 2013, a cleaning vessel clears the oil after about 50 tons of crude oil leaked rom a pipe into the sea off Rayong province, eastern Thailand.

RELATED: BP PUT PROFITS AHEAD OF SAFETY: GOVERNMENT
Streaks of crude oil about 300 meters (984 feet) wide have marred the shore of Prao Bay on Samet Island, one of the most popular beach destinations among Thai and foreign tourists in the Gulf of Thailand, Rayong’s deputy provincial governor Supeepat Chongpanish said on Monday.
Thai soldiers  take part in a clean-up operation at Ao Prao Beach.

ATHIT PERAWONGMETHA/REUTERS

Thai soldiers take part in a clean-up operation at Ao Prao Beach.

He said authorities have closed down the bay as 300 workers are working to remove the oil from the white beach and from the waters. Tourists have been warned against going near the area.
RELATED: RALLIERS CROWD NATIONAL MALL OPPOSING KEYSTONE PIPELINE
Thai soldiers in white biohazard suits pour oil into a bag during the clean-up operation at Ao Prao Beach.

ATHIT PERAWONGMETHA/REUTERS

Thai soldiers in white biohazard suits pour oil into a bag during the clean-up operation at Ao Prao Beach.

“The top priorities right now are to get rid of the oil on the sand and the seawaters, and to make sure the spill doesn’t spread to other shores,” Supeepat said. “This is a very beautiful, white, sandy beach, so we want to make the spill go away as soon as possible.”
The nearby area has been declared a disaster zone by provincial authorities, and those affected by the spill will receive immediate assistance.
A Thai soldiers shows his glove covered with oil slick at Ao Prao Beach.

ATHIT PERAWONGMETHA/REUTERS

A Thai soldiers shows his glove covered with oil slick at Ao Prao Beach.

RELATED: EXXONMOBILE BIG GUNNED DOWN IN BELGIUM
The company said it detected the leak when the crude oil from a tanker moored offshore was being transferred to the pipeline, 20 kilometers (11 miles) away from delivery at the refinery in Map Ta Phut, one of the largest industrial estates in Southeast Asia.
Soldiers  take part in a clean-up operation at Ao Prao Beach on Koh Samet, Rayong July 29, 2013.

ATHIT PERAWONGMETHA/REUTERS

Soldiers take part in a clean-up operation at Ao Prao Beach on Koh Samet, Rayong July 29, 2013.

The company said in a statement Sunday that it had flown in an oil spill management experts and a plane from Singapore to get rid of the crude oil. The Thai Navy vessels also joined the cleanup efforts.
RELATED: EXXON'S ARK. OIL SPILL LIKE ‘THE WALKING DEAD’: OFFICIAL
Streaks of crude oil cover the shore of Prao Bay on Samet Island in Rayong province eastern Thailand Monday, July 29, 2013.

AP

Streaks of crude oil cover the shore of Prao Bay on Samet Island in Rayong province eastern Thailand Monday, July 29, 2013.


FALL FROM SCAFFOLDING CAN BE PREVENTED

Viewing all 8075 articles
Browse latest View live