Quantcast
Channel: EHSQL(Environment-Energy ,Health,Safety, Security and Social Ac. ,Quality-Lab) Technical services
Viewing all 8077 articles
Browse latest View live

Top Ten Cell Phone Safety Facts

$
0
0
Last few years has seen some raging controversy on usage of cell phones. Over 80% of the world citizens are in a possession of cell phones. This year (2010) the number cell number in the world will exceed 5 billion and the number will keeps growing with broad band joining the bandwagon. Evidence seems to be pouring in about the harm of 'Electro Magnetic Radiation’ (EMR) from cell phones. More evidence is required before we raise our alarms about this device but the preliminary scientific report gives us reason to alert members about the need to take certain precautions. One of the first advices would be to keep cell phone usage to minimum, as even a two-minute call from the cell phone alters the natural electrical activity of the brain for up to an hour.

1. Keep the handset if possible at least 2 to 7 inches away from your head or use loudspeaker mode. It decreases the transmission of electro-magnetic radiation to the brain significantly.

2. Do not keep the cell phones close to your head when sleeping. Switch it off in the night or keep it 1.80 meters or 6 feet away from your head.

3. If keeping cell phones in pocket keep the keypad towards you so that antenna faces away from you.

4. Don’t use cell phones if pregnant. The developing organs of the fetus or child are the most sensitive to any possible effects of electromagnetic radiation (EMR) exposure.

5. Avoid cell phones usage in‘metal containers’ like Vehicles, Elevators, Airplanes, Trains and any other type of metal container as it increases the EMR.

6. Avoid using the wired headsets. If you do use headsets use an air tube headset with ferrite beads. Blue tooth are better as they emit 1/100th the EMR of a normal cell phone.
With regular headsets you get 3 times more EMR than if you hold the cell phone against your ear.

7. Cell phones are a big NO for Children under 15 years as currently brain tumors are the second leading cause of death in children.

8. Keep cell phones well away from newborns. EMR travel through children’s brains much more easily due to thinner skulls and hence increases the risk of cancer.

9. Avoid using cell phones in your pant pocket – as radiation can affect your fertility.  Avoid it in breast pocket if you have a pacemaker.

10. When buying a cell phone – look for one with a low SAR or Specific Absorption Rate. Lower the SAR number the better. For example - Popular Motorola Razr V3x has a SAR of 0.14 – which is amongst the lowest seen recently.


NAGARJUNA GROUP VISION TO EXPLOER THE EXPERTISE IN ALL AROUND

Revamping of Urea Plants for Higher Production & Efficiency

EFFICIENCY ENHANCEMENT OF HIGH PRESSURE SYNTHESIS UNIT IN UREA PRODUCTION PLANT

'Death is more universal than life; everyone dies but not everyone lives'. - A. Sachs

$
0
0
'Death is more universal than life;
everyone dies but not everyone lives'. - A. Sachs

Read top ten ‘deadly facts’ about death itself.

1. Each year about 56 million people die around the world.

2. 35 million of theses deaths are due to non-communicable diseases

3. 17.5 million deaths occur from cardiovascular or heart diseases.

4. 7.6 million deaths are due to cancer

5. 7.1 million people deaths are related to high blood pressure.

6. 4.4 million succumb to high levels of cholesterol.

7. 2.6 million deaths occur due to Obesity and its related problems like developing diabetes or high blood pressure.

8. Around 1 million people die from diabetes.

9. 465,000 women died due to breast cancer in 2007

10. 20,000 people in the world are daily dying due to cancer.


Top Ten Facts About Silent Killer Diseases

$
0
0
1. 'Silent killer disease' are diseases that produces minimum or no symptoms and are capable of causing death if not treated.

2. Heart disease, hypertension and diabetes are major silent killer diseases.

3. There are other lesser known silent diseases that include primary amyloidosis, Renal cell cancer , pancreatic cancer, Hepatitis B or C infection to name a few.

4. Heart disease is the number one silent killer disease. The main risk factors that contribute to this increased risk include - Hypertension, smoking, sedentary lifestyle and raised cholesterol.

5. Cancer as group is the next big silent killer and comes a close second. Estimated deaths in a year due to cancer is 6.2 million. 1 in 8 death occurs due to cancer and it outnumbers death due to AIDS, Tuberculosis and Malaria combined.

6. Smoking is an important risk factor for silent killer disease like cancers and heart disease. Smoking causes 87% of lung cancers.

7. Mesothelioma another silent killer is almost always due to inhalation of asbestos fibers and at present there is no known cure for this very lethal cancer.

8. There are 246 million people with diabetes in the world and every year it is estimated that 3.2 million people die due to the diabetes or its related causes.

9. Obstructive Sleep apnea is a risk factor for stroke and sudden death during sleep. The increase in obesity has also increased its risk and incidence.

10. Silent epidemic that is potentially a threat to the health of the world include liver infection from Hepatitis B and C viruses. It can cause cirrhosis, liver cancer and death. Both these viruses have infected almost 530 million people in the world. Every year there are 3 to 4 million people who are newly infected by the viruses. There is no cure or vaccine for chronic hepatitis C infection.

Facts on Vitamins and Minerals

$
0
0

 Facts on Vitamins and Minerals


Facts on Vitamins and Minerals
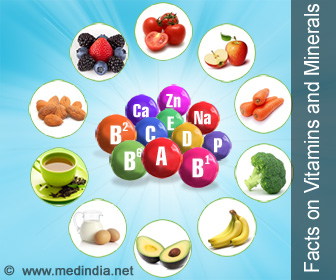
Vitamins

Vitamins are organic compounds essential for our body’s normal growth and maintenance. Most vitamins cannot be synthesized by our body, so we must rely on plant and animal foods and food supplements to maintain adequate amounts of vitamins for normal body functions. Vitamins can be fat-soluble or water-soluble. Fat-soluble vitamins such as vitamins A, D, E, and K dissolve in fat and are stored in the body. Water-soluble vitamins like the B vitamins (B1, B2, B6, B12) and vitamin C that dissolve in water, cannot be stored by the body for long, pass through the kidneys and lost in urine. Except vitamin B12, which is stored in the liver, water soluble vitamins should be taken daily.

Minerals

Minerals are inorganic substances that we get from food and water. Minerals form only a small percentage of our total body weight, about 4-5%, yet they are very necessary for human metabolism and for maintaining normal health. Minerals too cannot be synthesized in our body so we must get a healthy measure of minerals from out diet for healthy living.

Facts

1. Only 1% of the total body calcium is needed for the metabolic functions while remaining 99% is utilized to provide strength and structure for the bones and teeth.

2. Calcium is the most abundant mineral found in your body. Natural sources of calcium include milk, yogurt and cheese. It is also found in canned salmon and sardines with bones, and green leafy vegetables like broccoli.

3. Phosphorus works in conjunction with calcium to form bones, teeth and nerve cells.

4. Potassium is mainly involved in building proteins and muscles,controlling acid-base balance and electrical activity of the heart.

5. Potassium is found in meats, fishes like salmon, cod, flounder, and sardines. Some fruits and vegetables are also a rich source of potassium.

6. If you have potassium deficiency (hypokalemia), it may cause muscle weakness, abnormal heart rhythms and slight rise in blood pressure.   

7. Iron is the most important mineral for your body. Major functions of iron include oxygen transport, regulation of cell growth and differentiation.

8. Hemoglobin contains about two-third of total iron in the body.

9. Heme and non-heme are the two forms of dietary iron. Animal foods such as red meat, fish, and poultry are good sources of heme iron. Sources of non-heme iron include lentils and beans.

10. Healthy adults absorb about 15-35% of heme iron while the absorption of non-heme is only 2-20%.

11. Infants absorb about 50% of iron in the breast milk while only 12% is absorbed in infant formula. Infants poorly absorb iron in cow’s milk and it may also lead to gastrointestinal bleeding in infants.

12. Iron deficiency may restrict the supply of oxygen to cells, which ultimately results in fatigue, poor performance at work and decreased immunity. Too much of iron may also be harmful to your body. 

13. WHO estimate shows 41.8% of pregnant women worldwide are anemic and at least half of this anemia burden is assumed to be caused by iron deficiency

14. Preformed vitamin A and provitamin A are the two different types of vitamin A. Meat, poultry, fish, and dairy products are some of the examples of preformed vitamin A, while the latter is rich in fruits, vegetables, and other plant-based products.

15. Vitamin E is essential to boost your immune system, widen the blood vessels and prevent blood clot. It is found in many foods like vegetable oils, nuts and seeds and green vegetables.

16. Vitamin B12 plays a major role in forming red blood cells, synthesizing DNA and proper functioning of neurological system. Deficiency of vitamin B12 may lead to megaloblastic anemia, fatigue, weakness, constipation, loss of appetite and weight loss. It can even cause numbness and tingling in the hands and feet.

17. Animal based foods like fish, meat, poultry, eggs, milk and milk products are the best sources for vitamin B12.

18. Vitamin E and vitamin C act as an antioxidant that helps prevent cell damage caused by the action of free radicals.

19. Vitamin C is naturally found in fruits and vegetables like citrus fruits (orange and grapefruit), broccoli, strawberry, cantaloupe, baked potatoes, and tomatoes to name a few.

20. Vitamin C requirement is increased by 35 mg for smokers and those who are exposed to second hand smoke.

Benefits Of Groundnut

$
0
0

Benefits Of Groundnut


Groundnuts, also known as peanuts, are considered a very healthy snack. Groundnut is the member of the legume family and is native to regions like South America, Mexico and Central America. However, it is successfully grown in other parts of the world as well. The name of the plant combines the morpheme, ‘pea’ and ‘nut’. In the culinary sense, it is regarded as a nut, but in the botanical sense, the fruit of the plant is a woody legume. Since that is the case, the groundnut is actually a kind of pea. The groundnut is also known by different names like earthnuts, goobers, goober peas, pindas, jack nuts, pinders, manila nuts and monkey nuts. Throughout the world, they are known for their nutrition and health benefits.
Peanuts or groundnuts are among the most common oil-seeds, since time immemorial. The nuts are rich with significant, beneficial nutrients that are essential for optimum health. People consume groundnuts in various ways such roasted, boiled, raw and also use them as a base for gravies. Read on for information on the nutritional value and benefits of groundnuts.
 

Nutritional Value of Groundnut
 
Nutrients
Content per 100g
Energy
567 Kcal
Carbohydrates
16.13 g
Protein
25.80 g
Total Fat
49.24 g
Cholesterol
0 mg
Dietary Fiber
8.5 g
Vitamins
Folates
240 µg
Niacin
12.066 mg
Pantothenic acid
1.767 mg
Pyridoxine
0.348 mg
Riboflavin
0.135 mg
Thiamin
0.640 mg
Vitamin A
0 IU
Vitamin C
0
Vitamin E
8.33 mg
Electrolytes
Sodium
18 mg
Potassium
705 mg
Minerals
Calcium
92 mg
Copper
1.144 mg
Iron
4.58 mg
Magnesium
168 mg
Manganese
1.934 mg
Phosphorus
76 mg
Selenium
7.2 µg
Zinc
3.27 mg
Phyto-nutrients
Carotene-ß
0 µg
Crypto-xanthin-ß
0 µg
Lutein-zeaxanthin
0 µg
 
 
Health Benefits Of Eating Groundnuts
  • Groundnuts and groundnut products are very beneficial in the treatment of hemophilia and other such inherited blood disorders. People suffering from nose bleeding also benefit from eating groundnuts and it is also helpful in reducing excessive menstruation bleeding in women.
  • Five main nutrients required by the body to maintain and repair the tissues namely, energy, protein, phosphorous, thiamin and niacin are found in good quantity in groundnuts.
  • Groundnuts are rich vitamins and contain at least 13 different types of vitamins that include Vitamin A, B, C and E. along with this, groundnuts are also rich in 26 essential minerals like calcium, iron, zinc, boron, etc. These help in brain function and development and also help to maintain strong bones.
  • It is recommended that growing children, expecting women and nursing mothers consume roasted groundnuts with jaggery and goat’s milk. It is said to provide resistance and immunity against dangerous infections like hepatitis and tuberculosis.
  • Groundnuts are rich in anti-oxidants and a chemical called resveratrol. These help in reducing the risk of contracting cardiovascular diseases, cancer risk and also help in anti-ageing, thus, keeping the body young and fit.
  • They are composed of adequate levels of mono-unsaturated fatty acids especially oleic acid which helps to lower the LDL or "bad cholesterol" and increases HDL or "good cholesterol” level in the blood. This in return prevents coronary artery disease and strokes by taking care of the healthy blood lipid profile.
  • Groundnuts contain amino acids and are a good source of dietary protein, which is essential for growth and development.
  • Peanuts have high content of poly-phenolic antioxidants, primarily p-coumaric acid which reduces the risk of stomach cancer by preventing the formation of carcinogenic nitrosamines in the stomach.
  • Boiling the peanuts for consumption is known to enhance the antioxidant concentration, such as biochanin-A and genistein.
  • Groundnuts are packed with B-complex groups of vitamins such as riboflavin, niacin, thiamin, pantothenic acid, vitamin B-6, and folates, which contribute towards brain health and stimulate blood flow to the brain.
  • It is said that a handful of groundnuts per day, offers enough levels of phenolic anti-oxidants, minerals, vitamins, and protein recommended by doctors.
  • Peanuts contain dietary fiber which enhances digestion.

The Primary Nutrients in Plant Growth: Nitrogen

Boron, Calcium, Copper and iron and deficiency

Magnesium, Manganese, Molybdenum and Zinc deficiencies in Coconut

Institutional Reform in Transition Economies: How Far Have They Come?

$
0
0
This paper examines how institutional conditions in transition economies compare with those in the rest of the world using various indicators of governance. The focus is on the countries in Central and Eastern Europe and the former Soviet Union but, when possible, transition countries, in Asia and Africa are also considered. The main findings are that transition economies, as a group, are no longer distinguishable from other economies, but at the same time, there are large differences in institutional performance within the group of transition economies. A formal cluster analysis is conducted in order to map transition economies into homogeneous groupings of countries. The results of this analysis highlight that transition economies are found at all clusters (from best to worst institutional performers) and also that a group of five countries, all of which are EU accession countries, appear to have graduated: when taking into account their level of income, their institutional conditions are no longer distinguishable from those in the most advanced industrialized countries. 
SSRN-id879853.pdfSSRN-id879853.pdf
4348K   View   Download  

CWPRS Team to Overview Flood Control Measures in Haridwar & Uttarakhand

$
0
0
CWPRS Team to Overview Flood Control Measures in Haridwar & Uttarakhand
Union Water Resources Minister Shri Harish Rawat has instructed to send a team of Experts from Central Water & Power Research Station (CWPRS), Pune, an organisation under the Ministry of Water Resources to visit Haridwar in Uttarakhand for the overview of flood control measures and suggest remedial options . During its visit the team alongwith the Local State Irrigation Department Engineers will go to those affected areas where River Ganga is cutting its embankments.After assessing the flow and water discharge of Ganga at Haridwar, this team will evolve a Simulation Model that will be act as Guideline for Flood Control measures and future constructions in the riverside areas. This team will also suggest Immediately applicable measures for flood control and check the soil erosion along the river banks their.

Central Water & Power Research Station (CWPRS), Pune has already evolved a Simulation Model for Delhi for Flood Control and bridge construction over Yamuna at different Locations as well as various construction activities along the river banks . CWPRS has also given useful and adequate tips for Flood control for Flood control of Kosi River in Bihar and River Ganga at Farakka in West Bengal.


********


ST/-
(Release ID :97198)

'Stronger, more frequent tropical cyclones ahead'

$
0
0

'Stronger, more frequent tropical cyclones ahead'


Those storms could be up to 45 percent more intense, making landfall 55 percent stronger - a "substantial" increase, said the research in the Proceedings of the National Academy of Sciences.

Stronger storm surges, winds and rain would likely be felt most acutely in the southern Indian Ocean, North Pacific and North Atlantic Ocean, and could raise risks of damage in coastal areas, he said.

Satellite data has shown that cyclones - which are rotating systems of clouds and thunderstorms - have remained relatively consistent in frequency and power over the past 40 years.

But he projected a steady uptick in the future using six different climate models combined with forecasts from the Intergovernmental Panel on Climate Change (IPCC), which predicts carbon dioxide emissions will about triple by 2100.

Tropical cyclones can bring heavy rains and winds, and vary in potency from tropical depression to tropical storm to hurricane. The Atlantic Ocean, Caribbean and Gulf of Mexico typically see about six hurricanes and 11 tropical storms per year, while the Pacific Ocean gets about 10 hurricanes and 19 tropical storms, according to US government ocean monitors. Cyclones form in areas where there is warm deep water and cool humid air. Wind over the water pushes thermal heat upward, causing the warming air to circle and get stronger.

The beginning of the Universe

$
0
0

The beginning of the Universe

About fourteen billion years ago, the Universe began in a gigantic explosion - the Hot Big Bang! Its subsequent evolution from one hundredth of a second up to the present day can be reliably described by the Big Bang model. This includes the expansion of the Universe, the origin of light elements and the relic radiation from the initial fireball, as well as a framework for understanding the formation of galaxies and other large-scale structures. In fact, the Big Bang model is now so well-attested that it is known as the standard cosmology.
This tour introduces the Big Bang cosmology and its successes, while emphasising its incompleteness and the areas in which cosmologists are currently working. The key question that interests us, as we delve backwards in time before the standard cosmology, is:

A history of ideas

M100, one of the spiral galaxies in the Virgo cluster
M100, one of the spiral nebulae, in the nearby Virgo cluster of galaxies (AAO photo)

Early 20th century: - the flattened 'island' or Kapetyn Universe

At the beginning of the twentieth century, it was generally accepted that our galaxy was disk-shaped and isolated. But what were the spiral nebulae like M31 (Andromeda) - were they inside or outside the Milky Way? Immanuel Kant had already speculated in the 1750s that these nebulae were, in fact, other 'island' universes.

1912: Slipher - redshifts of spiral nebulae

Vesto Slipher measured spectra from the nebulae, showing that many were Doppler-shifted, that is, the frequency of light was affected by speed of the source (just as the frequency of sound alters for a passing train). By 1924, 41 nebulae were measured, and 36 of these were found to be receding.

1918: Shapley - distance measure using variable stars

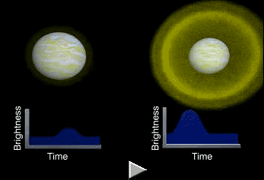
A key advance in cosmology came with the development of means to measure the distance to these nebulae. Shapley used Cepheids, bright stars which pulsate at regular intervals between a few days and a month. The period of their variability is correlated with their absolute luminosity, which he calibrated in the nearby Large Magellenic Cloud, an irregular galaxy that is a satellite to the Milky Way.
Animation of a diagrammatic Cepheid brightness variations with time (HST)Brightness variation of a Cepheid in M100 (HST photo). Click to view an HST animation of a Cepheid found in M100.
Figure 1. (left) Animation of a diagrammatic Cepheid brightness variations with time (HST)
Figure 2. (right) Brightness variation of a Cepheid in M100 (HST photo). Click to view an HST animation of a Cepheid found in M100

1923 - 29: Hubble - proportionality between velocity and distance

Hubble was able to resolve Cepheids in M31 (the Andromeda galaxy) with the 100" telescope at Mt Wilson, near Pasadena, California. He developed a new distance measure using the brightest star for more distant galaxies. He correlated these measurements with Slipher's nebulae to discover a proportionality between velocity v and distance d, that is, Hubble’s law v=Hd. The constant of proportionality H is called Hubble's constant (it was significantly over-estimated by Hubble himself).

1964: Penzias & Wilson - the cosmic microwave background radiation

Working with a horn antenna (7.35cm) at Bell Labs, Penzias & Wilson fortuitously discovered an isotropic, that is, uniform in direction, radio background, a relic left-over from the primordial fireball. This cosmic microwave background radiation is key evidence for the Hot Big Bang model. The temperature of this blackbody radiation is today measured to be T = 2.73K (that is, a rather cold -270C).

1986: de Lapparent, Geller & Huchra - large-scale structure, superclusters and voids

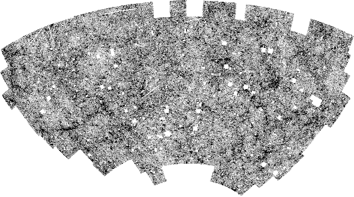
Deep redshift galaxy surveys demonstrated the existence of huge bubbles, filaments and sheets on scales from 25Mpc (1Mpc = 3.26 million light-years) to over 100Mpc. Subsequent galaxy surveys are providing detailed information about the distribution of large-scale structure. Radio galaxy and quasar surveys indicate homogeneity (or uniformity) is approached on scales of several hundred Mpc (that is, nearly a billion light years).
The APM survey of thousands of galaxies showing their large-scale angular distribution on the sky
Deep redshift galaxy surveys have discovered that groups of galaxies form large scale structures. These include huge bubbles, filaments and sheets that can span from 25Mpc to over 100Mpc (that’s over 3.08 × 1024 metres!). More recent galaxy surveys are have provided more detail about the distribution of these large scale structures, including the distribution of voids, areas with very or no galaxies at all that can span over 150 Mpc.

1992: COBE satellite - discovery of fluctuations in the cosmic microwave background

In April 1992, the COBE satellite team announced the discovery of anisotropies (or directional differences) in the cosmic microwave background radiation at the level of one part in 100,000. These are thought to be a snapshot at t=400,000 years of the primordial fluctuations that led to galaxy formation. This map of the sky is also the best evidence for the isotropy (or spherical symmetry) of the Universe.
The Hubble Space Telescope
Hubble

1995 - 96: Hubble Space Telescope - improved determination of Hubble parameter

The Hubble Space Telescope (HST) was able to resolve Cepheid variable stars in galaxies in the Virgo cluster, a cluster of galaxies near the constellation Virgo, ensuring a much better calibration of distance measures. This has allowed more accurate estimates to be made of Hubble's constant H. Early galaxies and quasars have also been observed by the HST raising serious doubts about current structure formation models.
y.

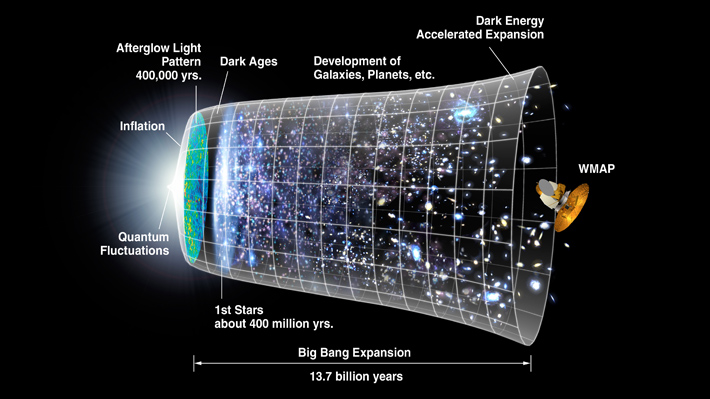
The Universe started approximately 13.7 billion years ago. The latest WMAP and Planck Satellites are able to see remnants of the Universe from when it was just 400,000 years old.

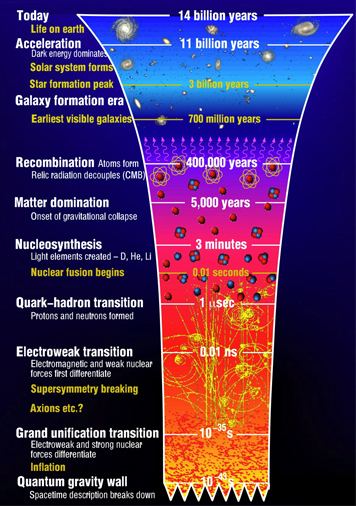
Chronology of the Universe

$
0
0

Chronology of the Universe

Cosmology regimes

The history of the Universe divides roughly into three regimes that reflect the status of our current understanding:
Thestandard cosmology is the most reliably elucidated epoch, or era, spanning the time between about one hundredth of a second after the Big Bang through to the present day. The standard model for the evolution of the Universe in this epoch has faced many stringent observational tests. Having said that, the standard cosmology still has a number of unresolved issues.
Particle cosmology builds a picture of the Universe prior to this at temperature regimes that still lie within known physics. For example, high energy particle accelerators at CERN and Fermilab allow us to test physical models for processes which would occur only 0.00000000001 seconds after the Big Bang. This area of cosmology is more speculative, as it involves at least some extrapolation, and often faces intractable calculational difficulties. Many cosmologists argue that reasonable extrapolations can be made to times as early as a grand unification phase transition.
Quantum cosmology considers questions about the origin of the Universe itself. This endeavours to describe quantum processes at the earliest times that we can conceive of a classical space-time, that is, the Planck epoch from the beginning of the Universe to 0.0000000000000000000000000000000000000000001 seconds after its beginning. Given that we as yet do not have a fully self-consistent theory of quantum gravity, this area of cosmology is more speculative.
Chronology of the Universe. Click for a larger image.

Chronology

The diagram here illustrates the main events occurring in the history of our Universe. The vertical time axis is not linear in order to show early events on a reasonable scale. The temperature rises as we go backwards in time towards the Big Bang and physical processes happen more rapidly. Many of the transitions and events in the picture will be explained through these outreach pages.

Orders of magnitude

The timescales and temperatures indicated on this diagram span an enormous range. A cosmologist has first to get the order of magnitude (or the power of ten) correct. Quantities which are given as 10 to some power 6 (say) are simply 1 followed by 6 zeros, that is, in this case 1,000,000 (one million). Quantities which are given as 10 to some minus power -6 (say) have 1 in the 6th place after the decimal point, that is, 0.000001 (one millionth). At extremely high temperatures we tend to use gigaelectronvolts (GeV) instead of degrees Kelvin. An electronvolt is the energy gained by a single electron as it moves across one volt. One GeV is equivalent to about 10,000,000,000,000K, or 1013K.

AN IMMEDIATE POTENTIAL FOR ENERGY SAVINGS

$
0
0

AN IMMEDIATE POTENTIAL FOR ENERGY SAVINGS

The Earth is getting warmer, sea levels are rising and our ecosystem is becoming increasingly vulnerable. Each day we hear new alarming facts and figures about the eco-impact of global energy use. There are many human factors, which add to the urgency. The global population, for example, is growing every day, and the energy needs of current and future generations will simply not be met unless we radically change the way we use energy now. This is why we must aim for energy solutions, which can create CO2 reductions that are both substantial, and immediate.


industrial energy efficiency

A widely available, but primarily unknown solution

One of the greatest opportunities for energy savings lies with pumps. They are present where ever liquid needs to be circulated, cleaned or removed. There is an almost infinite list of pump applications and they require huge amounts of electrical energy to keep them going. Collectively, this means that pumps are responsible for an enormous carbon footprint.

Yet, most pumps currently installed are larger than necessary for the job at hand, often using 60% more energy than they should. In fact, most pump systems are so inefficient that if every business in the world switched their pump system to energy-efficient ones, it would save the same amount of residential electrical energy as 1 billion people use in a year. So it is more than obvious that changing a pump for a more energy-efficient model presents a tremendous opportunity for energy savings.

ALL YOU NEED TO KNOW ABOUT PUMPS AND ENERGY

$
0
0

ALL YOU NEED TO KNOW ABOUT PUMPS AND ENERGY

Pumps are involved in nearly every aspect of modern living. They are used to move fluids such as liquids, slurries or gasses.

In businesses, buildings, households and industries, pumps exist - in some form or another. They are key components in maintaining comfort levels in buildings. They deliver and distribute clean drinking water from water treatment plants throughout cities, while at the same time removing wastewater. And, they are highly present within a wide range of industries. The world depends on them, but many pumps are also serious energy wasters, leaving behind a significant carbon footprint. This is because today's pumps account for no less than10% of the world's electricity consumption and because the majority of electricity is still produced using fossil fuels [1].

Pumps and the world's electricity consumption

procent_billede

  • Today pumps account for no less than 10% of the world's electricity consumption.
  • Two third of all pumps use up to 60% too much energy [2].
  • If every business switched to a high efficiency pump system there could be global savings of 4% of the total electricity consumption- comparable with the residential electricity consumption of 1 billion people.

WHY WAIT UNTIL TOMORROW WHEN CHANGE CAN BEGIN TODAY

$
0
0

WHY WAIT UNTIL TOMORROW WHEN CHANGE CAN BEGIN TODAY

Today much of the energy consumed by pumps and pump motors in particular goes to waste. This is because most pumps currently installed are larger than necessary and they run continuously at their top speed regardless of actual requirements. It's easy to understand why it's unnecessary for a pump to run at full speed during the times when a business is closed, and yet most do. In reality most pump motors only have to run at their full speed 5% of the time[1]. This is true for all kinds of pumps: in commercial buildings, industrial applications, public buildings and water utilities. This means there are major opportunities for energy savings by utilizing a more efficient pump technology. One that is more intuitive, and allows for speed adjustment, depending on how much energy it needs to use.


These pump solutions already exist today, and although the initial cost to make the switch to more efficient pumps may seems unnecessary, the energy savings are immediate, and the payback time can be less than 2 years.

WHERE TO LOOK AND WHERE TO BEGIN

Even though pumps play such a tremendous role in the way we live in the modern world, they are largely overlooked. In fact, most people have no idea what a pump does, or where you would find one in their business. Pumps have somehow been overlooked in the raging debate about energy efficiency, carbon footprints and corporate social responsibility, because they don't have the same dramatic impact as other energy saving sources. And yet, they represent a solution, which is viable to everyone. And the savings are immediate.
One of the first things you can do towards a more energy efficient pump system is to collect some basic information about your company's current system and its annual life cycle costs.

1. Contact your chief operating officer (COO)/ DIRECTOR/ VP
  • The COO will know:
    Who is in charge of the pump installations?
    What is your annual electricity consumption?
    What share of consumption do pumps account for?
  • And if possible
    How has electricity consumption of pumps developed over the last five years?
2. Then you ask the following:
    How many pumps and motors are installed?
    How old are the pumps?
    What types of pumps are installed?
    What is the annual volume of water pumped?
  
3. Create a list of all pumps and note where they are installed.

Understanding variable frequency drives

$
0
0

Understanding variable frequency drives


VFD use is increasing because users say VFDs improve manufacturing processes and reduce cost. Understanding how they do their job can help as you consider deployments.

Stephen Prachyl, Siemens


If you’re involved with trying to save energy in your plant, at some point you have probably looked into variable frequency drives (VFDs) for ac motors. Reports from all directions say they can help save energy, reduce maintenance, and cut utility costs. The questions are: are they as good as they sound, and how do they work?

A VFD controls the speed of an ac motor, which provides flexibility to the process since speed can be changed easily for process optimization. It takes the fixed power supplied to it and converts it into a variable frequency and variable voltage source which then feeds a motor. This allows the drive to control the speed and torque the motor produces.  
A VFD may enhance the user’s profitability by improving the process, which in turn produces a fast return on investment (ROI). Process improvements may come from better:
  • Speed control;
  • Flow control;
  • Pressure control;
  • Temperature control;
  • Tension control;
  • Torque control;
  • Monitoring quality; and
  • Acceleration/deceleration control.
Many applications that use ac motors would benefit from the use of such drives because they can also reduce operating costs while improving the process. Reduced costs come from:
  • Increased system reliability;
  • Reduced downtime;
  • Reduced equipment setup time;
  • Energy savings;
  • Lower maintenance;
  • Smoother operation—less wear and tear; and
  • Power factor control.
The net result of these improvements is increased profitability.
Evaluating applications
Different drive applications have different criteria that should be evaluated individually. For example, when used in a centrifugal pump or fan application, an ac drive saves energy by allowing the user to adjust the speed of the motor to the most efficient level. This can often be as much as a 60% energy saving over fixed-speed motors with valve controls. This is usually enough to pay for the drive within a short period of time.
When discussing VFDs and energy savings, the attention often focuses on this type of centrifugal fan or pump application. However, there are other applications that also have large potential energy savings and/or recovery based on easily applicable concepts that should not be overlooked. These applications are power factor correction, regeneration, common bus applications, or a combination of all three. Let’s examine all these and see how using the right drive generates its benefit.
Centrifugal applications: laws of affinity
The cost savings in a centrifugal fan or pump application are primarily derived from two components:
  • The laws of affinity, which shows an operating range that produces the most flow or pressure per horsepower. (See Figure 1.)
  • Removal of any mechanical flow device that limits the flow of a fan or pump while the motor turns the application at a fixed speed. (See Figures 2 and 3.)
The ac drive installation continues to save energy for many years after the initial payback period, as well as lowers the maintenance costs and provides a more consistent flow of product. When a centrifugal fan or pump is used with mechanical flow control, converting the application to an adjustable-speed ac drive will save from 10% to 60% of energy cost if the fan or pump system is designed to operate between 40% to 80% percent of full speed. This application typically produces a return on investment in the 6- to 24-month time frame.
The laws of affinity state:
  • Flow is proportional to shaft speed;
  • Head (pressure) is proportional to the square of shaft speed; and
  • Power is proportional to the cube of shaft speed.
When comparing the different methods of mechanical flow control, the graphs clearly show that the only one that gets close to the maximum efficiency of the theoretical fan curve or pump flow is a VFD.

Power factor
What is power factor (PF)? AC power has two basic components: voltage and current. When these two components are not in sync, power is wasted due to inefficiency. This is called power factor displacement. To make matters worse, when the ac power has a high level of harmonic content called power factor distortion, the displacement and distortion are multiplied by each other, which further decreases efficiency.

If you have ever received a bill from your electric utility company penalizing your plant there is a good chance that a power factor displacement issue exists. Even if the power company does not charge an extra penalty, you are still paying for the excess energy that is used. Therefore, getting the power factor displacement close to unity is very important.
Here is a graphic example of total power factor, power factor displacement and power factor distortion (harmonics):


Power factor penalties
While each utility may charge differently, two common ways that utilities charge are by KVA (Lower PF = higher Amps) or by kW with a PF penalty.
If the power factor is less than 90%, the measured kW demand will be multiplied by the ratio of 90% divided by the actual power factor:
                  100 kW motor with 0.85 power factor: (100 kW*0.9) / (0.85 PF) = 105 kW
In this case the increase in cost is 5% of your bill in addition to the wasted kvar as in the previous example.
The second method is an adjustment of demand for power, where demands will be adjusted to correct for average power factors lower than 95%. Such adjustments will be made by increasing the measured demand 1% for each 1% or major fraction thereof by which the average power factor is less than 95% lagging.
In this case the penalty increase is 1% for every 1% that the power factor is below 0.95 in addition to the wasted kvar.
While there are power factor correction devices available, such as capacitors and filters, an ac drive is often overlooked as a method for correcting power factor displacement while at the same time having a low distortion level. A VFD with an active front end (AFE) has the ability to adjust its power factor operating point as well as limit harmonics to less than 4%. As a comparison, when using a standard six-pulse ac drive with a diode rectifier that converts input ac voltage to dc bus voltage, the typical harmonics level is 30% to 40%. There is at least one AFE ac drive available today that has the ability to adjust its power factor from 0.8 leading to 0.8 lagging and that meets IEEE 519 harmonic standards for low power factor distortion. This means the drive can improve the present power factor displacement in a facility.
Distortion power factor describes the decrease in average power transferred due to harmonics and to phase shift between current and voltage.
How much this costs and how much can be saved depends on the amount of displacement and distortion that currently exists. 
Regeneration
An ac motor may act either as a motor that turns electrical power into mechanical power or as a generator that converts mechanical power into electricity. It depends on whether the motor is turning a machine that requires power to turn the machine or whether the load of the machine will at times overhaul the motor. (Overhauling is a condition where the mechanics or physics of the load mechanically cause the motor to attempt to turn faster than the motor speed the drive is commanding and the drive is used to slow down the motor speed.) This overhauling condition may exist in several types of applications.
1. Constant deceleration: When a load such as a decline conveyor operating under the influence of gravity will overhaul the motor’s speed and the drive is used to control the conveyor speed to a slower level than what the natural physics of the application would produce.
 2. Periodic deceleration: When a load is stopped quickly and the inertia of the load wants to keep turning, such as a large drum. In this case the cycle time, or how many times the load is stopped over time, as well as the magnitude of the stopping power required, determines how much energy can be saved.
3. System tension/holding torque: When two sections of a machine are used to create tension on the material between them, such as on the metal strip in a strip mill. The two sections may be running at the same speed, but the process requires a certain amount of tension on the strip to run properly. This means the lead section will run in the forward direction and pull the strip, and the following section will also run in the forward direction and at the same time provide the needed torque in the reverse direction of the strip, thus creating the proper tension.
In each of these examples the motor and drive combination has the ability to recover the electrical power produced by the motor when it is acting as a generator, and sends that power to the utility company. How much energy is saved is dependent on the application, but it can be significant. One such application where significant savings can be recovered is a gearbox test stand. When the gearbox is tested, one drive and motor are used to turn the gearbox while another drive and motor are used on the other end of the gearbox to simulate the load. Done correctly, this application will operate with a very low amount of total energy, as the amount of energy used to turn the gearbox is the same amount of energy that is recovered from the simulated load on the gearbox, less the losses in the system. The one question you should ask when trying to determine if the application is regenerative is, “Does the load, at any time, try to turn the motor (regenerative recovery), or is the motor being used to turn the load?”
Common bus
When there are multiple ac drives in one location, a common bus system is usually the most efficient way to operate. It can incorporate the energy savings and recovery concepts that have just been discussed. If there is a regenerative ac drive and motor section in the system, it is ideally suited for maximizing energy recovery and cost savings. The reason for this is that losses are generated when power is converted from the ac supply to the dc bus or from the dc bus to the ac supply. When you have multiple stand-alone drives, the power must go through two or more ac-to-dc conversions, and two dc-to-ac conversions. (See Figures 8 and 9.) In a common bus configuration, power goes through only one ac-to-dc conversion in the motoring direction, and when an inverter section of the drive regenerates power to the dc bus, the power goes straight to another inverter via the common dc bus link, which is motoring and does not have to travel through a converter at all. This method eliminates two conversion points where energy would be lost. This increases efficiency by 2% to 4% for each regenerative section. If you have more sections that are regenerative, you will accumulate more energy savings. In addition to the savings of a common bus solution, if you have an AFE, the system will have the ability to do power factor correction, which increases the savings of a common bus system. The gearbox test stand is a great example of a common bus solution. Here there is one forward motoring drive motor section and one regenerative drive motor section. In this specific case the two drive and motor sections were rated at 1,000 A at 690 Vac each. Yet the incoming ac line and input modules were able to be sized at less than 1,000 A at 690 Vac. This was possible because one of the two sections required 1,000 A in the motoring or torque producing direction, while the other section that provided the load was able to recover through regeneration close to 1,000 A, less the losses in the system. Therefore, the amps generated from the recovery section almost canceled out the 1,000 A from the section providing torque to turn the gearbox, and the input ac could be sized at slightly larger than the losses of the system, which in this case was roughly 200 A at 690 Vac. This resulted in a lower installation cost due to the smaller ac-to-dc section. The application recovered $75,000 per year in energy costs, which translated to a four-year payback.

This application combined the efficiency of a regenerative system in a common bus configuration. If the plant would have had a power factor correction issue, the common bus solution would have been able to accumulate those savings into this total as well.

In conclusion, when using an ac drive and motor combination, there are many different applications and methods for which the energy savings and energy recovery can be significant. While there is typically much focus on the drive’s initial cost, each application should be reviewed to determine the maximum amount of increased productivity and decreased operating cost due to energy savings and energy recovery. In many cases energy savings and operating cost are much higher than the cost of installing the drive.
Viewing all 8077 articles
Browse latest View live